Archive for ISO

A New Hitter xISO, Now with Exit Velocity

Over the last few years, Alex Chamberlain has published a series of posts exploring the concept of xISO. Like the most commonly known xFIP, this metric is supposed to be an “expected” ISO, based on batted ball metrics. Nobly, Alex kept his model quite simple, using only statistics available on the FanGraphs player pages: Hard%, FB%, and Pull%.

I have very little formal training in statistics, most of it is self-taught to help me in my day job, so I’m also going to keep things simple. Inspired by Alex’s work, I began to experiment with improving the xISO model. I started building linear models including more predictors, and even introduced higher order and interaction terms. While these all improved the model slightly, I didn’t feel that the added complexity was worth the slight improvement. Along the way, I noticed that, although Chamberlain makes mention of the correlation between first half xISO and end of season ISO, if I calculated first half xISO and compared to second half ISO, I would find the initial xISO model to be a worse predictor of second half ISO than the actual first half ISO.

As I was running these calculations, I also became acquainted with the publicly available Statcast data through Daren Willman’s Baseball Savant site. Although the gathering of input data becomes a bit more tedious, surely some combination of exit velocity and launch angle information would improve an xISO model, and perhaps produce something which produces a better correlation between first and second halves. Let us see!

First things first, since Statcast is so new, we only have one full season of data. Ideally, we could use multiple years of data to build the model, but for now, we’ll stick with 2015 full season to train the model. As it turns out, the Statcast parameter that correlates best with ISO is the average exit velocity for line drives and fly balls (LDFBEV). This makes sense, right? It also makes sense that we can exclude ground ball exit velocity in an ISO predictor. Launch angle seems to have some relationship with ISO, but it’s relatively weak.

So, we’ll hang our predictive hats on LDFBEV and see what else can help. After constructing various models, we can pretty quickly see that Pull%, Center%, and Oppo% don’t add much additional explained variance between model and data, nor do Soft%, Med%, and Hard%. This isn’t surprising, since we already have an objective hard contact measure. Ultimately, the one traditional batted ball statistic that helps is GB%. In fact, in the final regression, adding GB% nets us about 18% more explained variance between model and data. This also makes sense. It’s pretty hard to hit a ground ball double or triple, and really hard to hit a home run.

So we’re down to two predictors, GB% and LDFBEV. If we ran a regression with only these two predictors, we would undersell the players who hit the ball really hard. To solve this, we’ll simply include another term in the regression, simply the square of the exit velocity. Throw in a constant term, and we’re ready to run the regression using all 2015 qualified hitters (141 of them). Here’s what comes out:
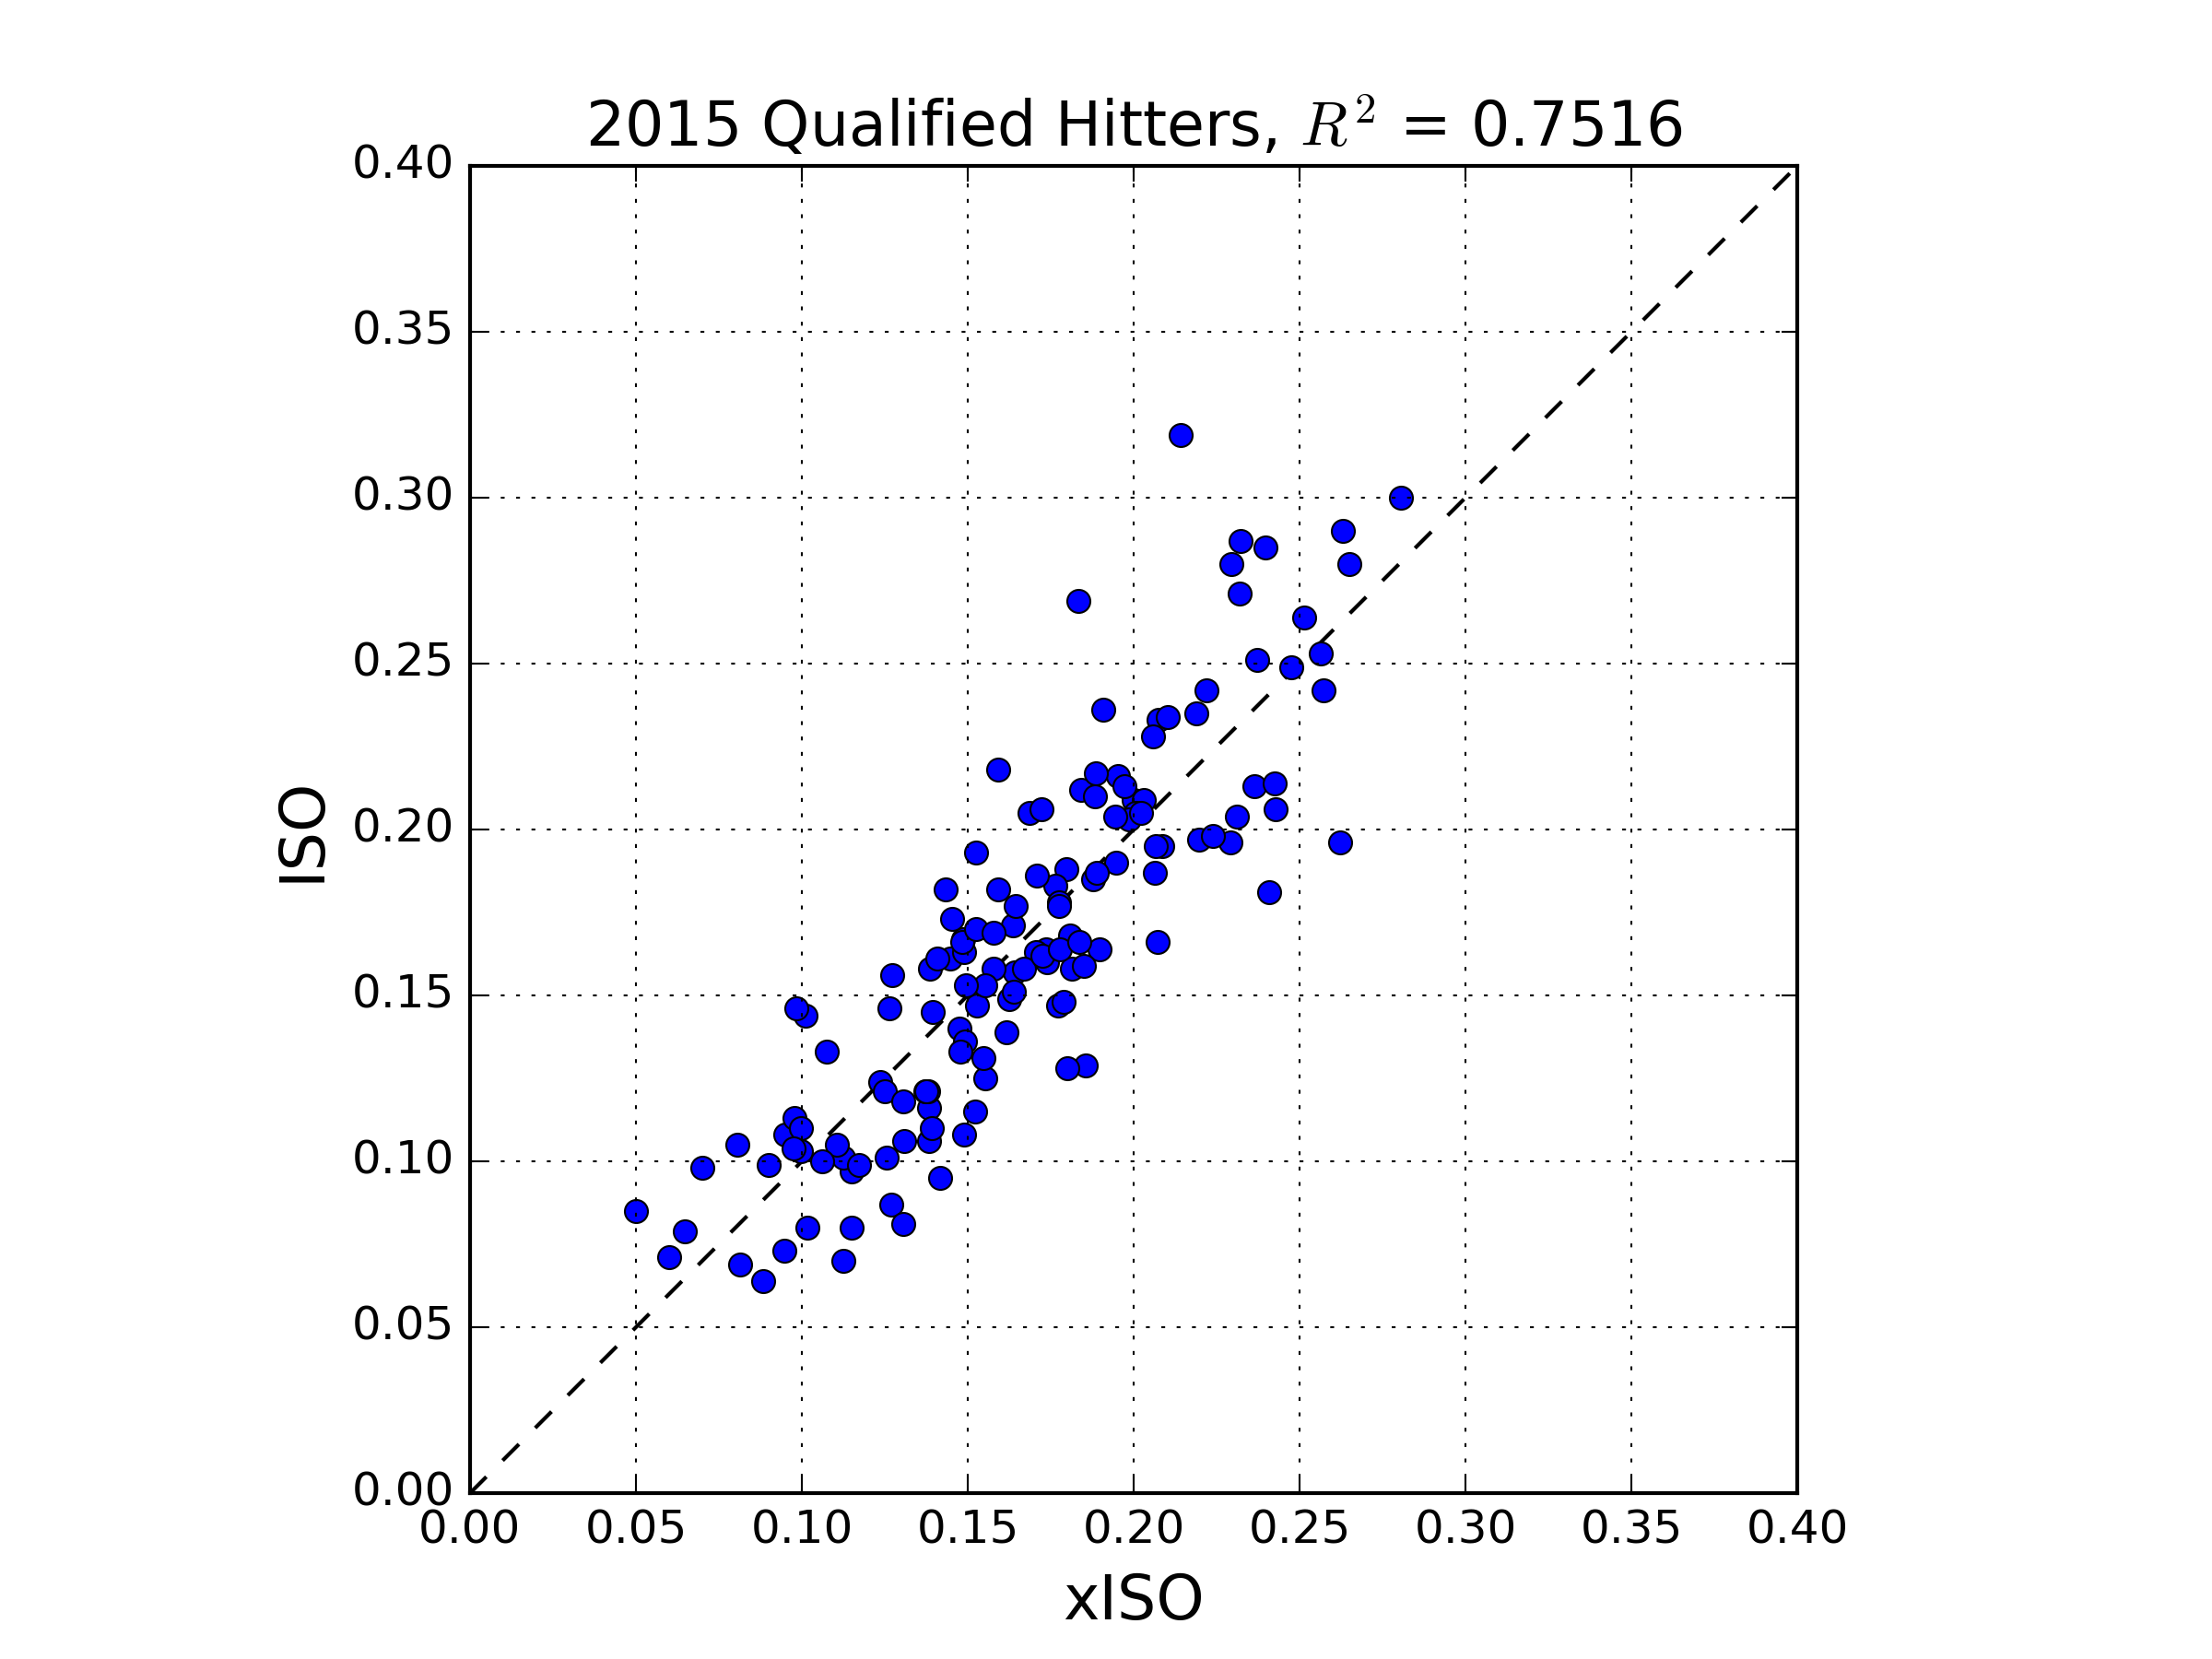
xISO Model Regression

First things first, we see an R-squared value of 0.75. This is pretty decent; it means our really simple model explains 75% of the variance of of the ISO data. The regression coefficients are as follows.

xISO = -0.358973*(GB) – 0.108255*(EV) + .00066305*(EV)^2 + 4.66285

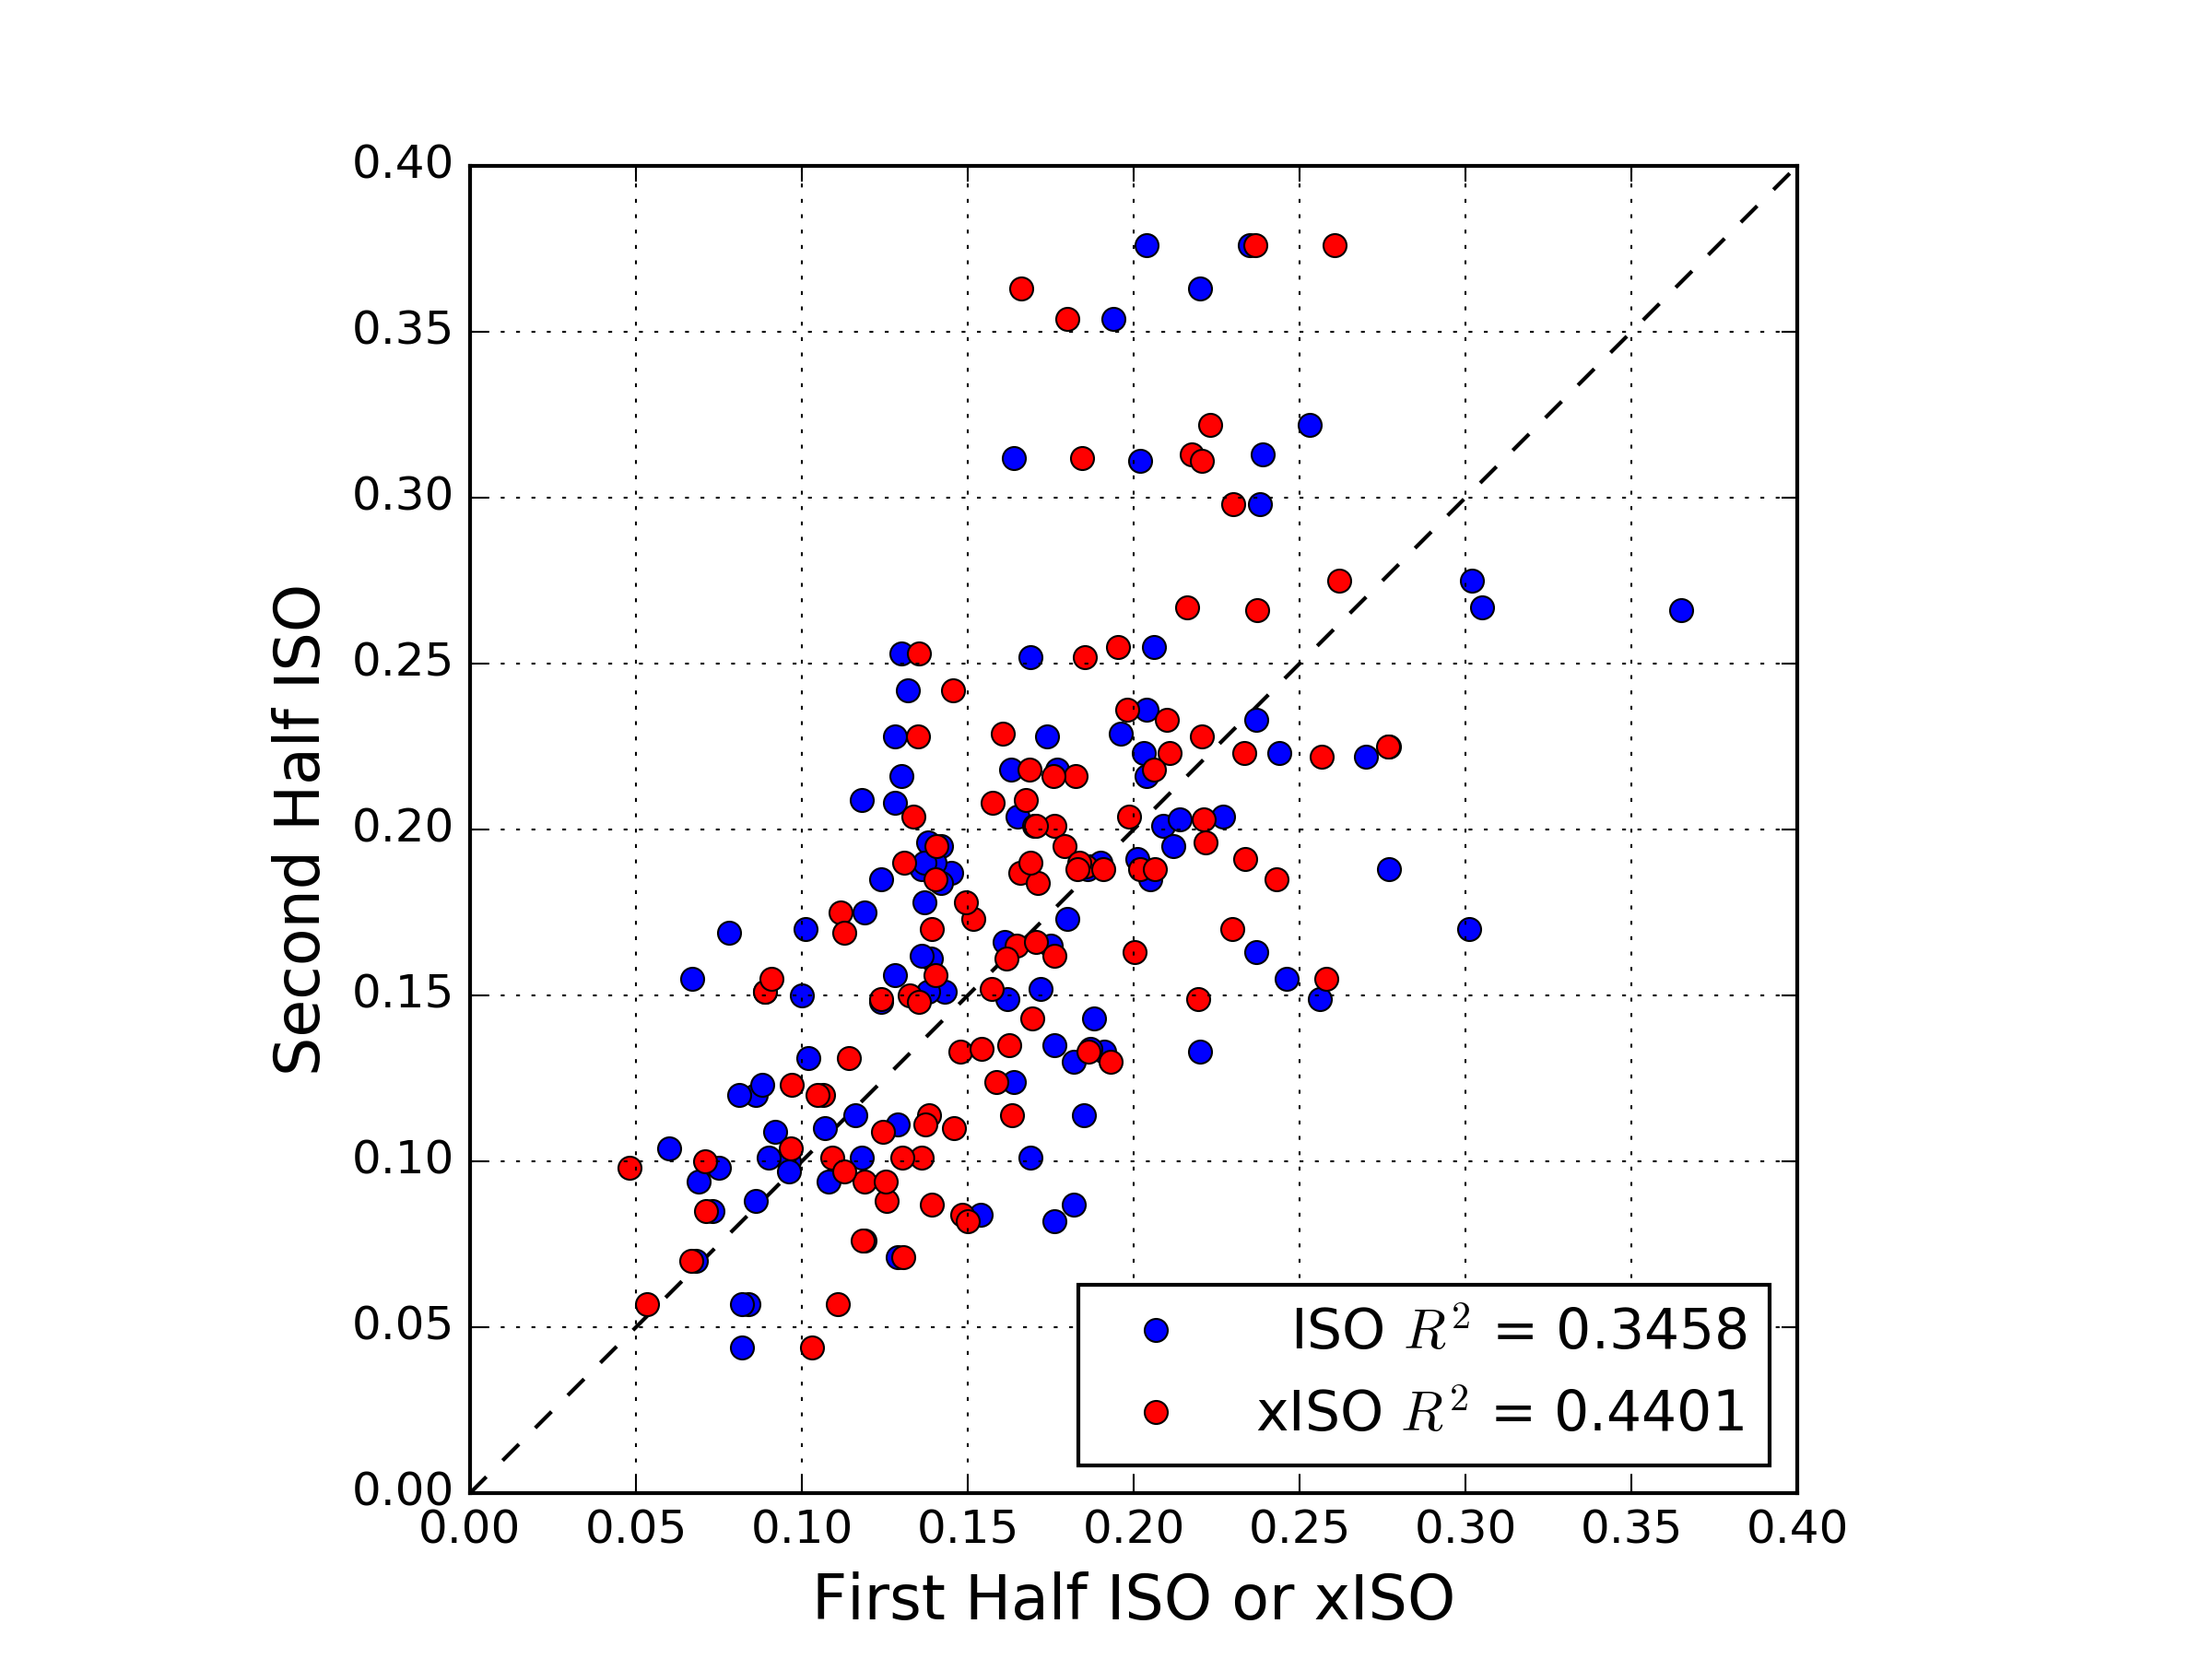
With this equation, one can look up the relevant data on FanGraphs and Baseball Savant, and calculate the current xISO for any given player. We’ll get to that, but first, I think it’s important to check whether the new xISO model can do a better job predicting future performance than a player’s current ISO. One could also check how quickly xISO stabilizes, compared to ISO, but I won’t attempt that here. What I will do is produce the necessary splits for GB%, LDFBEV, and ISO from FanGraphs and Baseball Savant, calculate 2015 first half xISO for all qualified, and compare to second half ISO. Unfortunately, the number of qualifying players common to the first and second half in 2015 was only 109, but this is what we have:
First Half Second Half

It’s hard to see from the plot, but the R-squared values tell the story: first half xISO does a better job than actual first half ISO at predicting second half ISO. Interestingly, it seems that several players significantly increased second half ISO compared to first half xISO or ISO, and relatively fewer saw a large decrease. I don’t know why this is, but perhaps it is related to the phenomenon detailed by Rob Arthur and Ben Lindbergh on the sudden power spike in 2015.

Having roughly demonstrated the predictive power of our new xISO, let’s show its utility by looking at a few interesting 2016 performers, as of May 22nd:

Trevor Story: ISO = .327,  xISO = .272

Domingo Santana: ISO = .142,  xISO = .238

Troy Tulowitzki: ISO = .190,  xISO = .182

Chris Carter: ISO = .349,  xISO = .355

Christian Yelich: ISO = .205,  xISO = .201

One of the first half’s great surprises, Trevor Story has a slightly inflated ISO, but he does hit the ball pretty hard, and does not hit many ground balls. While he probably won’t sustain an ISO north of .300, he’s a good bet to beat his Steamer ROS projected ISO of .191. Santana and Yelich are two guys who hit the ball hard, but are are held back by their ground ball tendencies. Chris Carter currently leads the pack in LDFBEV, and is a deserved second in ISO. Troy Tulowitzki fans: sorry, but it appears his days of .250 ISOs are a thing of the past.

So that’s it! We’ve got a cool new tool to use. Perhaps not surprisingly, I’ll be mostly using it for fantasy. Dedicated FanGraphs readers will also note that Andrew Perpetua has been doing work with Statcast data on “these electronic pages” recently as well. His use of launch angles introduces more sophistication into the models, but also more complication. My intent here is to present something which can be evaluated by anyone with a few clicks and a calculator. Please reach out with any qualms, criticisms, or suggestions for improvement!


What Has Happened to the Second Basemen?

 2nd Base hasn’t been a particularly stacked position in the major leagues in the past five years. Entering the 2015 season, the 2nd base position was headlined by Jose Altuve and Robinson Cano. The second tier arguably consisted of Ben Zobrist, Neil Walker, Dustin Pedroia, and Ian Kinsler, and maybe Brian Dozier. Then the next level housed names like Jason Kipnis, Daniel Murphy, and maybe DJ LeMahieu. I’m here to analyze what has possibly happened to this group of baseball players in the past few months.

According to the Depth Charts pre-season projections, the top eight second basemen ranked by wOBA were Robinson Cano, Neil Walker, Ben Zobrist, Jose Altuve, Dustin Pedroia, Ian Kinsler, Howie Kendrick, and Chase Utley. The projections are usually somewhat accurate, but if you’ve been following baseball at all this season, just by looking at those names, you know that we’ve found an exception to that.

These are the top 10 second baseman thus far in the 2015 season ranked by wOBA:

Name Team G PA HR BB% K% ISO BABIP wOBA wRC+
Jason Kipnis Indians 69 322 5 10% 13% 0.17 0.396 0.409 169
Brian Dozier Twins 70 310 14 9% 19% 0.257 0.276 0.363 133
Logan Forsythe Rays 72 284 8 9% 15% 0.161 0.325 0.363 139
Joe Panik Giants 69 296 6 9% 12% 0.156 0.326 0.362 137
Dustin Pedroia Red Sox 68 311 9 9% 12% 0.147 0.325 0.358 127
Dee Gordon Marlins 68 311 0 3% 15% 0.071 0.418 0.347 120
Danny Espinosa Nationals 62 229 8 9% 22% 0.187 0.317 0.345 118
DJ LeMahieu Rockies 68 274 4 7% 16% 0.103 0.373 0.344 102
Kolten Wong Cardinals 69 284 8 7% 14% 0.163 0.3 0.336 114
Jace Peterson Braves 66 270 2 11% 17% 0.103 0.337 0.327 107


If I told you in April that Logan Forsythe would be the 3rd best second baseman in the league, you would think I’m ridiculous. He came absolutely out of nowhere to raise his BABIP nearly 60 points and raise his ISO 55 points! Joe Panik’s beautiful swing has moved him up to be the 4th best-hitting 2nd baseman. Jason Kipnis has shut up all the critics. He took his .310 2014 OBP as confidence going into this year, and now has a wOBA over .400. Danny Espinosa, who has been previously known as a ‘defensive’ second baseman, has skyrocketed his offensive production into a player who Matt Williams is comfortable having run onto the field every day. Cardinals 2B Kolten Wong is pulling the ball more and more every season. He’s also upped his LD% from 19% to 25%. Braves utility-infielder Jace Peterson is doing a bit of hitting in his rookie year, after being traded from San Diego (who, it turns out, could really use him) to the Braves in December. Think back to when I mentioned the tiers up top. Where is Robby Cano on the list above? Where’s Altuve? I don’t see Zobrist, Walker, or Kinsler on this list either. It is not an error.

So we talked about the breakouts at 2nd; now lets talk about the guys who haven’t or haven’t yet lived up to expectations.

Lets start with the guy who all of his fantasy owners hate this year. Robinson Cano. Yeah, the six-time All-Star Robinson Cano. The 32-year-old — the guy who has a wRC+ of 76. This is easily, by far, his worst season of his 11-year career. Why? Lets talk about it.

Cano has raised his Hard% and his Pull% over 4% each! What does jump out at you is that he’s making a ton less contact than he did last year. Actually, the least of his whole career. His Contact% has plummeted down almost 5%. Along with a raised K%, his BABIP has jumped down nearly 50 points.

The next guy is Altuve. Altuve hasn’t been that bad this year, but compared to his 2014 campaign, he’s not playing like Jose Altuve. He’s even fighting with a mild hamstring injury, but in his 287 PA’s, every single one of his numbers are down. His wOBA has decreased .363 to .304. BB% is down, strikeouts are up, OBP and SLG are both way down. He’s swinging more, and making less contact which isn’t a combination that pulls you in a positive direction.

Same can be said for Neil Walker. Almost all his numbers are down. One of the positives that I found, though, is that he’s hitting the ball harder. My prediction is that the .303 wOBA will start to show positive regression. Ian Kinsler isn’t having a horrible season. He’s raised his OBP a bit, but he’s becoming more of a singles hitter, dropping his SLG from .420 to .338.

Almost every starting second baseman in the big leagues has totally changed their style of hitting this year. Guys like Forsythe and Panik, who were projected to be replacement level or below, have made their names rise to the top of many leaderboards. Cano and Altuve’s value have fallen. Here’s your homework: Think of all the 2nd baseman in the major leagues. How many of them have close to similar stats from their projections? Comment down below.


The Grandyman (Still) Can

For every Dontrelle Willis–who continues to get looks from Major League teams despite over eight years of complete ineptitude–there exists a handful of other players who fade into relative obscurity only a year or two removed from a dominant season. All it generally takes is a down year resulting from–or paired with–an injury to send a guy spiraling below the radar. These are often the players that can return the most value during fantasy drafts if you can make the distinction between a year that’s an aberration, and one that is a bellwether for a significant, irreversible decline in skills.

While I can’t say with complete confidence that Curtis Granderson’s 2014 doesn’t fall into the latter category, there were a couple of encouraging things going on below the subpar surface stats that make me think he can return some solid value this year, especially considering where he’s going in most drafts.

Granderson was 33 last year and coming off an injury-shortened season. He was also trading a left-handed pull hitter’s haven in Yankee Stadium for the cavernous confines of Citi Field. All things considered, it was natural to expect some significant regression. And when he hit .136 through his first 100 at-bats of the season, it seemed like the Mets might have had a disaster of Jason Bay-like proportions on their hands.

Fortunately for them, Granderson managed to right the ship to an extent, putting together a couple of excellent months. His final line of .227/.326/.388–dragged further down by a nightmarish .037 ISO, 16-for-109 August–wasn’t spectacular by any stretch. But there were some nice takeaways buried in there.

For one, his bat speed doesn’t seem to have slowed enough to justify the statistical hits he took across the board. Despite seeing 56.3% fastballs–the most he’s seen since 2010 by a wide margin–his Z-Contact % of 85% was in line with his 85.8% career average, and not far removed from the league average of 87%. I suspect the uptick in fastballs resulted from opposing teams banking on an age-slowed swing, but Granderson’s contact rates on high velocity pitches in the zone didn’t suffer for it.

Granderson also set a career high in O-Contact % with a 62.7% rate. This could usually indicate a lack of plate discipline as much as it could a sustained bat speed, except that Granderson’s O-Swing % of 26.2% is roughly the average of what he did in the four years prior. He also managed to post the second-highest walk rate of his career (12.1%) and his lowest strikeout percentage since 2009 (21.6%). These are not particularly impressive rates in their own right, but in the context of Granderson’s career they do help to dispel the notion that last year was the beginning of the end for his hitting ability.

That is not to say, of course, that I foresee a return to the 40 home run, .260+ ISO form that he flashed in his early Yankee years–there’s no way he ever touches the absurd 22 HR/FB% that sustained that run. But with the right field fences at Citi Field moving in–a change that apparently would have resulted in 9 more home runs for Granderson had it been done last season–and some improvement on last year’s uncharacteristically bad .265 BABIP, I would not be at all surprised to see a home run total between 25 and 30 to go along with double-digit steals and a batting average that won’t kill you. And that has value when it is being drafted as low as Granderson currently is.