Archive for Giancarlo Stanton

Sizing Up the “Most X of the Decade” Races; Plus Bonus Trout Stuff

Admittedly, this is a bit of a stupid topic. These distinctions are often thrown around with an air of importance that is far from earned. Nobody ever mentions that Hank Aaron had the most RBIs in the 1960s. You don’t need to talk about arbitrary endpoints with the Hammer. Mentioning that a player holds one of these “records” is a bit like saying a guy you are trying to set a friend up with has a great personality. It’s likely that this is covering up for something else like a hat covers a balding head.

(*before you head to the comments to blast me, yes, RBI is an incredibly useless statistic)

But they are fun! Hank Aaron did lead in RBI in the 1960s, but he finished second to Harmon Killebrew in home runs. Growing up into a baseball fan in the 1990s, one of the bigger surprises in this genre of record was the hit leader of that decade: Mark Grace. I’d imagine every Cub fan knows this. In addition, anyone who knows a chatty Cubs fan probably knows this, too. Looking at the most recent decade, there are a few surprises: Miguel Tejada had the most games played and at-bats. Andy Pettitte edged out Randy Johnson for most wins. Johnson, along with Alex Rodriguez, dominated most of the categories.

Moving to the point of this article, here is a quick rundown of compelling and not so compelling races to have the most X of this decade, with two seasons remaining:

WAR

You, the Fangraphs reader that goes into the depths of the Community Research section, probably know who leads this category, despite spending 2010 in A ball. But it is a bit closer than you might have thought. While Trout could conceivably win the position player award while sitting out the next two seasons (Joey Votto is the only player that might topple him in this scenario, and he is 9.1 WAR behind), this is the one major statistical category in which position players and pitchers compete with each other.

If I just jogged your memory of that, you probably know the name that is coming: Clayton Kershaw. Trout leads with 54.4 WAR. Kershaw has 52.1 WAR on the pitching side, but has also accrued 1.8 WAR as a batter. That should count. So Kershaw, at 53.9 WAR, is directly on Trout’s heals. Trout is still the heavy favorite, but Kershaw has a puncher’s chance, especially if another injury befalls Trout.

Totally made up odds: Trout, 98%; Kershaw, 2%

Hits

Jose Altuve has put up four straight 200-hit seasons, but he is 251 off the pace and in 15th place. No, this title will most likely go Robinson Cano. Cano leads with 1501, and the only players within sniffing distance are similarly on the downside of their primes. Miguel Cabrera is second at 1416, and then there is a slew of players, including Fangraphs favorite Nick Markakis, in the low to mid 1300s.

Cano should clear 150 hits the next two seasons, and if he does, he will not be passed. Cabrera, as bad as he looked at times last season, would be the likely beneficiary of some unforeseen collapse by Cano. Elvis Andrus is the end of that slew of players behind Cabrera. He has 1329 hits, but recorded 191 last season and is significantly younger than everyone in front of him. I’m going to give him sleeper status for this title.

Totally made up odds: Cano, 93%; Cabrera, 5%; Andrus, 2%

Home Runs

Currently, this is an incredibly close race, with four players within five homers of each other at the top of the list. Jose Bautista is first with 272. Edwin Encarnacion and Nelson Cruz are second and third, and then you get to Giancarlo Stanton in fourth place with 267. Other than Miguel Cabrera and the remnants of Albert Pujols, no one else is close. Stanton has to be the favorite, here, but his status is extremely tenuous. First, let’s just get Buatista out of the way. He’s unemployed and several steps below the other players even if he does try to gut out two more seasons.

Without a doubt, it would be shocking if a healthy Stanton didn’t win this. But a healthy Stanton would be at least a little bit of a shock. The once-oft-injured Cruz and Encarnacion are 37 and 35, respectively, but are still mashing and project for mid-to-high 30-something homers apiece. Cruz has played four straight full seasons and E5 has three straight under his prodigious belt. Stanton is projected by Steamer for a literally—but not really literally—bananas number of 53 home runs. The Fans of Fangraphs are more modest, pegging him with only 48. But Stanton is injury prone. You all know that. There is no argument that he is not. So this is a fairly open race.

Totally made up odds: Stanton, 55%; Encarnacion, 25%; Cruz, 20%

RBI

Again, I do know this is a stupid statistic. But artificial endpoints of decades are pretty stupid, too, so this is fitting. This is Miguel Cabrera’s title to lose, and as long as he plays, he should easily win. And guys making the cash Cabrera is due for the next thousand years generally get every opportunity to play. Sitting behind Cabrera’s 860 RBI are Albert Pujols at 806 and Robinson Cano at 789. The aforementioned Edwin Encarnacion and Nelson Cruz round out the top five with 763 and 756 respectively.

If Cabrera falters, this looks like it would be a wide-open race. Pujols achieved the remarkable 100+ RBI season while losing 2.0 WAR last year. He likely will do much worse, but as long as he is playing, he will continue to accrue a decent number of RBI. E5’s Indians outscored the M’s by 68 runs last year and seem to be a better offensive team, but Cano does have a 26 RBI lead. Honestly, this looks like a virtual toss-up if Cabrera doesn’t win, but the idea of Edwin Encarnacion or Nelson Cruz leading the decade in home runs and RBI is rather delicious.

Totally made up odds: Cabrera, 80%; Cano, 7%; Encarnacion, 6%; Cruz, 4%; Pujols, 3%

Stolen Bases

Be honest, which would you rather be known for: a surprise answer to the question “who stole the most bases in the second decade of the new millennium?” or hitting an epic World Series Game Seven home run… for the losing team. Rajai Davis might say porque no los dos? Davis has the most stolen bases this decade with 301. However, he is actually a longshot to keep this title. Davis just signed a minor league deal with the Indians that includes a non-roster invitation to spring training. He will likely struggle to ever get regular playing time again. He’s 37 years old.

This will likely come down to a race between the two guys behind him. Dee Gordon has 278 stolen bases, had 60 last year, and only turns 30 in April. He has a 35 stolen base lead on 3rd place, which would seem more insurmountable if that person was not arguably a full tick or two faster. Billy Hamilton has 243 stolen bases since coming into the league in 2013, and has been remarkably consistent, stealing one more base each year than the year before. The fans think he’ll do that again this year, hitting 60 stolen bases. Hamilton is over two years younger than Gordon, and might be faster, but the 35 stolen base edge Gordon enjoys makes him the clear favorite.

Totally made up odds: Gordon, 66%; Hamilton 33%; Davis, 1%

Wins

This is likely a two-person race between Max Scherzer and Clayton Kershaw who have 132 and 131 wins respectively. Justin Verlander and Zack Greinke sit enough off the pace at 123 and 122 to make a comeback very improbable absent an injury, but close enough to make a comeback very possible if both players in front of them miss significant time.

Moving to who I give the edge to: there just isn’t a lot separating these two. Scherzer is older, but Kershaw has had a bit more in the way of nagging injuries lately. If it truly were a push going forward, I could just go with Scherzer since he is one ahead at the moment. But I’m going to give Kershaw the ever-so-slight edge because the Dodgers are almost assuredly going to be one of the best teams in baseball the next two years while the Nationals might only have that status for the next season. Verlander gets the nod as more likely spoiler for a similar reason: the Astros are ballers.

Totally made up odds: Kershaw, 45%; Scherzer 43%; Verlander, 7%; Greinke, 5%

Saves

Craig Kimbrel should put this away by midseason. At 291, he ranks 61 ahead of Kenley Jansen and Fernando Rodney, who are tied for second with 230. Aroldis Chapman sits in 5th with 204. Kimbrel’s consistency and consistently light usage should ensure that he continues to rack up saves the next two seasons. Even a repeat of his comparatively modest 66 saves over the last two seasons would give him a realistic lock on this honor.

If Kimbrel does fall apart, the 30-year-old Jansen would be the likely beneficiary, as he has a much stronger hold on his 9th inning role than the 40-year-old Rodney. While Kimbrel might have this decade locked down, he will likely fall short in his quest to surpass Rivera’s total from the last decade. Rivera saved 397 games that decade. It should be noted, however, that Kimbrel barely pitched in the majors in 2010 and recorded only one save. On the other hand, he’s already blown one more save than Mariano did all of last decade.

Totally made up odds: Kimbrel, 97%; Jansen, 2%; Rodney, 1%

Strikeouts

Stop me if you’ve heard this before, but this is a two-man battle between Max Sherzer and Clayton Kershaw. Only this time, there is a much clearer favorite. Scherzer leads Kershaw 1909 to 1835. He essentially built that entire lead last season when he recorded 66 more strikeouts than the limited Kershaw. But Kershaw’s innings shortfall was not the only thing at play here. Scherzer struck out 1.63 more batters per nine innings. For the decade, Scherzer has a 74 strikeout lead in only 14 1/3 more innings. The only realistic path for Kershaw to overtake Scherzer is injury. Of course, with pitchers, injury is always a legitimate and significant risk.

Behind Scherzer and Kershaw is Justin Verlander with 1670. No one past Verlander has any legitimate shot barring a mass retirement of the some of the game’s best starting pitchers. At the end of the day, this is really a question about health. But for Kershaw to overtake Scherzer, he’d not only need Scherzer to get hurt, but he’d have to stay healthy himself.

Totally made up odds: Scherzer, 79%; Kershaw, 19%; Verlander 2%

Runs

This has been a very positive article, but let’s get a bit negative for a second. Which pitcher will give up the most runs in this decade? A big factor in this, of course, is that giving up a lot of runs is bad, and playing bad usually leads to not playing. You have to be good enough to get the ball on a regular basis, but bad enough to rack up the runs allowed. Our frontrunners are honestly not terrible pitchers. Rick Porcello leads the way with 789 runs allowed. James Shields is just behind with 778 runs allowed. Porcello is 29, started a playoff game last year, and is owed a lot of money through the end of the decade. He also won the Cy Young Award in 2016 while accruing 5.1 WAR on the mound. He should have opportunities to add to this total. Porcello underperforms his peripherals, but only by a little. He is basically good enough to never get moved out of the rotation, and durable enough to throw over 1500 innings this decade, but has a suddenly-not-great-for-the-era ERA of 4.29 over the last eight seasons.

James Shields is slated to maybe start opening day 2018. Unlike Porcello, Shields has been dreadful the past two seasons. Yeah, the White Sox starting pitching this year might be awful. Shields is owed a lot of money in 2018, but 2019 is an option that will only be picked up if Shields has a dramatic turnaround. Thus, there is a bit of a catch-22 here. If Shields plays well enough to keep getting the ball regularly into 2019, it seems unlikely that he’ll chase down Porcello. Of course, this could also come down to injury. If either player gets hurt, the other will very likely take this notorious (dis)honor.

Ubaldo Jimenez sits in 3rd with 734 runs allowed. He will thankfully have a hard time adding to that total. If Porcello and Shields find themselves with quick hooks and no jobs, there are a few possible dark horses, including Ervin Santana and Jon Lester, who at the very least should get two full seasons of starts barring injury. For this one, I’m just going to put the field as a third choice rather than trying to single out who might suck, but play.

Totally made up odds: Porcello, 60%; Shields, 30%; Field, 10%

Other Interesting Battles

(My favorites in italics)

Games: Robinson Cano, 1264; Alcides Escobar, 1250 (that would be something)

Runs: Ian Kinsler, 785; Miguel Cabrera, 741; Andrew McCutchen, 740; Robinson Cano, 738

Strikeouts: Chris Davis, 1266; Mark Reynolds, 1250; Justin Upton, 1249

HBP: Shin-Soo Choo, 98; Anthony Rizzo, 98; Chase Utley, 92

Games: Tyler Clippard, 576; Luke Gregerson, 551

Innings Pitched: Justin Verlander, 1705; Max Sherzer, 1670.2; Clayton Kershaw, 1656.1

HBP: Charlie Morton, 82; Justin Masterson, 77 (23 in AAA in 2017)

Balks: Clayton Kershaw, 17; Franklin Morales, 15; Johnny Cueto, 13

Bonus Trout Stuff

You will notice that, apart from WAR, Mike Trout was not mentioned at all in this article. Of course, Trout played zero MLB games in 2010 and only 40 in 2011. But he is also an all-around performer. He doesn’t even show up in the top 10 for most counting categories. So for the lazy, here is where Trout ranks in the decade (if among top 30, must be qualified for rate stats):

Triples: T-8th (40)

Home Runs: T-16th (201)

Runs: 8th (692)

RBI: 30th (569)

Walks: 7th (571)

Intentional Walks: T-14th (61)

HBP: T-27th (55)

Sac Flies: T-16th (40)

Stolen Bases: 17th (165)

Batting Average: 6th (.306)

OBP: 2nd (.410) (not close to first, Joey Votto, .438)

Slugging%: 1st (.566) (biggest threat is probably Giancarlo Stanton, at .554)

Trout is about to play his age 26 and 27 seasons to round out the decade. He’ll be an “old 27” with his August birthday. We don’t know how he’ll age. But it is possible that he plays his whole career, a career of an inner-inner-circle Hall of Famer, and never leads a decade in any traditional counting stat. This on top of his frustratingly low MVP totals. If nothing else does, perhaps that should tell you how stupid this whole exercise is, and how stupid rigid benchmarks for greatness are in general. If Trout were born three years earlier, he could have dominated the counting stat leaderboards of this decade. If he played for a better team, he could have 2-3 more MVP awards.

So what does it all mean? Probably not much. If Albert Pujols squeaks out the most BRI of the decade, will that make it less of a disappointment? Does Nelson Cruz having the most home runs over an arbitrary 10-year period mean that he’ll one day be enshrined in Cooperstown? Well, no. However, I hope you had fun. I know that I did.


Let’s Find the Giants 88 Wins

We find ourselves in the midst of an exceptionally intriguing offseason. Rarely is there an opportunity to acquire a prior year’s MVP and remain in position to nab the number-two asset on the market: Shohei Ohtani. Given Ohtani’s decision to forego a contract that syncs up with his open-market value when he turns 25, he’ll hold a Black Friday-esque price-tag when posted. Virtually any team in baseball can make a play to acquire the former star from the Hokkaido Nippon-Ham Fighters, regardless of wallet size. That makes this particular campaign for a generational talent so intriguing.

Whether your team meets Ohtani’s duo of wants — independent of a passing grade on his questionnaire — is another story.

The San Francisco Giants are in a precarious position heading into 2018. Coming off a 64-win season, the lowest win total for their franchise since 1994, and the lowest of Bruce Bochy’s tenure by seven games, a rebound seems imminent. The current state of their roster, however, casts doubt on how relevant a rebound can make their team.

So, I sent out a tweet entertaining the possibility that one team lands the two biggest names of the offseason.

A little bit of mental math brought my over/under to 87.5 wins. Imprecise? Sure, but only three times since 2014 has one team improved on their prior year win total by more than 24 games: the Minnesota Twins (2016 to 2017, +26 wins), Arizona Diamondbacks (2016 to 2017, +24 wins), and Chicago Cubs (2014 to 2015, +25 wins). Whether a signal or mere noise, each of those improvements came without lavish acquisitions during winter (I used my subjective definition of “lavish”). Each was propelled to relevance by internal talent (Buxton/Sano, Ray/Godley, Arrieta/Bryant, etc.), superb management, and other favorable nods from the Baseball Gods. Each of the 29 responses to my poll came with three elements of consideration: Ohtani, Stanton, and everything else.

Ohtani

The pitching side of Ohtani’s value is interesting. ZiPS and Dan Szymborski were the first to throw their hat in the ring, giving Ohtani a 3.55 ERA over 139 innings of work, with 161 strikeouts, and a walk rate of 3.9 BB/9. It’s lukewarm, considering the hype around Ohtani and knowledge of his sub-1.1 WHIP over in the NPB. Do I agree with it? Not from a control standpoint, but we can work with it and my disagreement isn’t dismissal of a labor-intensive statistical model’s projection.

Taking the three essential components of FIP (walks, strikeouts, and homers), and our knowledge that pitcher fWAR is derived from FIP, we can backtrack from Ohtani’s ZiPS projection and in an anti-statistician kind of way. By comparing Ohtani’s per-nine peripherals to last year’s performers, we can infer his fWAR might be around 3.0 as a pitcher in 2018 (139 IP, 10.4 K/9, 3.9 BB/9, 1.0 HR/9). This ZiPS and fWAR magic says he’ll be slightly worse than 2017 Brad Peacock (that was a weird sentence to write).

Ohtani’s potential 3.0 fWAR is backed up when you look at his 2016 in the NPB. The righty posted 137 1/3 innings of work, with a 9.2 K/9, 2.9 BB/9, and a HR/9 just north of 1.0. This gives Ohtani something slightly better than Jose Berrios’ 2.8 fWAR 2017 campaign (an equally weird sentence to write).

Value for Ohtani with his bat on the Giants, a team obviously absent of a DH, is where confusion starts.

I want to keep this as simple as possible. It’s unlikely that he goes to the NL if contributing significantly on the mound and in the box are his main goals. The inherent risk for the lottery-winning club would be too high and uncertainty around whether Ohtani would prefer such a role plays an equally large factor. Travis Sawchik breaks Ohtani’s NL hitting value down better than I ever could, so I’ll only give you the product of his analysis.

Ohtani could have about 1.6 fWAR as a hitter. This is composed of 1.1 fWAR in his standard pitcher plate appearances, plus another .5 fWAR from regular pinch-hitting chances (emphasis on the word “regular”).

In total, we have a 4.6 fWAR player in Shohei Ohtani in the National League. Our 3.0 fWAR on the mound and an aggressive — but feasible — 1.6 fWAR in the box.

To find 88 wins for the Giants that my poll responders believe in, we need to start somewhere. It’s too easy to begin at a projection already circulating for the Giants’ 2018 win total, so I’ll make this hard for myself to execute, and likely, for you to rationalize. Let’s start with those 64 hard-fought wins Bochy’s squad scratched and clawed their way to. We’ll work backwards from there.

64 wins, plus roughly five we’re going attribute to Ohtani brings us to 69.

Stanton

Now onto Stanton.

Eno Sarris, a familiar name to many, looked through the surplus value on a trade that would send Stanton to the Bay Area. The names included in that analysis revolve around the following:

To SF: Stanton, Dee Gordon

To MIA: Joe Panik, Tyler Beede, Chris Shaw

We don’t have confirmation this would be the package, but I remain adamant Miami wants contract relief more than anything. Centering an offer around the eight FanGraphs wins above replacement (fWAR) Panik has accumulated in his career feels like a proper balancing of sides, given how much money the Giants would take on in a scenario like this. Whether Stanton opts out or stays through the length of his contract muddies just how much money the Giants, or any team, will tie up through 2027. Although it seems like a risk teams are willing to take, how that opt-out risk factors into offerings is another confounding input.

However, Stanton’s value to teams from a performance standpoint is less cloudy than his monetary value. He’s good. Very good. Completing two 6-fWAR seasons before turning 28 is desirable trait for any player. One of the first projections kicking around — FanGraphs’ Steamer — holds Stanton somewhat steady with his torrid 2017.  5.3 fWAR, buoyed by another 45+ homer season, and a wRC+ that holds up to his career standard. I have little objection to this, even if worry consumes you that a healthy season for Stanton was an anomaly.

Ohtani brought us to 69 wins and now Stanton will take us north of the only number above 15 anybody is ever excited to see. We’re at 74 for the Giants by taking WAR and interpreting them as literal wins, something I probably shouldn’t do given the debate the industry just had, but I’ll test my luck.

Everything else

This subheading encompasses a lot of assumptions. In my tweet asking my loyal followers to quickly gauge whether the Giants could get above the 87.5 wins, this considered everything from a (hopefully) full season of good Madison Bumgarner and paying a priest to rid the bad juju from the Giants’ clubhouse, to a minor investment in separate baseballs juiced specifically for AT&T Park.

We could venture another 1,000 words on the improvements of San Fran, but there are far more qualified Giants fans on this website and others (shoutout to Grant Brisbee at McCovey Chronicles) that have surely detailed this difference with more care and a deeper knowledge of the Giants’ issues and internal fixes.

Cutting to the chase, let’s make a simple push to the 88-win mark. FanGraphs’ depth-chart projections currently has the Giants as a 78-win team. That’s 14 wins better than 2017. It is also exactly what we need to go from 74 wins to 88.

Sometimes, things work out better than anybody could have ever planned.

We found our 88 wins.

The only thing I’m left wondering is whether my tweet and over/under projection at 87.5 inspired hopes of 90-plus-win seasons in voters’ minds. If Bochy & Co. can accomplish that feat without even one of Ohtani or Stanton, I commit to paying the shipping fee for Bochy’s Manager of the Year Award.

A version of this post can be found on my site, BigThreeSports.com, by following this link. 


The Homer Numbers of a Hypothetically-Healthy Giancarlo Stanton

Giancarlo Stanton has missed significant playing time since his MLB debut in 2010 and has never played more than 150 games of a 162-game season (145 and 123 games being his next two highest totals). In spite of his injury-shortened seasons, Stanton has still been among the league home-run leaders in 2011, 2012, and 2014 (his 150, 123, and 145-game seasons, respectively).

Giancarlo Stanton Since Debut (June 2010)
Season Games PA HR HR MLB Rank Injury Report
2010 100 396 22 T-55 ——
2011 150 601 34 9 Hamstring issues limited time
2012 123 501 37 7 15-day DL: Arthroscopic knee surgery
2013 116 504 24 T-31 15-day DL: Strained right hamstring
  2014* 145 638 37 2 Season-ending facial fracture
2015 74 318 27 T-25 15-day DL: Season-ending hamate (hand) fracture
2016 119 470 27 48 15-day DL: Strained left groin
*=finished 2nd in NL MVP race (Clayton Kershaw)

Career-wise, Stanton has amassed a total of 208 home runs, good enough for 16th-most of any player through their age-26 season and among the likes of Miguel Cabrera and Jose Canseco.

HR-leaders through Age-26 season
Rank Player HR
1 Alex Rodriguez 298
2 Jimmie Foxx 266
3 Eddie Matthews 253
4 Albert Pujols 250
5 Mickey Mantle 249
6 Mel Ott 242
7 Frank Robinson 241
8 Ken Griffey, Jr. 238
9 Orlando Cepeda 222
10 Andruw Jones 221
11 Hank Aaron 219
12 Juan Gonzalez 214
13 Johnny Bench 212
14 Miguel Cabrera 209
14 Jose Canseco 209
16 Giancarlo Stanton 208

Given Stanton’s injury-plagued career, his career home-run numbers are a lower bound on what he may have accomplished had he played full, injury-free seasons following his debut. To quantify how Stanton’s injuries have suppressed Stanton’s career power numbers thus far, I extrapolated the home-run totals of Stanton’s injury-shortened seasons into full-season hypothetical home-run totals (hHR) using the formula below:

hHR = FLOOR(HR/G * 162)

The formula simply assumes that Stanton maintains his HR/G rate through a whole 162-game season and then conservatively rounds down. We can now compare home-run totals between the real Giancarlo Stanton and our hypothetical Giancarlo Stanton. I excluded his 2010 debut from the extrapolation.

Real Giancarlo Stanton vs. Hypothetical Giancarlo Stanton
Season Games HR HR MLB Rank hGames hHR hHR MLB Rank
2010 100 22 T-55 100 22 T-55
2011 150 34 9 162 36 8
2012 123 37 7 162 48 1
2013 116 24 T-31 162 33 T-9
2014 145 37 2 162 41 1
2015 74 27 T-25 162 59 1
2016 119 27 48 162 36 T-16

The real Stanton never led the MLB in home runs, but our hypothetical Stanton climbs into the MLB lead in three of his hypothetical seasons (2012, 2014, and 2015).

Career-wise, our hypothetical Stanton would have hit 275 total home runs. This hypothetical Stanton adds 67 home runs to his real total, jumping from 16th to second place on the Age-26 leaderboard, only 23 home runs behind the far-away leader, Alex Rodriguez.

HR-leaders through Age-26 season
Rank Player HR
1 Alex Rodriguez 298
2 Giancarlo Stanton (hypothetical) 275
3 Jimmie Foxx 266
4 Eddie Matthews 253
5 Albert Pujols 250
6 Mickey Mantle 249
7 Mel Ott 242
8 Frank Robinson 241
9 Ken Griffey, Jr. 238
10 Orlando Cepeda 222
11 Andruw Jones 221
12 Hank Aaron 219
13 Juan Gonzalez 214
14 Johnny Bench 212
15 Miguel Cabrera 209
16 Jose Canseco 209
17 Giancarlo Stanton (real) 208

Of note, using the same formula to calculate Stanton’s career strikeout totals predicts a whopping 1271 strikeouts for our hypothetical Stanton. His 977 strikeout “real” total through age 26 (second-highest) balloons and surpasses Justin Upton’s age-26-leading 1026 for a clear command of first place.

In reality, Stanton is a three-time All-Star, a Silver Slugger (2014), and a Home Run Derby champion (2016), and he historically ranks among the best in home-run totals for his age, all while facing injury issues in all of his first six full big-league seasons. Our hypothetically-healthy Giancarlo Stanton greatly improves his career numbers and garners himself a few MLB home-run crowns, giving a glimpse into how much larger his career numbers could be today had his first six full seasons been injury-free. As Stanton’s career progresses, it will be interesting to see where his home-run totals end up, and, unfortunately, how much greater they could have been.

Credit to Baseball-Reference for all publicly available data.


Hit Batters as Collateral Damage of Rising Strikeout Rates

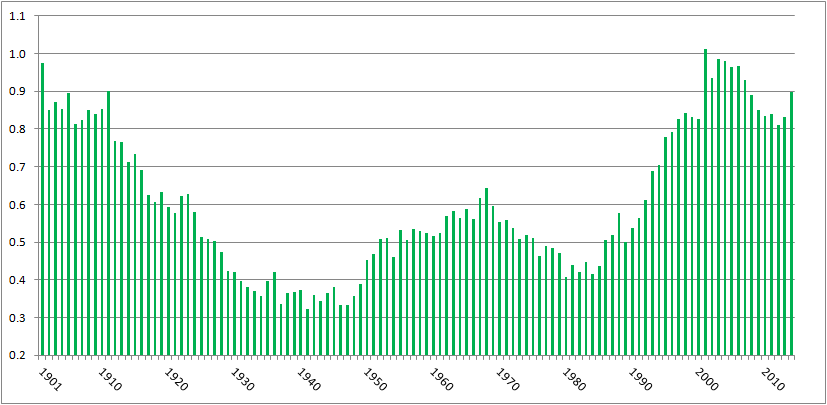
In the past, I’ve written about batters being hit by pitches–specifically, how the rate of hit batters is near all-time highs yet it hasn’t generated much, if any, outcry. Here’s a chart of hit batters per game, from 1901 (the start of the two-league era) to 2014:

HBP per game, 2001-2014

There were 0.68 hit batters per game in 2014, the eleventh-highest total over 115 years of two-league play. The top ten years, in order, have a 21st century slant: 2001, 2004, 2003, 2006, 1901, 2005, 2007, 2002, 2008, 1911.

Or, pretty much the same chart, here’s hit batters per 100 plate appearances:

HBP per 100 PA

There were 0.898 batters hit per 100 plate appearances in 2014, the tenth highest amount in the two-league era. The ten top years are, in order, 2001, 2003, 2004, 1901, 2006, 2005, 2002, 2007, 1911, and 2014.

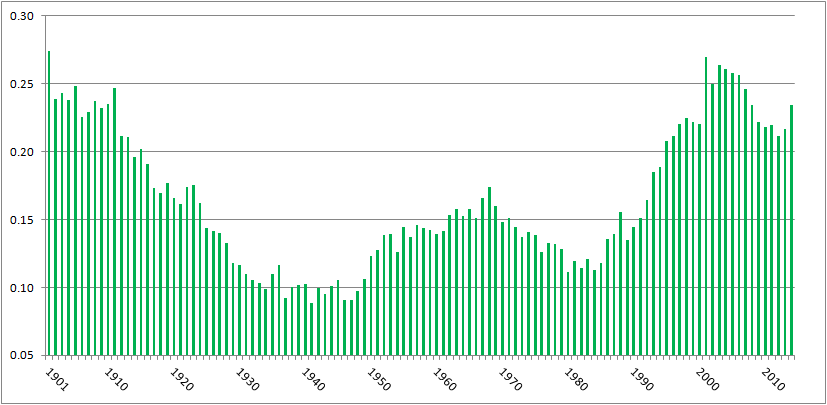
Commenter jaysfan suggested that the modern emphasis on going deep into counts has changed the number of pitches thrown per game, so perhaps hit batters per pitch haven’t changed much. It turns out the pattern still holds. Here’s a graph of hit by pitch per 100 pitches, using actual pitch counts from FanGraphs for 2002 to present, and Tom Tango’s formula of Pitches = 3.3 x plate appearances + 1.5 x strikeouts + 2.2 x walks for the preceding years:

HBP per 100 pitches

With 0.234 hit batters per 100 pitches, 2014 ranks 16th all time, behind 1901-1905, 1908, 1910, 1911, and every year from 2001 to 2007. Again, a pronounced millennial bias. (Source for all the above graphs: Baseball Reference and FanGraphs)

It’s clear, then, that we’re seeing batters getting hit at the highest rate in a century. I tried to figure out why, and came up dry. Left-handed batters, who face a wider strike zone than righties, aren’t leaning across the plate and thereby getting hit at a proportionately higher rate. HBPs are not inversely correlated to power, with pitchers more willing to pitch inside now to hitters who less frequently pull inside pitches down the line and over the fence. College graduates are slightly more likely to get hit by pitches than other hitters, but not enough to explain the change. Batters setting up deeper in the batter’s box, as measured by catcher’s interference calls, isn’t correlated to HBPs.

However, commenter Peter Jensen noted, “I don’t think there is any question that pitchers throw more to the edges of the strike zone when they are ahead in the count. This could be confirmed with a pretty simple Pitch Fx study. And if they pitch to the edge more they are also going to miss inside more (and outside more) so this could partially or even wholly account for why there are more HBPs in pitcher counts.”

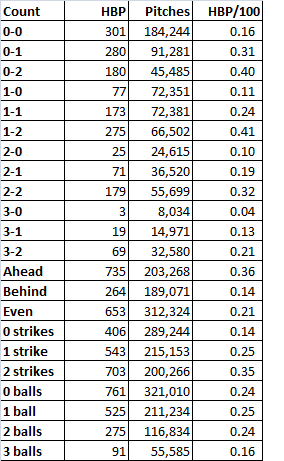
I did the PITCHf/x study Peter suggested. Using Baseball Savant data, I looked at hit by pitch by count, and as Peter found when he studied the data from 1997 and 2013, HBPs occur more when pitchers are ahead on the count. Here are the data from 2014:

2014 HBP

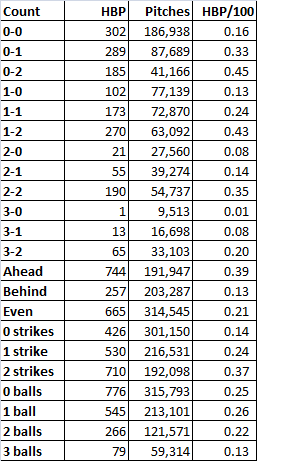
When the pitcher was ahead on the count, the batter was nearly three times as likely to get hit as when the batter was ahead. The most common counts for hit batters: 1-2, 0-2, and 2-2, and 0-1, all counts that encouraged pitchers to try to get batters to chase pitches on the border of the strike zone. Is this trend consistent? Baseball Savant’s data go back only to 2008, but using that season’s data, yes, the trend’s unchanged:

2008 HBP

Same thing. Batters are three times more likely to get hit when the pitcher’s ahead on the count, and the three most common HBP counts are two strikes with zero, one, or two balls, followed by 0-1.

So why the increase in hit batters? It appears that, as Peter implied, it’s because of the increase in strikeouts. Every three strike count requires a two strike count, obviously. In 2008, 22% of at bats went to 0-2 counts, 34% went to 1-2, and 29% went to 2-2. In 2014, those percentages had risen to 25%, 36%, and 30%, respectively, in line with the increase in strikeouts from 17.5% of plate appearances to 20.4%. The route to three strikes, which is being traveled more frequently, includes the four counts most likely to result in a hit batter. That’s why we’re seeing batters hit by pitches at rates not seen since before the first World War.

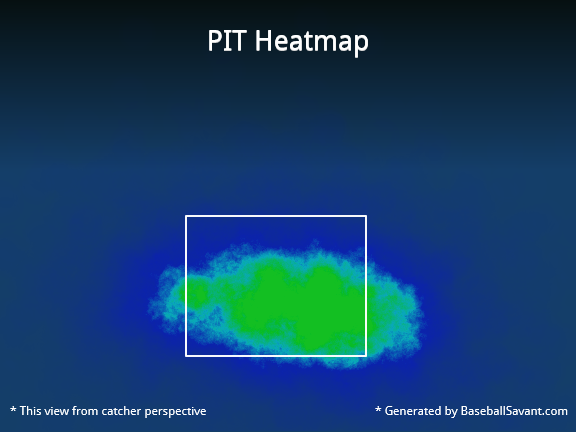
Here’s a graphical representation. In 2014, the Pirates led the majors in hit batters, handily, with 88. Here’s where Pirates pitchers threw on the hitters’ counts of 1-0. 2-0, 3-0, and 3-1:

Those greenish-yellow areas in the middle of the zone indicate that when the pitchers fell behind, they tended to locate their pitches in the strike zone. By contrast, check out the location for pitches thrown on 0-1, 0-2, 1-2, and 2-2 counts, when the pitcher could waste a pitch trying to get the batter to chase it:

That’s a much less concentrated blob, with a higher percentage of pitches outside the strike zone, where the batter can get hit.

As a final check, I ran a correlation between strikeouts per plate appearance and hit batters per plate appearance post-World War II. The correlation coefficient’s 0.82. That’s pretty high, suggesting a link between strikeouts and batters getting hit. Granted, correlation is not causation. But given that there’s an empirical link–to get to three strikes, you have to get to two, and batters with two strikes are at the highest risk of getting hit by a pitch–it’s enough to make me believe that while there are a lot of reasons more batters are getting hit by pitches, a major explanation is that hit batters are a consequence of rising strikeout rates.

CODA: If there were a day last season that I thought might’ve turned to tide on batters getting hit by pitch, it was Thursday, September 11. That day, there were 15 HBPs in 11 games. That doesn’t include the horrific fastball to the face that ended Giancarlo Stanton’s season; that pitch was a strike. A lot of stars got hit: Stanton, Mike Trout (twice), Yoenis Cespedes, Carlos Gomez, Jayson Werth. Tampa Bay’s Brad Boxberger hit Derek Jeter in the elbow. Had that pitch ended Jeter’s farewell tour, I really think it would’ve created an issue of rising HBP rates. Fortunately for Jeter and purveyors of Jeter memorabilia, it didn’t. But taking the 15 hit batters together, plus Stanton, and excluding two obvious retaliation jobs (Anthony DeSclafani hitting Gomez after Stanton got hit, Joe Smith hitting Tomas Telis after Trout got hit a second time), the fourteen hit batsmen occurred on six 0-1 counts (including Stanton and Jeter), three 1-2 counts, two 1-1 counts, and one count each of 0-0, 2-1, and 2-2. There was only one HBP with the batter ahead on the count, and ten occurred on the four counts identified here as the most dangerous for batters.


Better Outfield of the Future: Pirates or Marlins?

I know that I’m not alone in saying that one of my favorite parts about baseball is the projection of young players. In fact, I’d probably even say that I enjoy dreaming on what young players could be even more than I enjoy players for what they actually are. It’s one of the reasons I follow the Cubs and Twins (get well soon, Byron) farm systems as closely as I do the A’s and Dodgers big-league clubs. Obviously, it’s especially exciting when a group of young prospects on the same team all come up and meet expectations, as rare as that may be. To take it one step further, it’s just the best when all of that talent is concentrated in one positional group (pitchers, infielders, outfielders). So in an effort to combine my love of projection with what is currently happening on the field, I’m going to take a look at a couple of the most exciting young units in baseball.

Here are the top ten outfields as currently ranked by fWAR:

Screenshot 2014-08-14 at 9.08.00 PM

Of the top ten, only two teams are currently starting an outfield where all three players are 28 years old or younger. Now, it would be pretty funny if I said they were the Orioles and Blue Jays just to make you angry, but since you’re a person who ostensibly reads titles before you read articles, you know that these two teams are the Pittsburgh Pirates and Miami Marlins. Spoiler revealed.

Anyways, both young outfields are clearly extraordinarily talented. Each unit has an excellent case as the most promising outfield for the next five or ten years. That said, it’ll almost surely be a young outfield that exceeds them, because if baseball does nothing else, it destroys our expectations each and every season.

But focusing on the task at hand, the two outfields are very similar if you look at them in a certain arbitrary way. They each feature one superstar (Andrew McCutchen and Giancarlo Stanton), a strikeout-prone “tools” guy (Starling Marte and Marcell Ozuna) and a skinny corner guy with all-star potential (Gregory Polanco and Christian Yelich). Now, those descriptions don’t really matter, but they’re interesting nonetheless. What does matter, however, is performance on the field.

The Pirates outfield has probably been the more hyped unit so far, and I think the majority of people would choose them to be better going forward as well. Their core three is currently the more productive, and they blow away the Marlins in production over the next four years, using the Oliver projection system.

image (5)image (6)If the projections turn out to be correct, the Pirates outfield is going to be, on average, 4.8 wins per season more valuable than the Marlins. But I have a couple of issues with these projections.

First, wow do they hate Marcell Ozuna. This is somewhat understandable considering Ozuna never was that highly regarded as a prospect, and some people thought that the Marlins were making a mistake by promoting him to the big leagues so quickly last year. But as he’s shown since his call-up, Ozuna is actually pretty valuable. In only 70 games in 2013, he was worth 1.6 fWAR. In 2014, he’s been hitting for power and been worth nearly 2 wins with a month and a half left to go in the season. He’s not a perfect player (28.7 K%), but I think it’s fair to say that he’s not the borderline replacement-level guy that he is projected to be right now.

My second issue is that I just can’t get comfortable projecting Gregory Polanco as a 5 fWAR player just yet. He’s obviously a top prospect holding his own in the majors, but five-win players are really good. Only 19 position players were more valuable in 2013 than the 5.2 fWAR that Polanco is currently projected to reach by 2018. I certainly won’t be shocked if he reaches that level, but man, as fun as prospects are, sometimes they bust for no apparent reason. I’ll need to see a full productive season before I feel good about calling him a future MVP vote-getter.

Unfortunately for the Pirates’ case in this argument, the outfield fWAR top ten that I posted at the beginning of the article largely reflects the contributions of a player whom I have not mentioned thus far: Josh Harrison. At just 27 years old himself, Harrison has continued to be productive after what most assumed was just a hot couple of months. However, with Polanco now in the majors, it looks as though Harrison will be playing in the Pirates infield over the coming years, assuming all of the outfielders are able to retain their health. So it will likely be up to Polanco to replicate Harrison’s 2014 numbers (144 wRC+) going forward, a tall task even for someone as talented as he. Combine that with the possibility that Andrew McCutchen begins to decline upon hitting 30 in a couple years, and the Pirates outfield may not look quite as pretty as it does on paper at the moment (though it’ll still probably be really good).

Now, rather than continue to list reasons why you shouldn’t choose the Pirates, let’s talk about one final reason why you should choose the Marlins in our completely meaningless debate. Talent aside, the Marlins’ greatest advantage over the Pirates is their youth. Stanton is actually the oldest of Miami’s outfielders at the decrepit age of 24, while Ozuna and Yelich are 23 and 22, respectively. As a group, they certainly have the longest way to go to reach their ceiling, but they also have the most time to get there. And if you’re like me, you may be inclined to be on upside.

When choosing between these two outfields, there’s really no wrong option, as cliche as that may sound. They each have a combination of current production and future projection that we simply don’t see very often. Personally, despite all of the reasons I listed against them, I’m still inclined to go with Pittsburgh, but the choice is harder now than it was when I began this post. Either way, it doesn’t really matter. We’ll be able to sit back and enjoy both units, hopefully for the next decade or so.

This article was originally posted on gappower.wordpress.com, a site you’ve definitely never been to. I’ve checked. You can also find me on Twitter, at least occasionally. 


Giancarlo Stanton: Please Stay Healthy

Giancarlo Stanton. What a trip this guy is. One second he is hitting home runs and the next he is running to first and coming up lame with a pulled hamstring, or a knee injury, or even an eye injury. He is an enigma that we seemingly know little about. He is hard to project into the future because of the injuries, but the one concrete thing we know about him is that he possesses monstrous power.

Recently I have come to see Stanton as similar to Ken Griffey Jr., in that he hammers the ball and could put up single season home run figures similar to Griffey’s, who hit 56 home runs in consecutive seasons. In addition, Griffey averaged 32 doubles per season, while Stanton averages 36, Griffey had a career OPS of .907, while Stanton’s is .892, and they are only .001 point apart in slugging percentage. I could go on with more statistics, but you get the point, these guys are like statistical clones. Stanton does not have the benefit of playing in the Kingdome like Griffey did, so we should even take into account the fact that Stanton currently plays half of his games in the Petco Park of the East.

Unfortunately, they are also similar in the injury department. I’m not saying Stanton will miss as many games as Griffey, but Stanton has missed 95 games due to injury since the beginning of 2012. What is even more worrisome is that he is hurting in many different regions of the body. I alluded to the numerous injuries in the opening; he has missed time for arthroscopic knee surgery, shoulder issues, and hamstring issues. The ability of each of these separate injuries to flare up again is something that should concern all fans of Stanton, as well as fantasy owners. In fact, I owned Stanton last year in my own fantasy league and we had a running joke going that we couldn’t call him “Giancarlo” (we referred to him as “Mike”) until he hit five home runs. I thought this was a very trivial joke at first, but the other owners had the last laugh because Stanton did not reach five homers until June 15th, mainly due to injuries.

If Stanton can stay healthy, he may be this generation’s Griffey. He does not have the flair, mechanically perfect swing, or happy-go-lucky attitude that Griffey seemed to carry on and off the field, but Stanton is similar to him where it matters most — in the statistics category. As an avid baseball fan I would certainly not be opposed to watching Stanton bash 600, or even 700 homers over the next 15 years and I know every Marlins fan would thoroughly enjoy that kind of production, assuming he stays in Miami. He may not have quite the average that Griffey achieved (Stanton career: .267, Griffey career: .284) but he can certainly smash the ball at a consistent clip.

Strange as it is, I want Stanton to be like Jeremy Renner in Hurt Locker. I want him to step up to the plate and discern what puzzle the pitcher (or the insurgent) is putting in front of him and then solve the riddle and hit the ball 450 feet, like when Renner disarms a circle of six IEDs. Then, I want him to keep the bomb suit on and run around the bases so he doesn’t injure himself. In fact, he should keep the mask on so he doesn’t get an eye injury again.

I am basically asking for Stanton to break numerous batting records all while playing at half speed (or maybe in a bomb suit) so that he will stay healthy. I know that is unfeasible, but we basically have a prior tale of what will happen if he keeps getting injured. We can always just take a look back at Griffey’s career and see what Stanton’s production will be if he keeps landing on the disabled list at his current pace. But the interesting and exciting thing is that if we want to know what could’ve been if Griffey’s career hadn’t been riddled with injuries, we might get a realistic clue if Stanton can get healthy and remain that way for the years to come. Hopefully we will be able to sit back and enjoy the moments of Stanton’s career where he “disarms” pitchers and launches moon shots off the Marlins’ scoreboard.


Young Power / What Could Have Been if Miguel Sano Didn’t Need Tommy John Surgery

Twenty-two players have hit 150 home runs or more by the age of 25 (Per baseball reference, the last season included is when a player is no older than 25 on June 30th of that season).  The list below is a who’s who of players that hit for power at a young age. You’ll notice a large number of active players have accomplished this feat, and that 10 of the 17 retired players are in the Hall of Fame.

Rk Player HR From To Age
1 Alex Rodriguez

241

1994

2001

18-25
2 Eddie Mathews

222

1952

1957

20-25
3 Jimmie Foxx

222

1925

1933

17-25
4 Mel Ott

211

1926

1934

17-25
5 Mickey Mantle

207

1951

1957

19-25
6 Frank Robinson

202

1956

1961

20-25
7 Albert Pujols

201

2001

2005

21-25
8 Orlando Cepeda

191

1958

1963

20-25
9 Ken Griffey

189

1989

1995

19-25
10 Andruw Jones

185

1996

2002

19-25
11 Johnny Bench

179

1967

1973

19-25
12 Hank Aaron

179

1954

1959

20-25
13 Miguel Cabrera

175

2003

2008

20-25
14 Joe DiMaggio

168

1936

1940

21-25
15 Juan Gonzalez

167

1989

1995

19-25
16 Jose Canseco

165

1985

1990

20-25
17 Prince Fielder

160

2005

2009

21-25
18 Tony Conigliaro

160

1964

1970

19-25
19 Adam Dunn

158

2001

2005

21-25
20 Bob Horner

158

1978

1983

20-25
21 Hal Trosky

155

1933

1938

20-25
22 Willie Mays

152

1951

1956

20-25


A few more active players look like they are about to join the club

Three favorites are Giancarlo Stanton, Mike Trout and Bryce Harper. According to the Oliver five year projection system, each of these players will reach over 150 home runs by the end of his age 25 season.

Player CareerHR Born Age Oliver HR-25 Career +Oliver average projected HR Average needed to reach 150
Giancarlo Stanton

117

1989

20-23

73

190

36.5

16.5

Mike Trout

62

1991

19-21

108

170

27

22

Bryce Harper

42

1992

19-20

159

201

31.8

21.6

This chart shows each player’s current home run totals, the seasons played through so far, the number of additional home runs Oliver projects through the 25 season, the projected total runs by the age of 25 (Career HR + Oliver projected), and finally what each player would need to average to hit 150 runs by the age of 25. This last measure is interesting because it gives you an idea of what level each player would need to fall below to miss the mark.

Minor league players might knock out A-Rod for #1

Miguel Sano, Joey Gallo and Javier Baez make up a trio of minor leaguers who Oliver believes could also make the list.  Not only does Oliver project these three players will to fly past 150 home runs, he predicts Sano and Gallo could pass A-Rod for the most home runs by age 25.

Name BDAY Oliver hr25 Oliver K 25
Miguel Sano

5/11/1993

247

1030

Joey Gallo*

11/19/1993

228

1277

Javier Baez

12/1/1992

209

963

*the Gallo projections are only through his age 24 season so if he kept up the home run pace he would be in the 270s at the age of 25

While Sano, Gallo and Baez have a high number of projected home runs, they also have a high number of projected strikeouts. Adam Dunn shows that you can be very successful as a player who strikes out & hits home runs frequently. But the three minor league players could be even more extreme. Dunn struck out 26% of the time and homered 5.7% of the time through his age 25 season.  The minor league trio are predicted to strike out between 32 and 43% of the time and homer between 7 and 8% of the time. Could these three players redefine the all or nothing hitter, or are they somehow breaking projection systems?


Reasons to be skeptical

The Oliver model is complex and would take a long time to completely dissect, but from what I can tell it has the following limitations (these limitations are intentional because they add other value to the projections system):

#1 The Assumption of Games – Oliver projections assume a player gets 600 major-league plate appearances every year. This is not necessarily a given because top minor league players will likely spend part of a season in the minors before moving up to the majors, or in Sano’s case miss games rehabbing an injury.

#2 Inherent Uncertainty –  First, projections based off minor league numbers have more uncertainty than those based off major league numbers. Second, each additional year projected in the future adds more uncertainty because each year you go out you are guessing what happened the previous year – vs. knowing what happened the previous year. Compounded, these two stated effects create a good deal of inherent uncertainty.


So, what does this all mean?

If the projections are anywhere close to correct, it looks like we are going to see a new breed of power hitter in the major league soon. Although the projections are far from foregone conclusions, it’s another great reason why we watch the game of baseball.


Be a GM: Miami Marlins – Part 3 – Trade Deadline

From my personal blog msilbbaseball.wordpress.com

—–

The Miami Marlins are always in the news at the Trade Deadline, and the story is no different in 2013.

Bullpen

Steve Cishek Fist Pump

     The Marlins possess sought after relievers Steve Cishek, Mike Dunn, Ryan Webb, and Chad Qualls.  Cishek, Dunn, and Webb still have multiple years under team control, while Qualls’ is signed on a one-year deal.  Of the four, I would be most inclined to keep Cishek, who is currently closing games for the Marlins, and doing so extremely well.  Qualls is the most likely to be dealt, as the Marlins don’t want to part with valuable bullpen arms who could contribute to next year’s team.  Also, they don’t want to leave the young starting rotation with an inexperienced bullpen to back them up for the remainder of this season.  Qualls would be a rental reliever for any team, as a 34 year-old journeyman doesn’t scream “Long-term plans”.  Nevertheless, Qualls has caught fire in 2013, putting up the best season of his career.  Through 42 IP in 42 Appearances, Qualls has put up a 2.57 ERA, 1.024 WHIP with a 7.29 K/9 and a 1.93 BB/9 leading to a 3.44 FIP.

UPDATE (9:57 PM) – Chad Qualls fell while celebrating a strikeout tonight.  Stay hot kid.

Zack Cox at Arkansas

     The Marlins dealt relief to a contender at last year’s deadline as well, sending Edward Mujica to the Cardinals for 3B prospect Zack Cox.  Mujica had a 4.38 ERA at the time he was sent to St. Louis, so Qualls’ numbers are significantly superior.  However, Mujica was just 28 at the time, and still had a year of Arbitration remaining, which increased his value.  All things considered, Qualls should be able to produce the same return as Mujica did, possibly more.  What Mujica brought in was fairly significant.  Zack Cox was the Cardinals #4 prospect heading into 2012 by Baseball America.  He was drafted in the first round out of the University of Arkansas  in hopes that he would develop into a premier hitter.  He showed that ability during his first full minor league season in 2011, but fell off dramatically in 2012, hitting .254/ .294/ .421 in the hitter-friendly Pacific Coast League.  Cardinals management decided it was time to move on from Cox, and shipped him to the Marlins, who sent him back down to AA.  Cox has been solid in AA this season, hitting .292/ .393 / .391.  his power numbers decreased, but he’s hitting more consistently as the Marlins are allowing him to take a slow track through the system.  He has the Marlins’ future 3B job in his sights, but will be competing in the system with recent 1st round pick, Colin Moran out of UNC.

     In my opinion, the Marlins sold Mujica enormously high  The Cardinals’ frustration with Cox allowed him to be moved at a fairly cheap price, and it’s difficult to say that this trade is comparable to what the Marlins can get for Qualls.  Nevertheless, this shows that the Marlins can target mid-level prospects (or seemingly declining former top level prospects) in exchange for Qualls.

Decision: Avoid trading Qualls for the sake of trading him.  Aggressively shop him around, but if the return isn’t right (comparable to Mujica’s return), try to negotiate a 2014 contract in the off-season.  Cishek, Dunn, and Webb are main contributors to the Marlins bullpen, and with the team appearing to be a contender in 2014, I would want to keep that consistency.

OF Justin Ruggiano

Veteran Position Players

     The Marlins could potentially move Placido Polanco, Juan Pierre, Greg Dobbs, and Justin Ruggiano.  Polanco and Pierre are signed to one-year deals, and will be Free Agents after the season.  Dobbs is in the last year of a two-year contract.  All four are most likely fits on the bench for a contender, and none of them would be able to bring in a significant return.  Ruggiano had a breakout year in 2012, his first full season, hitting .313/ .374/ .535 in 91 games.  However, he’s slumped this year, removed from his everyday role, floating around a .200 batting average.  He holds the most value, as he still has another season before he’s arbitration eligible, and teams may hope that he returns to his 2012 form.  However, his remaining pre-Arb year is valuable to the Marlins as well, who didn’t want to move him a few weeks ago.  The Marlins called up their top two outfield prospects last week, which makes Ruggiano slightly more available.

Decision: Without much to gain in return, I’d hold on to the veterans, and try to retain Polanco, Pierre, and Dobbs for another year to serve as valuable bench players for the 2014 season.

Giancarlo Stanton

     The feature of this article, and many national news stories is Right Fielder Giancarlo Stanton.  I’ve admittedly flip-flopped back and forth about what the Marlins should do with the face of the franchise.  He’s 23 years old, and will be arbitration-eligible for the first time after this season, which will increase his salary by a couple million dollars.  He led the league in slugging in 2012, and had already amassed over 100 career Home Runs.  He is a budding superstar, and teams are willing to pay a very high price for him.

Keep Him

Giancarlo Stanton

     The Marlins are historically known to being a penny-pinching team, but are in a position to spend big money, which they have available to give to Stanton.  If the Marlins stick with Stanton, I see them avoiding arbitration this year with a one year deal in the neighborhood of $7-8MM.  I then project him to earn $10-12MM after 2014, and $13-15MM after 2015.  To avoid paying Stanton $13-15MM for 2016, and then have a future long-term deal based on that salary structure, I would begin working on a back-loaded multi-year deal immediately after the season.  My first offer of a  proposed contract would follow a similar structure to my predicted arbitration salary hike, but then level off around $17-18MM for 2016 and beyond.  Miguel Cabrera, former Marlins emerging offensive superstar, signed a long-term deal with the Tigers in 2008, which levels off at about $20MM per year.  In my opinion, Stanton has shown the potential to deserve a similar contract, but there is no way that I would begin the negotiations at Miguel Cabrera’s deal.

Trade Him

Dontrelle’s Delivery

     Stanton’s value is as high as it’s ever been.  As mentioned before, he’s an emerging superstar who is just reaching arbitration for the first time.  Comparing him again to Cabrera, the Marlins traded him after the 2007 season to the Detroit Tigers along with pitcher Dontrelle Willis for the Tigers #1, 2, 6, 8 rated prospects according to Baseball America, along with other mid-low level players.  The Marlins would be able to reel in at least three of a team’s top ten prospects, ideally two of the top five.  In my opinion they should throw in one of the relievers teams have been calling for (preferably Qualls) to bump up the level of the prospects they would receive.

     The most important thing to consider in this situation, is that the Marlins already have multiple potential replacements for Stanton.  According to Baseball America, three of the Marlins’ top five prospects are outfielders, all of whom have been in the majors this season (Christian Yelich #2, Jake Marisnick #4, Marcell Ozuna #5).  Beyond those three, they also feature Jesus Solorzano, Austin Dean, Brent Keys, and Isaac Galloway in a rich system of minor-league outfielders.  Stanton is simply not at a premium position of need for the Marlins, which in my opinion makes him expendable.  Also, the millions of dollars that would be used to lock up Stanton could be better used to lock up the Marlins phenomenal young pitching staff.

Don’t Trade Him

     The rebutting argument against trading Stanton is how unpredictable trading for prospects can be.  Once again, the Marlins traded Miguel Cabrera and Dontrelle Willis to the Tigers for four of their top ten prospects, including #1 and #2.  A total of zero of them are still with the Marlins, and Cameron Maybin (#1) and Andrew Miller (#2) never lived up to their potential.  All those two names do is make Marlins fans cringe.  Bad trades happen, Major Leaguers are known commodities, while prospects are prospects, something that might be good in the future.  The unpredictability and risk of trading Giancarlo is something that cannot be over-analyzed.

Decision: Make Stanton Available, and listen to offers, but don’t undersell him

Yelich at the 2013 Futures Game

     If a team wants to give you their entire future, then by all means go for the trade.  But if I’m Michael Hill, and I’m not receiving everything that I want from a team, then there’s no deal.  If I’m trading Giancarlo Stanton to your team, I want to be able to go through your organization, and hand-pick the players I want like I’m at a buffet.  If any compromise has to be made, then it’s no deal.  Stanton won’t break the bank in the off-season, and it’s worth keeping him around to see if the Marlins can be truly competitive in 2014, which I believe is very possible, barring unforeseen injuries.

Needs

Jose Fernandez

     The most difficult part about making trades for prospect is to decide where you need help.  The Marlins are set in the outfield, no question about that.  3B seems locked down with Cox and Moran, and I’m a big fan of future Gold Glove winner Adeiny Hechavarria at SS.  Derek Dietrich hasn’t been amazing at 2B, though I really like Ed Lucas.  If only he wasn’t 31.  Donovan Solano could still be a fit, but this is a position that could use improvement.  At 1B, there isn’t much behind Logan Morrison, who is finally fully healthy.  Rob Brantly has been a disappointment behind the plate after impressing at the end of 2012 after he came over from the Tigers for Omar Infante and Anibal Sanchez.  Brantly is still just 24, but is hitting .232/ .283/ .294 while splitting time with Jeff Mathis.  Former first round pick Kyle Skipworth hasn’t been able to hit at any level, and relying on J.T. Realmuto to be the future isn’t a safe bet.  The Marlins pitching is phenomenal, led by Jose Fernandez, and followed by Nate Eovaldi, Jacob Turner and Henderson Alvarez.  The Marlins also have Andrew Heaney and Justin Nicolino in the minors among others with a young pitching staff whose future is just as bright, if not brighter than the Marlins’ outfield crop.

Trade Possibilities

Chad Qualls

2B Kolten Wong

     If we assume that Chad Qualls can bring in a similar return to Edward Mujica, then we’re talking a downward-trending lower high-level prospect (if such a thing exists) or a mid-level prospect.  I love what the marlins did in the Mujica trade, by taking a risk on a possible high-level guy, who is having a bad season.  If the Marlins deal with the Cardinals again, Kolten Wong’s name has been thrown around, as he’s blocked at the Major League level by Matt Carpenter.  However, the Marlins aren’t likely to be able to put together the package for him without having to part with an integral piece.  His name has been linked to a potential Alexei Ramirez trade, who holds more value than Qualls.  The Marlins would have to throw in another reliever or two (Dunn, Cishek, or Webb), or maybe even Derek Dietrich who replace Wong’s spot in the Cardinals system, obviously to a lesser extent.  As an outsider, it’s unclear what the asking price is for Wong, but maybe the Cardinals could sell low again.  Wong is more highly regarded than Cox was at this time last year, but then again Qualls has been better than Mujica was, and the Marlins have arms to give.

Giancarlo Stanton

SS/IF Xander Bogaerts

     I’m trying very hard not to be one of those internet users who has no sense of trade balance, but it would take a completely unreasonable package for me to trade Stanton right now.  The Red Sox reportedly are willing to give up everything to get Giancarlo.  Any deal with them would need to include Xander Bogaerts, and Henry Owens, plus much more.  Bogaerts plays the same position as Hechavarria, but could move over to 2B to create a stellar middle infield that already has me excited.  Bogaerts, the Red Sox #1 prospect by BA, is a 20 year old from Aruba, who has absolutely torn it up in the minors.  Owens, their #5 prospect, recently turned 21, and has pitched very well at High-A Salem.  The Red Sox also have C Blake Swihart at #6 who is showing an upward batting trend.  Their #2 prospect, former South Carolina Gamecock standout, Jackie Bradley Jr. has already spent time in the majors, but being an Outfielder isn’t necessarily attractive to the Marlins. Again, I’d just pick out the Red Sox star prospects, and if I can’t have everyone I want, then sorry Beantown, Giancarlo will still be a Marlin.

     The Pirates and Rangers have also expressed interest in Stanton.  For me, the Pirates would have to part with Gerrit Cole and Jameson Taillon at least.  It would create a very crowded pitching rotation for the Marlins, but is that ever a bad thing?  Unfortunately for the Pirates, many of their top prospects are Outfielders which doesn’t help.  The Rangers have Jurickson Profar, who has been playing 2B.  However, they just traded for Matt Garza which took a hit out of their system, and don’t have many other guys close enough to being Major league ready for me to feel comfortable about.

If Stanton does get traded, I’m thinking that it’s going to be the Red Sox.