Archive for Fantasy Baseball

Reworking and Improving the Outcome Machine

This post was inspired by a couple of articles that I remembered reading from Jonah Pemstein back in 2014. The intention of those posts was to predict the result of any given batter/pitcher matchup, dubbed the “Outcome Machine.” Have you ever wondered what the probability Mike Trout strikes out when he steps into the box against Justin Verlander? Of course, there are variables that are specific to any plate appearance (umpires/situation/stadium/etc.) that are harder to quantify, but it set out to predict the outcome in a vacuum. Trout vs. Verlander and nothing else (For the record, in 2020, I would estimate the answer is about 27.5%).

Being able to predict the outcomes in sports would take most of the fun out of being a spectator, sure, but I still found myself coming back to those articles. While reading and re-reading in an attempt to understand the logic and fool around with the equations, I came to a few questions of my own:

  • With all of the hubbub of juiced balls and increased launch angles, do equations that were based on data from 2003-13 still apply to the game today?
  • The regression equations were composed of the at-bat result and the stats of the batter and pitcher from the same year. This stuck out to me as an issue because it means the player’s performance later in the season, say in July, influences the prediction of an at-bat in May, and to a lesser extent, the result of that specific at-bat is already baked into that season’s performance. Shouldn’t you use data exclusively before a given at-bat to predict the outcome? Hindsight is 20/20, after all.

Eventually curiosity got the best of me and I decided to emulate the original exercise. Before I really start to nerd out on the inner workings, you can find this iteration of the Outcome Machine as a Google Sheet here. You can either select a pitcher/batter combination through the dropdown or hard key in the rates in a custom, hypothetical matchup below that. League average is set by default to projections for 2020 but can be updated as desired in the custom matchup. I would note that the preset statistics in this tool are total projections for 2020 but not broken out into L/R splits, as to my knowledge that data is currently behind a paywall. Read the rest of this entry »


Michael Conforto Had a Unique 2017

A few days ago, I decided to start my 2018 Fantasy Baseball List. My process this year is about categorizing all players into groups that defines each player’s positive and negative traits, all based on league average stats. In this process, while linking players with similar traits, I found something interesting about Michael Conforto’s 2017 season.

So, without further ado, here is the process and the math disclaimer:

First, I took all the players who had at least 900 PA between 2015-2017 (Averaging 300 PA per season), and while I evaluated a lot of the stats, the one who I’m talking about right now is Hard Contact %. Then, I found out the league average Hard Contact % of those three seasons altogether. After that, I took all the players who were league average and ran another average to know who were the ones on top. (I wanted to make this benchmarking process as easy as possible). I used the trait ”Ball Murderer” on those players.

After that, I evaluated a lot of other stats, but the focus right now is on FB%, LD%, GB% and wOBA. I took all players with at least 200 PA on both 2016 and 2017, and found out the players who made the biggest changes in each batted ball-type, using a similar process of average as before. For those players, I decided to use the trait ”Substantial Line Drive Increase”, ”Substantial Fly Ball Increase”, ”Substantial Ground Ball Increase” and ”Substantial wOBA Increase”. The same is true for decreasing values.

Then, I decided to see which players had a sustainable ”Substantial wOBA Increase”. What I wanted was to link every positive baseball process that I know that could derive into an increase of wOBA.

So, between all those links, it came the moment to answer a pretty easy question, which was: ‘‘Which players who hit the ball relatively hard on the last three seasons have made a batted ball type adjustment in order to increase their wOBA production”?

With this question, I thought I would get a narrow list of 5 – 10 players whose wOBA Increase would be backed up by this adjustment. To my surprise, I only found one name on it: Michael Conforto.

Conforto had a great season last year. He upgraded his BB%, upgraded his batting line to .279/.384/.555 and had a great .392 wOBA. Also, he became less pull happy and slightly upgraded his Hard Contact %. What most people could point out as a step back was that he lifted the ball less than last year.

While this might be true, Conforto showed an impressive upgrade on his LD%, which is a major factor behind his production upgrade. Going back to the name of this post, he was the only player who has hit the ball hard for the last three seasons (which I call ”Proven Hard Contact%), to upgrade substantially his LD% and wOBA. Another interesting aspect of this analysis is that no player who was tagged with the ”Ball Murderer” trait showed a substantial increase on his FB% and wOBA.

Conforto had a breakout season last year. He was characterized for lifting the ball in his career, and he lifted it less last year. But his great increase on LD% indicates that his results of 2017 were valid, and that he is a great and unique choice for your 2018 fantasy baseball team.


dScore: End of August SP Evaluations

I went over the starters version of dScore here, so I’m not going to re-visit that here. I’ll just jump right in with the list!

Top Performing SP by Arsenal, 2017
Rank Name Team dScore +/-
1 Corey Kluber Indians 69.41 +2
2 Max Scherzer Nationals 62.97 -1
3 Chris Sale Red Sox 56.82 -1
4 Clayton Kershaw Dodgers 55.26 +1
5 Noah Syndergaard Mets 47.39 +2
6 Stephen Strasburg Nationals 47.24 +5
7 Danny Salazar Indians 43.46 +16
8 Randall Delgado Diamondbacks 42.00 +1
9 Luis Castillo Reds 37.99 +5
10 Alex Wood Dodgers 40.72 -8
11 Zack Godley Diamondbacks 39.55 -1
12 Luis Severino Yankees 39.24 +1
13 Jacob deGrom Mets 36.69 -1
14 Dallas Keuchel Astros 37.37 -8
15 James Paxton Mariners 35.81 +1
16 Carlos Carrasco Indians 34.23 +4
17 Sonny Gray Yankees 30.59 UR
18 Brad Peacock Astros 29.98 +6
19 Lance McCullers Astros 32.18 -11
20 Buck Farmer Tigers 31.31 UR
21 Nate Karns Royals 30.21 -2
22 Zack Greinke Diamondbacks 29.45 -4
23 Charlie Morton Astros 28.55 UR
24 Kenta Maeda Dodgers 27.40 -7
25 Masahiro Tanaka Yankees 26.83 -3


Risers/Fallers

Danny Salazar (+16) – dScore never gave up on him, despite him being absolute trash early on this year. He came back and dominated, launching him up the ranks even farther in the process. Current status: injured. Again.

Sonny Gray (newly ranked) – If there were any doubts about the Gray the Yankees dealt for, he’s actually surpassed his dScore from his fantastic 2015 season. He’s legit (again).

Alex Wood (-8) – Looks like the shoulder issues took a bit of a toll on his stuff, but dScore certainly isn’t out on him.

Dallas Keuchel (-8) – Keuchel’s stuff isn’t the issue. He’s still a buy for me.

Lance McCullers (-11) – Poor Astros. Maybe not too poor though; their aces have gotten hammered but haven’t fallen far at all. McCullers is going to bounce back.


The Studs

Some light flip-flopping at the top, with Kluber taking over at #1 from Scherzer. The Klubot’s been SO unconscious. Everyone else is pretty much the usual suspects.


The Young Breakouts (re-visited)

Zack Godley (11) – He’s keeping on keeping on. He barely moved since last month’s update, and I’m all-in on him being a stud going forward.

Luis Castillo (9) – He’s certainly done nothing to minimize the hype. In fact, he’s added a purely disgusting sinker to his arsenal and it’s raising the value of everything he throws. Also, from a quick glance at the Pitchf/x leaderboards, two things stand out to me. He seems to have two pitches that line up pretty closely to two top-end pitches: his four-seamer has a near clone in Luis Severino’s, and his changeup is incredibly similar to Danny Salazar’s. That’s a nasty combo.

James Paxton (15) 


The Test Case

Buck Farmer (20) – Okay, so to be honest when he showed up on this list, I absolutely thought it was a total whiff. By ERA he’s been a waste, but he’s really living on truly elite in-zone contact management, swinging strikes, K/BB, and hard-hit minimization. His pitch profile is middling (not bad, but not great either), so I really don’t think he’s going to stay this high much longer. He’s certainly doing enough to earn this spot right now, and I’d expect him to not run a 6+ ERA for much longer.


The Loaded Teams

Yankees – Luis Severino (12), Sonny Gray (17), Masahiro Tanaka (25) / Some teams have guys higher up, but the Yankees are loaded up and down.

Astros – Dallas Keuchel (14), Lance McCullers (19), Brad Peacock (18), Charlie Morton (23) / Similar to the Yankees. Morton and Peacock are having simply phenomenal years.


The Dropouts

Rich Hill (39)

Trevor Cahill (35)

Marcus Stroman (28)

Poor Rich Hill. Lost his perfect game, then lost the game, then lost his spot in the top 25. Cahill’s regressed to #DumpsterFireTrevor since his trade to the Royals. Stroman really didn’t fall that far…and his slider is still a work of art.


The Just Missed

Jordan Montgomery (26) – Too bad the Yankees couldn’t send down Sabathia instead. This kid is good.

Aaron Nola (27) – #Ace

Carlos Martinez (29) – Martinez simply teases ace upside, but frankly I think you can pretty much lump him and Chris Archer (30) in the same group — high strikeouts, too many baserunners and sub-ace starts to move into the top tier.

Dinelson Lamet (32) – He’s absolutely got the stuff. He could stand to work on his batted-ball control though.

Jimmy Nelson (34) – dScore buys his changes. He finished at #148 last year. I’ll call him a #2/3 going forward.


Notes from Farther Down

Jose Berrios is all the way down to 47. His last month cost him 19 spots, but frankly it could be much worse: Sean Manaea lost 39 spots, down to 87. Manaea really looks lost out there. I don’t want to point at the shoulder injury he had earlier this year since his performance really didn’t drop off after that…but I’m wondering if he’s suffering from some fatigue that’s not helped by that. He’s pretty much stopped throwing his toxic backfoot slider to righties, and that’s cost him his strikeouts. Michael Wacha is another Gray-like Phoenix: he’s up to 52 on the list, once again outperforming his 2015 year. I’m cautiously buying him as a #3 with upside. And finally, buzz round: Mike Clevinger (33), Alex Meyer (36), Robbie Ray (38), Rafael Montero (41), and Jacob Faria (43) are already ranked quite highly, and outside of Montero and maybe Meyer I could see all of them bumping up even higher. Clevinger’s really only consistency away from being a legitimate stud.


My next update will be the end-of-season update, so I think I’m going to do a larger ranking than just the top 25; maybe all the way down to 100. Enjoy the last month-plus!


Maikel Franco Is Adjusting

Baseball Prospectus, in their 2015 scouting report of Maikel Franco, had this to say:

“Extremely aggressive approach; will guess, leading to misses or weak contact against soft stuff; gets out in front of ball often—creates hole with breaking stuff away; despite excellent hand-eye and bat speed, hit tool may end up playing down due to approach…”

We saw early this year, and even last year, that exact prediction come to life. Franco seemed to be flailing about vs the soft stuff, beating too many pitches into the ground, and even popping too many up. He never really stopped hitting the ball hard, but we saw too many of those hit in non-ideal ways. For most of the first part of this year the slider gave him absolute fits, and Alex Stumpf wrote about that here. He’s striking out at a career-low rate (13% on the year), but he still isn’t really walking that much although it’s bounced up a percentage point from last year (7.3% in 2017).

Here’s a rundown of his career batted-ball profiles:

ballprofile

I was watching the Phillies game vs. the Marlins on the 18th, and Franco went 3-4 with the go-ahead HR off Dustin McGowan. His HR came on a slider middle-away — literally the exact pitch that’s done nothing but given him fits all year. I also noticed that his batting stance seemed to be different. More upright, quieter. I pulled up a highlight video of an at-bat from early May. Here’s a screencap of his stance just before the pitcher starts his delivery:

francold

That AB ended in an RBI line drive to right. Here’s a screencap of the HR in question from Tuesday, at a similar point in the pitcher’s delivery:

franconew

Now if that’s not a mechanical change, I don’t know what is. He’s closed off his stance, eliminated a lot of the knee bend, and seems to have raised his hands juuuuuust a touch. It could be the difference in the camera angle though. Phillies hitting coach Matt Stairs mentioned they’d been trying to get Franco to cut down on his leg kick, so let’s look at that too:
Old leg kick:

oldlegkick

New:

newlegkick

Shortly after contact, old:

pocold

and the recent HR, similar point:

newpoc

The “leg kick” seems to be more of a toe tap, and hasn’t changed. What did change, though, is the quality of his follow-through. His head is on ball, he’s better transferred his weight to his front foot, and the results follow. The old AB was a line-drive single opposite field, which looks less of an intentional opposite-field hit and more of a product of bad mechanics. Being so open, he really could only go to right field with authority. If he tried to pull it he’d roll over the pitch. That also would cause him to struggle with the breaking pitch away, which he’d bounce to second. Closing off has allowed him to better get the bat head into a more ideal position to cover the whole plate with authority. He’s always had the bat control to make contact everywhere, but it looks now like he’s improved his chances of making quality contact all over the zone. Here’s the same look at his batted-ball profile since the start of July:

bballnew

Here’s some assorted metrics, same time period:

kbbnew

vs. his career metrics:

metricscareer

He’s cut his grounders by over 10%, raised his liners by 3%, and turned the rest into fly balls (8%). He’s likely always going to have a pop-up issue, but his pull/center/oppo profile is back to where he was at in 15/16, and he’s hitting the ball hard at a higher rate than ever. Also, his strikeout rate is 6%(!!!!!!)!!!!! He’s making more contact than ever, and that contact is better than ever.

We’ve seen Franco get us hyped before, but never before has there been this type of major mechanical change to point to. Miguel Sano did something similar preseason by raising his hands and quieting his pre-swing load, and it’s paid dividends. Since I started this article, Franco went 2-4 with a single, double, and sac fly; and three of those batted-ball events were hit at 100+mph (the single and double; he was robbed by the 3B on a sharp liner as well).

Going back to his 2015 scouting report: Franco’s still aggressive, if not slowly becoming less aggressive the more he’s in the majors. By changing up his stance, however, he’s closed up the two major holes in his report: getting out in front of the breakers away, and bad contact on soft stuff. Keep an eye on this. One of the more frustrating hyped prospects seems to have made the transformation we all hoped he would, right in front of our eyes.


dSCORE: Pitcher Evaluation by Stuff

Confession: fantasy baseball is life.

Second confession: the chance that I actually turn out to be a sabermetrician is <1%.

That being said, driven purely by competition and a need to have a leg up on the established vets in a 20-team, hyper-deep fantasy league, I had an idea to see if I could build a set of formulas that attempted to quantify a pitcher’s “true-talent level” by the performance of each pitch in his arsenal. Along with one of my buddies in the league who happens to be (much) better at numbers than yours truly, dSCORE was born.

dSCORE (“Dominance Score”) is designed as a luck-independent analysis (similar to FIP) — showing a pitcher might be overperforming/underperforming based on the quality of the pitches he throws. It analyzes each pitch at a pitcher’s disposal using outcome metrics (K-BB%, Hard/Soft%, contact metrics, swinging strikes, weighted pitch values), with each metric weighted by importance to success. For relievers, missing bats, limiting hard contact, and one to two premium pitches are better indicators of success; starting pitchers with a better overall arsenal plus contact and baserunner management tend to have more success. We designed dSCORE as a way to make early identification of possible high-leverage relievers or closers, as well as stripping out as much luck as possible to view a pitcher from as pure a talent point of view as possible.

We’ve finalized our evaluations of MLB relievers, so I’ll be going over those below. I’ll post our findings on starting pitchers as soon as we finish up that part — but you’ll be able to see the work in process in this Google Sheets link that also shows the finalized rankings for relievers.

Top Performing RP by Arsenal, 2016
Rank Name Team dSCORE
1 Aroldis Chapman Yankees 87
2 Andrew Miller Indians 86
3 Edwin Diaz Mariners 82
4 Carl Edwards Jr. Cubs 78
5 Dellin Betances Yankees 63
6 Ken Giles Astros 63
7 Zach Britton Orioles 61
8 Danny Duffy Royals 61
9 Kenley Jansen Dodgers 61
10 Seung Hwan Oh Cardinals 58
11 Luis Avilan Dodgers 57
12 Kelvin Herrera Royals 57
13 Pedro Strop Cubs 57
14 Grant Dayton Dodgers 52
15 Kyle Barraclough Marlins 50
16 Hector Neris Phillies 49
17 Christopher Devenski Astros 48
18 Boone Logan White Sox 46
19 Matt Bush Rangers 46
20 Luke Gregerson Astros 45
21 Roberto Osuna Blue Jays 44
22 Shawn Kelley Mariners 44
22 Alex Colome Rays 44
24 Bruce Rondon Tigers 43
25 Nate Jones White Sox 43

Any reliever list that’s headed up by Chapman and Miller should be on the right track. Danny Duffy shows up, even though he spent most of the summer in the starting rotation. I guess that shows just how good he was even in a starting role!

We had built the alpha version of this algorithm right as guys like Edwin Diaz and Carl Edwards Jr. were starting to get national helium as breakout talents. Even in our alpha version, they made the top 10, which was about as much of a proof-of-concept as could be asked for. Other possible impact guys identified include Grant Dayton (#14), Matt Bush (#19), Josh Smoker (#26), Dario Alvarez (#28), Michael Feliz (#29) and Pedro Baez (#30).

Since I led with the results, here’s how we got them. For relievers, we took these stats:

Set 1: K-BB%

Set 2: Hard%, Soft%

Set 3: Contact%, O-Contact%, Z-Contact%, SwStk%

Set 4: vPitch,

Set 5: wPitch Set 6: Pitch-X and Pitch-Z (where “Pitch” includes FA, FT, SL, CU, CH, FS for all of the above)

…and threw them in a weighting blender. I’ve already touched on the fact that relievers operate on a different set of ideal success indicators than starters, so for relievers we resolved on weights of 25% for Set 1, 10% for Set 2, 25% for Set 3, 10% for Set 4, 20% for set 5 and 10% for Set 6. Sum up the final weighted values, and you get each pitcher’s dSCORE. Before we weighted each arsenal, though, we compared each metric to the league mean, and gave it a numerical value based on how it stacked up to that mean. The higher the value, the better that pitch performed.

What the algorithm rolls out is an interesting, somewhat top-heavy curve that would be nice to paste in here if I could get media to upload, but I seem to be rather poor at life, so that didn’t happen — BUT it’s on the Sum tab in the link above. Adjusting the weightings obviously skews the results and therefore introduces a touch of bias, but it also has some interesting side effects when searching for players that are heavily affected by certain outcomes (e.g. someone that misses bats but the rest of the package is iffy). One last oddity/weakness we noticed was that pitchers with multiple plus-to-elite pitches got a boost in our rating system. The reason that could be an issue is guys like Kenley Jansen, who rely on a single dominant pitch, can get buried more than they deserve.


Searching For Overvalued Pitchers

A little while ago, I created a post here about finding undervalued pitchers by looking at improvements between the first and second halves of the season. I had created a linear regression model for the predictions using data from 2002 to 2015, but when trying to use the same model to find overvalued pitchers, it didn’t exactly work as expected (I use the word “work” loosely here — in all likelihood, my predictions will fail as badly as the new Fantastic Four movie). It did find pitchers who suffered massive setbacks, but the majority of those were primarily due to increased — and probably unsustainable — home-run rates.

For example, Matt Andriese had an extremely successful first half of 2016. He put up a 2.77 ERA in 65 innings, backed up by a 2.85 FIP. But those numbers were much like my ex-girlfriend: pretty on the surface, but uglier once you get to what’s underneath. He struck out a lower percentage of batters than the average pitcher during that time while giving up more hard contact. The biggest sign, though, was his deflated home-run rate. He allowed just 0.28 home runs per nine innings, with only 3.2 percent of his fly balls going over the fence. This righted itself in the second half, where his HR/9 increased to 2.15 and his HR/FB to 17.4 percent. On the other hand, he improved his strikeout and walk rates, actually leading to a drop in his xFIP from 4.04 to 3.92 from the first half of the season to the second.

So then what should we expect from Andriese in 2017? The model I created predicts a 5.56 ERA from Andriese, leaning toward his 6.03 ERA from the second half of last season. While it’s unlikely he will allow fewer than 0.3 home runs per nine innings next year, it’s equally as unlikely that he’ll allow over 2 — after all, no qualified pitcher did so over the course of the 2016 season. Andriese’s full-season FIP of 3.78 actually closely aligned with his xFIP of 3.98, so it’s fair to guess that his home-run rates will level out and his ERA in the coming year will be in that range. That would signify an improvement from his 2016 season, rather than his decline predicted from the model.

So, instead of using the model, I took a simpler approach. Here are the players with at least 50 IP in each half of the 2016 season whose xFIP increased the most from the first half to the second:

xFIP Splits
Name First Half xFIP Second Half xFIP Increase
Tanner Roark 3.64 4.83 1.19
Drew Smyly 4.07 5.10 1.03
Hector Santiago 5.05 5.94 .89
Aaron Sanchez 3.41 4.29 .88
James Shields 4.82 5.70 .88
David Price 3.12 3.98 .86

For the purposes of this article, I’ll ignore Santiago and Shields since it’s unlikely that either of them will be relevant in 2017. That leaves four other pitchers whose skills declined dramatically over the course of the season and who you might want to avoid in your drafts.

Tanner Roark

Believe it or not, Roark’s already 30 years old. He’s actually had pretty decent success in his four years in the majors, with a 3.01 career ERA in over 573 innings. On the flip side, over that same time he has a 3.73 FIP, 3.96 xFIP and 4.06 SIERA. That’s not to say he’s a bad pitcher — just perhaps not as good as his ERA would have you believe. The same can’t be said for his second half of 2016. Despite actually bringing his ERA down from 3.01 to 2.60, his already-inflated FIP and xFIP numbers got even worse. His strikeout rate declined by 2.5 percent while his walk rate rose by about the same amount, leading to just a dismal 1.87 K/BB in the second half. His HR/9 nearly doubled as well, but not due to a substantial increase in his HR/FB rate — rather, his fly-ball rate rose from 26 to 37.6 percent, more in line with his pre-2016 career average of 33.9 percent. Why, then, was he able to continue to be successful? A .230 BABIP and a 86 percent strand rate offer an answer. Don’t expect another sub-3 ERA season from Roark — instead, look more toward his Steamer projection of 4.15.

Drew Smyly

For many last year, Smyly was a popular target. He was a high-strikeout guy who was able to limit walks and generate infield flies, prompting Mike Petriello to write this ringing endorsement for him. In his 114 1/3 innings for Tampa Bay before 2016, Smyly had maintained a 2.52 ERA and was among the best at generating strikeouts. But it all went wrong last year. As Tristan Cockcroft points out, Smyly’s season was marked by a first half of bad luck and a second half of deteriorated skills but better luck. His first-half 5.47 ERA was likely undeserved, as he continued getting strikeouts and limiting walks, but was plagued by a .313 BABIP, 63.2 percent strand rate and a 15.0 HR/FB rate, which corresponded to a 4.45 FIP and 4.07 xFIP. His ERA dropped to 4.08 in the second half, but nearly all of his peripheral stats worsened. A move to Seattle won’t fix all his problems, as Safeco Field was actually more hitter-friendly than Tropicana Field in 2016. The sky is the limit for Smyly, but there’s reason to be cautious. It’s possible he bounces back, but this could be who he is now.

Aaron Sanchez

This guy is good, don’t get me wrong. It took a while for some people to catch on, but I was always on his bandwag…all right, so I was one of the guys who didn’t buy in right away. That’s why I don’t do this for a living. Anyway, seeing his name on this list surprised me. After some digging though, it turns out that in my ignorance, I may have been onto something. In 2015, in Sanchez’s trial run as a starter, he was all right. A 3.55 ERA hid a 5.21 FIP and 4.64 xFIP before he got injured and was subsequently moved to the bullpen. When he returned on July 25, he was a completely different pitcher. This time, while he may not actually have deserved his 2.39 ERA, a 3.10 FIP and 3.33 xFIP showed he had made some kind of improvement. Or had he? After all, he only threw 26 innings in the second half of last season. And while there was undoubtedly a huge improvement for him in strikeout and walk rates, something else caught my attention. Take a look at Sanchez’s batted-ball type percentages from 2015:

Pretty clearly, Sanchez improved his batted-ball profile after becoming a reliever. His 2015 second-half ground-ball percentage of 67.6 percent would be the greatest of all of the 1281 qualified pitcher-seasons since 2002, when the statistic started being tracked. His fly-ball percentage of 18.3 percent, while not as extreme, would still rank as the ninth-lowest since 2002. That begs the question: would he be able to sustain those rates when he moved back to the rotation? The answer, as it always is with historically extreme rates, was no:

Both of his rates came crashing back to historically-accurate norms pretty much right away, and they continued to trend in the wrong direction as the season progressed. This, consequently, caused Sanchez’s xFIP to skyrocket. His strikeout and walk rates got worse from the first half of the 2016 season to the second, but only slightly. What really moved his xFIP was his fly-ball rate, which soared (pun intended — maybe I should do this for a living) from 21 percent to 31.8 percent. It’s difficult to say where Sanchez will go from here — after all, this was his first full season as a starter. If he can keep his fly-ball rate at last year’s 25.1 percent — which ranked fourth-lowest among qualified starters — he could still be a pretty decent starting pitcher, even with regression to a league-average HR/FB rate. What’d be even more impressive, though, is if he could keep his batted-ball rates at his numbers from the first half of 2016, which were among the league’s best. Perhaps with a full season under his belt, Sanchez may now have the stamina and endurance to achieve this feat. If he does, look out. If he doesn’t, you’re looking at an average guy.

David Price

Now that I’ve written nearly an entire article’s worth about one guy, let’s talk about another player from the AL East. Price, for much of his career, has been among the elite at the position. Before last season, the only time he had had an ERA above 3.50 was his first season as a starter back in 2009. Every year of his career, he’s been an above-average strikeout guy, but he topped even his own lofty standards when he struck out 27.1 percent of the batters he faced in the first half of 2016. He was unable to sustain that rate, and in the second half of the season he managed to strike out just 20.3 percent of batters, which would have been his lowest full-season rate since 2009. So what changed? Actually, it might have been the first half that was the fluke. Price allowed a 74.2 percent contact rate in the first half, contrasted with a 79.1 percent rate in the second. Those numbers don’t necessarily mean much on their own, but the difference is easy to spot when looking at his career rates:

Price’s whiff rate was higher than ever in the first half of 2016, but it’s tough to figure out why. Per Brooks Baseball, Price was generating swings and misses on his changeup at a career-best rate in the first half, but I couldn’t find any obvious changes to his velocity or movement on the pitch or any other. It’s fair to wonder, then, if his second-half numbers are what we should expect from Price at this point in his career, since his contact rates during that time were much more sustainable. He probably won’t be as bad as his 2016 3.99 ERA, but I wouldn’t be shocked to see it end up above 3.50 for the second year in a row.

Of course, this is not a comprehensive way to find overvalued pitchers. It’s a crude approach, but one that’s meant to highlight guys who fell off in the second half, as they’re the ones more likely to carry over those declined skills into 2017. That being said, xFIP obviously isn’t perfect, and these players all showed that they were capable of posting above-average results over half a season. Take a risk on them if you want, but be warned that they may not be worth the price.


Searching For Undervalued Pitchers

When looking to the future, there are countless ways to try and find undervalued pitchers.

One such way is to look at which pitchers’ FIPs outperformed their ERAs last year. This is a good approach, but it isn’t enough. For one, there will be players who consistently underachieve on their metrics, like the ever-teasing Michael Pineda. He sits second on the 2016 leaderboard in ERA-FIP, but his ERA is more than half a point greater than his FIP for his career and over a point greater each of the past two seasons.

The other problem with this approach is that FIP has become mainstream enough that everyone will be doing this same thing. Players who outperformed their FIP will be be common targets on draft day, driving up their prices and eliminating any sleeper potential that they had. This, too, is the downside of projections and other easily accessible data.

A different approach is then needed. In that spirit, I decided to create a linear regression model to predict a subsequent year’s ERA based on the difference in first- and second-half splits from the previous year, as well as that year’s ERA. This would help find the players who improved the most from the beginning of the year to the end, and perhaps players who are likely to carry over those improvements into the next season.

The model was generated using data from 2002 to 2015 obtained from FanGraphs’ splits leaderboard, with only pitchers with at least 50 IP in each half-season being considered so as to remove potential outliers. Non-significant variables were removed, and a final model was created. The resulting model was then used with 2016 data to predict ERA in 2017. The following graph shows those predictions, after being rescaled, plotted against 2016 ERA:

For the most part, the predictions line up with their 2016 counterparts. The labeled data points, though, are the ones I want to focus on. Based on this model, each of them are expected to see their ERA drop significantly from last season to this one and could help provide value in the latter rounds of drafts.

Jeff Samardzija
2016 ERA: 3.81
2017 Projected ERA: 3.40

The Shark has had a rough career. Since becoming a starter in 2012, he’s only had one season in which he’s beaten last year’s mark of a 3.81 ERA. He’s played for four different teams in those five years, he’s on the wrong side of 30 and his name is at the same spot on the pronunciation scale as Jedd Gyorko’s. But he does have a few things going for him. He’s struck out over 20 percent of the batters he’s faced in all but one year since 2011, and he’s pitching in a park where home runs go to die. His average fastball velocity is holding steady above 94mph and it was only two years ago where he had a sub-3 ERA with the estimators to back it up. He’s proven he can put up solid numbers, so the predicted improvement isn’t unreasonable. He had a 3.66 FIP in the second half of 2016 that exactly matched his ERA, a substantial drop from his first half numbers. The biggest contributors were his strikeout rate, which rose from 18.9 to 21.9 percent, and his HR/9, which dropped from 1.15 to 0.94. There’s no reason to think the rates are unsustainable either — his HR/FB dropped to a near-league average (in a normal year) 10.8 percent, and his strikeout rate improved almost directly with an increase in his O-Swing%:

Samardzija was able to get batters to swing at pitches out of the zone more frequently as the season went on, and consequently was able to produce more strikeouts. Steamer projects him for a 3.66 ERA, which isn’t all that far off this model’s prediction. If he can bring his strikeout rate back to what it used to be, and AT&T Park does its job, Samardzija could provide some sneaky value in 2017.

Ivan Nova
2016 ERA: 4.17
2017 Projected ERA: 3.72

Moving to the NL seemingly agreed with the former Yankees second-round pick. After posting an unsightly 4.90 ERA in 21 games (only 15 starts) in pinstripes, he turned his season around in Pittsburgh with a 3.06 ERA and 2.62 FIP in his final 11. Switching leagues undoubtedly helped, but there are more reasons behind his improvement. For one thing, he increased his strikeout rate while decreasing his walk rate — just doing those two would be reason to expect a lower ERA. Perhaps more significant, though, is that he halved his HR/9. Much of this is due to a change in scenery — his HR/FB dropped from 21.3 percent before his trade to just 7.8 percent afterward. Of course, he can’t be expected to repeat his performance. He walked just three batters in 64 2/3 innings, good for a 1.1 percent walk rate and a 17.33 K/BB. While Nova is probably better than Phil Hughes, it’s unlikely that even he can replicate that kind of walk rate. Look for Nova to improve on his ERA from last year, but don’t expect him to be as good as his second half. He’ll fall somewhere in the middle, but even that will be more than useful.

Wily Peralta
2016 ERA: 4.86
2017 Projected ERA: 4.35

Don’t look now (unless you promise to come back), but Peralta had a 2.92 ERA in the second half of 2016. Part of this was admittedly due to an inflated 81.7 percent strand rate, but even accounting for that, he managed a 3.75 FIP and 3.59 xFIP during that stretch. His success can be due largely in part to his increase in strikeout percentage, which jumped from 13.6 percent to 20.8 percent. It’s difficult to determine the exact reason behind this, but one explanation might be his increase in velocity. At the start of the year, his fastball was only averaging under 95 mph, a continuation of his 2015 trend and a disgrace to fireballers everywhere. By August, he was closing in on 97 mph, and presumably striking out batters as a consequence. Here’s his velocity by month since 2014, via BrooksBaseball:

Not only did Peralta see an increase in his strikeout rate, but his walk rate improved as well from 8.7 percent to 6.5 percent, which is the lowest to reasonably expect given his career numbers. His WHIP dropped from 1.88 to 1.15, his HR/9 from 1.64 to 1.02 and his wOBA against from .421 to .295 — seemingly everything improved except his age, but I’ll give him a pass on that account. The secret behind his success? His ability to limit hard-hit balls and induce soft contact. Take a look at the trends for each type of contact rate:

In case that doesn’t do it for you, here’s his Statcast exit velocity broken down by game date, via Baseball Savant (with a linear regression line added for those last few skeptics who aren’t convinced):


Peralta’s not an ace, but he has the potential to help out teams this season. Monitor his velocity during spring training, and buy him for a discount on draft day.

Clay Buchholz
2016 ERA: 4.78
2017 Projected ERA: 4.02

Of all pitchers who threw at least 50 innings in each half of the season, Buchholz improved his FIP the most — his first-half FIP was 6.02, so he gave himself quite an advantage, but he still brought it down to 3.74 following the Midsummer Classic. He’s already proven himself to be a capable pitcher, with four sub-3.50 ERA seasons in his past seven seasons, and now he goes to Philadelphia, where pitchers go to be reborn (see: Hellickson, Jeremy). Also, he moves from the AL East to its NL counterpart. Besides going up against a pitcher instead of a designated hitter, he will be facing the likes of the Braves and Marlins instead of the Blue Jays and Yankees.

Despite the difficulty of his former division, Buchholz still managed to improve as the 2016 season wore on. He marginally increased his strikeout and walk rates, doubling his K-BB% to a still-mediocre 9.3 percent in the second half of the season. While that’s not exactly comforting, it’s worth noting that his walk rate in the first half the season was higher than anything he’s put up since 2008, so it’s not likely to approach that number anytime soon. Furthermore, he was able to bring down his bloated HR/FB rate, despite the league’s general struggle to do so. In the first half of the season, 15.9 percent of Buchholz’s fly balls resulted in home runs, which would have been higher than any single season in his career. In the second half that number improved to 5.1 percent, which was much more reasonable given his average rate of 6.5 percent over the previous three seasons. Steamer projects him for a 4.07 ERA, but it’s not difficult to envision a scenario where he does better than even that.

With all that being said, not all of the pitchers on this list are going to live up to their projections. No model is perfect, and none of these guys have exactly had exemplary careers. But they all showed significant improvement over the course of last year, and that’s a strong indication for what to expect from them in 2017.


Poking Holes In Some of the Best Players of 2016

We are reaching the end of the 2016 fantasy-baseball season, which means two things: 1) It’s time to look ahead to next season a bit, and 2) the sample sizes on many metrics are either stabilized or right around the corner from stabilizing.

With that in mind, let’s take a look at a few of players who are sure to be trendy draft picks in 2017, and see what their potential downfalls might be. This is not to say to avoid these players, but rather to spot a potential weakness so that if you do draft this player, and they start to struggle you can maybe know why, and see if it is a recurring issue, instead of just a bit of bad luck. Let’s meet our contestants:


Rougned Odor

In many ways Rougned Odor has had his coming-out party this season. He has hit 31 home runs through 135 games, adding in 12 steals, to go along with a .282 batting average, and strong production (85 runs and RBI each). He’s been the fifth-best second baseman by the ESPN player rater, and that’s with two players (Daniel Murphy and Jean Segura) with multiple positions above him in the ranks. He even got famous on the national scene with his punch heard round the hot-take tables in May.

However, when looking at his plate discipline, it has somehow got even worse than it was last year. His walk rate has dropped to 3.0 percent (17 walks all season!), while his strikeout rate has climbed above 20 percent (20.9, to be exact). His swing rate on pitches outside the zone is seventh in all of baseball, while his contact on those pitches outside the zone isn’t even in the top 80. That’s a dangerous duo. Talented players who hit the ball as hard as Odor can sustain success while flailing that much for a little while, but in the long haul, it almost always burns you. Odor could certainly make strides to improve his discipline, but coming off the season he is having, why is he going to try to change anything? He may well need a rough season, or at least rough couple of months, to admit he needs to fix the holes in his swing, and you don’t want to deal with that when he does.


Jon Lester

With a record of 16-4 and a 2.51 ERA, Lester is having arguably the best season of his career. He’s a candidate for the Cy Young, and currently trails only Noah Syndergaard and teammate, Kyle Hendricks, in the race for the lowest ERA in all of baseball. There are plenty of signs for regression, though.

For starters, Lester is 32, and while left-handed pitchers seem to age like a fine wine sometimes, that’s only because we forget about the guys who crash and burn and are out of the league by 34. Now Lester is showing no real signs of aging, but he also has signs of regression elsewhere.

His left-on-base rate is currently leading all qualified pitchers, at 85.5 percent. That’s more than 10 percent higher than his career rate, and by far the highest percent of his career. That’s especially amazing considering Lester can’t even throw to first base, meaning runners should be moving around the bases faster on him if anything. He is also one of the FIP-ERA leaders, thanks to a well below-average opponent BABIP (.257).

There’s also the fact that, while not by a huge margin, Lester’s strikeout rate has also dropped this season, while the rest of the league is striking out more batters than ever. If you’re already going to get some regression in terms of ERA and wins, you best not be losing strikeouts, as well.

I don’t think Lester is going to fall off a cliff, but I also don’t think he’ll be repeating his 2016 performance next year.


Michael Fulmer

We’ll start with the most obvious candidate for overdrafting. Fulmer will be a 23-year-old, (likely) coming off an American League Rookie of the Year Award, and pitching for a strong Tigers team. He may well win the AL ERA crown, and will easily have a winning record. Heck, he’s got an outside shot at a Cy Young in what has been a weak year for AL pitchers.

That being said, there are some definite weak spots in his profile, the most obvious being his FIP-ERA. If one were to simply go to the FIP-ERA leaderboard — a good spot to at least start to find potential regression candidates — Fulmer’s name is sitting there in fourth, trailing only Kyle Hendricks (borderline historic ERA), Brandon Finnegan (a guy who would have certainly made this list if he were famous enough), and Ian Kennedy (a professor at Hogwarts in the baseball offseason).

It’s more than just the FIP with Fulmer, though. His left-on-base rate is over 80 percent (81.3, to be exact), and his opponent BABIP is just .251. He allows over 30 percent hard-hit rate and his line-drive rate allowed is nearly 20 percent, which while not terrible, do not portend a Cy Young winner.

With Fulmer, it’s more an accumulation of slights rather than one big one, combined with the fact that he will be an extremely trendy pick. There’s no reason to believe he won’t finish the year 13-8 with a 3.35 ERA and 140 strikeouts, but you’ll have to pay for much better stats than that to land him.


Ryan Braun

Like all of the players on this list, Braun is having one of his best seasons in 2016, which is saying something for the six-time All-Star. Braun is hitting .310 with 27 home runs, both of which are his highest since 2012. He has also stolen 14 bases, and only been caught three times, impressive for a 32-year-old.

But it’s not Braun’s age that is troubling (although it is obviously worth remembering come draft day); it’s his ground-ball rate. Braun is seventh in all of baseball in ground-ball rate, surrounded by names like Jonathan Villar and Cesar Hernandez. He has hit ground balls on 55.6 percent of the balls he has put in play in 2016, and has only hit fly balls on 25.4 percent. Because of that, it’s hard to imagine his home-run totals staying as high as they are right now in 2017.

Braun is currently sporting a HR/FB rate of 28.4 percent, highest in the major leagues. Ask Jose Abreu owners what it is like to own the reigning HR/FB rate champion. Here’s how the last four HR/FB rate champions fared the next season:

2012 Adam Dunn – 41 HRs; 2013 Adam Dunn – 34 HRs

2013 Chris Davis – 53 HRs; 2014 Chris Davis – 26 HRs

2014 Jose Abreu – 36 HRs; 2015 Jose Abreu – 30 HRs

2015 Nelson Cruz 44 HRs; 2016 Nelson Cruz 35 HRs (with 18 games to go)

Only Chris Davis fell off the earth, but none of the four went up. If you’re buying on Braun’s power, you’re basically buying at its highest point, which is never a good idea. Especially with a 32-year-old.


Jose Fernandez

Yes, we are getting a little bit into “snake eating his own tail,” by turning advanced metrics against Jose Fernandez, after spending all of the first couple months using the advanced numbers to show a turnaround was imminent, but it was foolish to ignore Fernandez’s biggest weakness: his line-drive rate allowed.

Opponents are hitting line drives off Fernandez 29.3 percent of the time in 2016, by far the highest percent among qualified pitchers, and a rate that tops even Freddie Freeman, the 2016 league-leader in line-drive rate.

Part of that can be explained by the fact that Fernandez throws so hard, that of course the ball is going to come out faster — that’s just physics. It also isn’t as big a deal to allow such a high line-drive rate, when you also have, by far, the highest strikeout rate in the big leagues this season (34.9 percent). It doesn’t matter how hard you hit it, if you simply can’t hit it.

However, that line-drive rate certainly helps to explain the fact that opponents have a BABIP of .341 off Fernandez this year, a figure that would seem due for some regression in favor of Fernandez if we missed looking at the full picture. Some 2017 drafters may see Fernandez’s .341 BABIP and his 2.27 FIP and assume that his 2017 ERA will drop into the low 2.00s. If Fernandez keeps allowing line drives at the rate he has this season, there’s no reason to think his ERA will drop at all. Now drafting a player with an ERA of 3.00 and the best strikeout rate in baseball is still never a bad idea, but if batters start to elevate their swings against Fernandez, while maintaining that same hard contact, Jose could see his home-run rate jump up quite a bit, even when pitching in pitcher-friendly Marlins Park.

Fernandez allowed just as high a line-drive rate in his 11 starts in 2015, and while some of it may still be noise, it is something to keep an eye on. Especially if you have Fernandez in a long-term keeper league, and he eventually makes a move to somewhere like Fenway where the stadium might be a lot less forgiving than in Miami.


A New Hitter xISO, Now with Exit Velocity

Over the last few years, Alex Chamberlain has published a series of posts exploring the concept of xISO. Like the most commonly known xFIP, this metric is supposed to be an “expected” ISO, based on batted ball metrics. Nobly, Alex kept his model quite simple, using only statistics available on the FanGraphs player pages: Hard%, FB%, and Pull%.

I have very little formal training in statistics, most of it is self-taught to help me in my day job, so I’m also going to keep things simple. Inspired by Alex’s work, I began to experiment with improving the xISO model. I started building linear models including more predictors, and even introduced higher order and interaction terms. While these all improved the model slightly, I didn’t feel that the added complexity was worth the slight improvement. Along the way, I noticed that, although Chamberlain makes mention of the correlation between first half xISO and end of season ISO, if I calculated first half xISO and compared to second half ISO, I would find the initial xISO model to be a worse predictor of second half ISO than the actual first half ISO.

As I was running these calculations, I also became acquainted with the publicly available Statcast data through Daren Willman’s Baseball Savant site. Although the gathering of input data becomes a bit more tedious, surely some combination of exit velocity and launch angle information would improve an xISO model, and perhaps produce something which produces a better correlation between first and second halves. Let us see!

First things first, since Statcast is so new, we only have one full season of data. Ideally, we could use multiple years of data to build the model, but for now, we’ll stick with 2015 full season to train the model. As it turns out, the Statcast parameter that correlates best with ISO is the average exit velocity for line drives and fly balls (LDFBEV). This makes sense, right? It also makes sense that we can exclude ground ball exit velocity in an ISO predictor. Launch angle seems to have some relationship with ISO, but it’s relatively weak.

So, we’ll hang our predictive hats on LDFBEV and see what else can help. After constructing various models, we can pretty quickly see that Pull%, Center%, and Oppo% don’t add much additional explained variance between model and data, nor do Soft%, Med%, and Hard%. This isn’t surprising, since we already have an objective hard contact measure. Ultimately, the one traditional batted ball statistic that helps is GB%. In fact, in the final regression, adding GB% nets us about 18% more explained variance between model and data. This also makes sense. It’s pretty hard to hit a ground ball double or triple, and really hard to hit a home run.

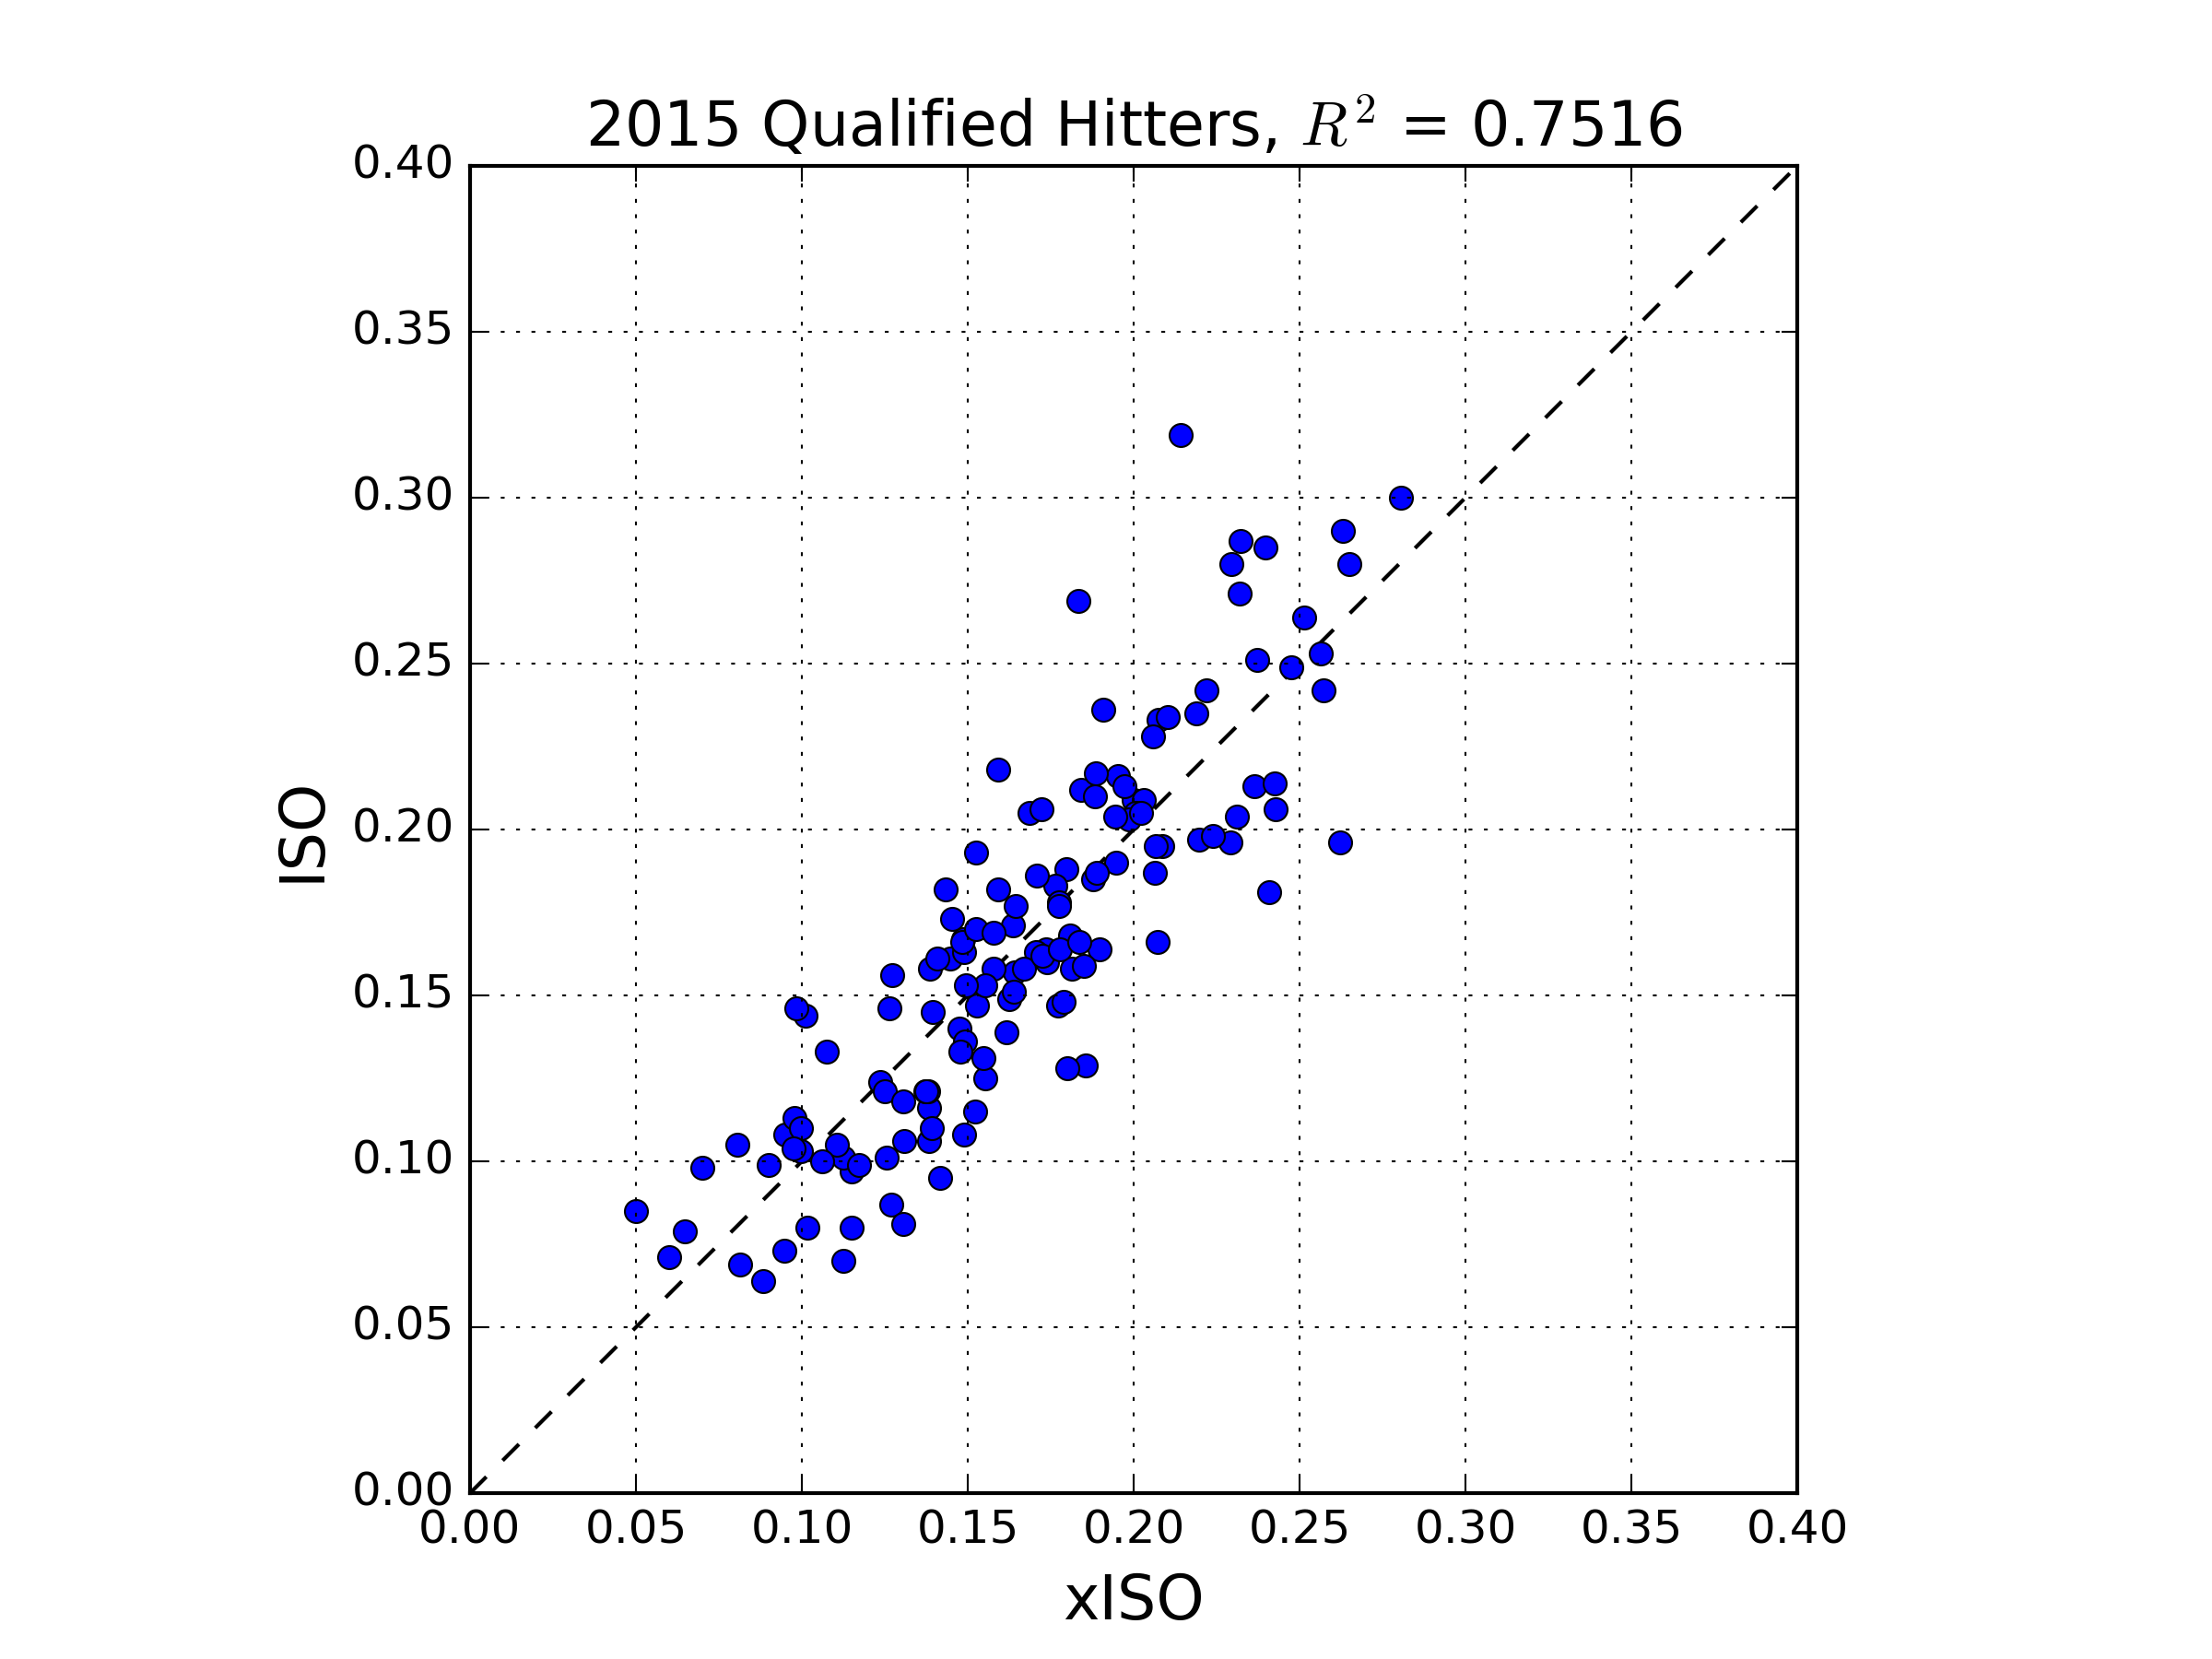
So we’re down to two predictors, GB% and LDFBEV. If we ran a regression with only these two predictors, we would undersell the players who hit the ball really hard. To solve this, we’ll simply include another term in the regression, simply the square of the exit velocity. Throw in a constant term, and we’re ready to run the regression using all 2015 qualified hitters (141 of them). Here’s what comes out:

xISO Model Regression

First things first, we see an R-squared value of 0.75. This is pretty decent; it means our really simple model explains 75% of the variance of of the ISO data. The regression coefficients are as follows.

xISO = -0.358973*(GB) – 0.108255*(EV) + .00066305*(EV)^2 + 4.66285

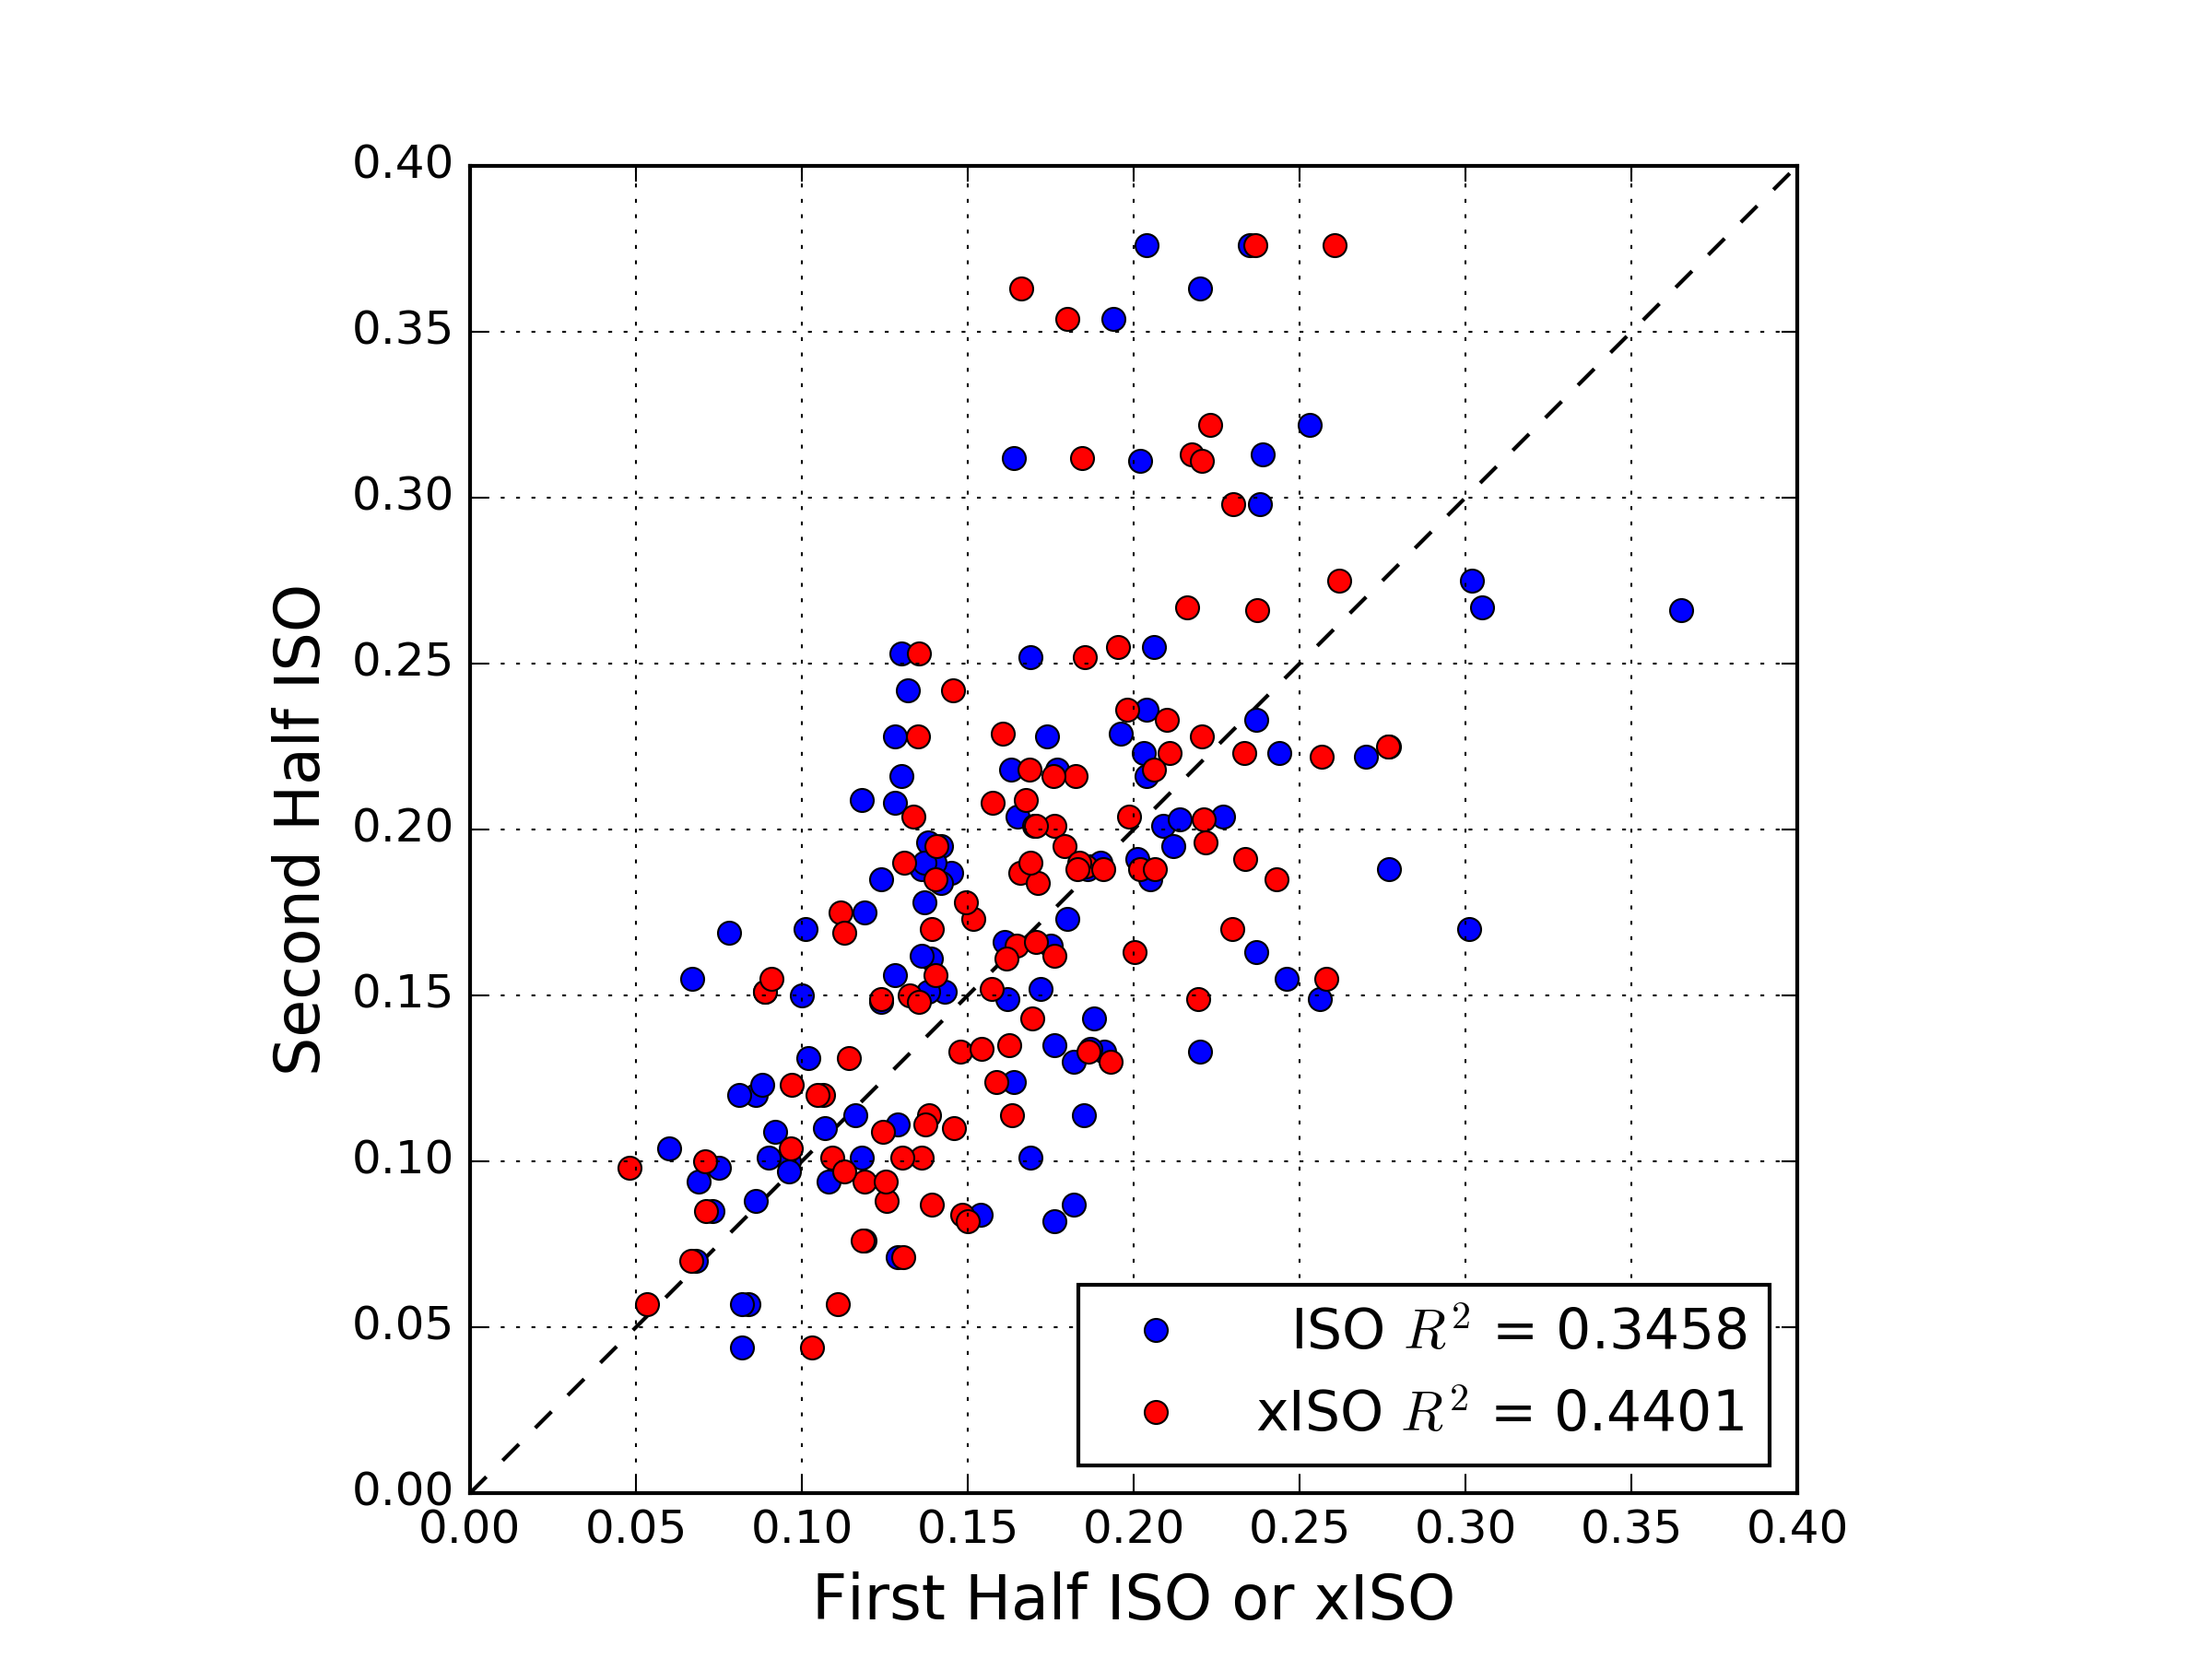
With this equation, one can look up the relevant data on FanGraphs and Baseball Savant, and calculate the current xISO for any given player. We’ll get to that, but first, I think it’s important to check whether the new xISO model can do a better job predicting future performance than a player’s current ISO. One could also check how quickly xISO stabilizes, compared to ISO, but I won’t attempt that here. What I will do is produce the necessary splits for GB%, LDFBEV, and ISO from FanGraphs and Baseball Savant, calculate 2015 first half xISO for all qualified, and compare to second half ISO. Unfortunately, the number of qualifying players common to the first and second half in 2015 was only 109, but this is what we have:

First Half Second Half

It’s hard to see from the plot, but the R-squared values tell the story: first half xISO does a better job than actual first half ISO at predicting second half ISO. Interestingly, it seems that several players significantly increased second half ISO compared to first half xISO or ISO, and relatively fewer saw a large decrease. I don’t know why this is, but perhaps it is related to the phenomenon detailed by Rob Arthur and Ben Lindbergh on the sudden power spike in 2015.

Having roughly demonstrated the predictive power of our new xISO, let’s show its utility by looking at a few interesting 2016 performers, as of May 22nd:

Trevor Story: ISO = .327,  xISO = .272

Domingo Santana: ISO = .142,  xISO = .238

Troy Tulowitzki: ISO = .190,  xISO = .182

Chris Carter: ISO = .349,  xISO = .355

Christian Yelich: ISO = .205,  xISO = .201

One of the first half’s great surprises, Trevor Story has a slightly inflated ISO, but he does hit the ball pretty hard, and does not hit many ground balls. While he probably won’t sustain an ISO north of .300, he’s a good bet to beat his Steamer ROS projected ISO of .191. Santana and Yelich are two guys who hit the ball hard, but are are held back by their ground ball tendencies. Chris Carter currently leads the pack in LDFBEV, and is a deserved second in ISO. Troy Tulowitzki fans: sorry, but it appears his days of .250 ISOs are a thing of the past.

So that’s it! We’ve got a cool new tool to use. Perhaps not surprisingly, I’ll be mostly using it for fantasy. Dedicated FanGraphs readers will also note that Andrew Perpetua has been doing work with Statcast data on “these electronic pages” recently as well. His use of launch angles introduces more sophistication into the models, but also more complication. My intent here is to present something which can be evaluated by anyone with a few clicks and a calculator. Please reach out with any qualms, criticisms, or suggestions for improvement!


Tyler Wilson and His Five Plus Pitches

Let me preface this article by saying that I watch A LOT of baseball.  I also have an extensive analytical background and am always analyzing baseball stats looking for value in players.  Last week, I was watching an Orioles game and the starting pitcher was a player I have never heard of.  His name is Tyler Wilson.  While watching the game, I was very impressed with his overall make-up and the confidence he displayed in each one of his pitches.  Many times what separates a pitcher from being able to start at the big-league level versus being destined for the bullpen is the ability to throw multiple pitches.  The ability to throw each of those pitches effectively, however, can be what separates a good starting pitcher from a great starting pitcher.  The more I watched of Wilson, the more intrigued I became about his future outlook, and the more motivated I became to write this article.  (I went back and watched all of Wilson’s starts this year before writing this article.)

To give you a little background, Tyler Wilson has never been an elite prospect.  He attended college at the University of Virginia, where he was overlooked by fellow staff-mate, and future 1st round pick, Danny Hultzen.  Wilson was drafted by the Orioles in the 10th round of the 2011 MLB Draft.  Ever since being drafted, he has quietly excelled at every level.  He doesn’t have the dominant strikeout numbers that you look for in pitching prospects, which is a big reason he has gone overlooked for much of his career.

After climbing his way through the organizational ladder, Wilson made his major league debut with the Orioles last year and eventually made the team this year out of spring training.  Although he made the team in a bullpen role, early season injuries to the Orioles pitching staff opened up an opportunity and Wilson has really taken advantage of it.  Enough of the background though.  Let’s move on to what I saw while actually watching him pitch.

Tyler Wilson features a cutter and a two-seam fastball.  Each of these pitches sit in the 89-91 mph range and both show a great amount of movement.  The cutter is most effective against right-handed batters when thrown on the outside portion of the plate.  Check out the video below to watch him fool Kansas City Royals outfielder Lorenzo Cain with three straight cutters:

He essentially gave Cain, a very good hitter, three of the exact same pitches in a row…and Cain couldn’t touch them.  In every start this year, Wilson has pounded the outside corner with this cutter and has had fantastic results.  Don’t think by any means though that he is a one trick pony.  As soon as you start to expect that cutter on the outside corner, Wilson will come right back in on you with a two-seam fastball:

Look at the horizontal movement on that pitch!  Absolutely filthy!  Wilson has showed a ton of confidence in both of those pitches so far this season as he uses them to pound both sides of the strike zone and his command of them has been exceptional.  He is not afraid to throw them in any count and they are equally effective vs both left-handed and right-handed batters.

While his fastballs both seemed to be plus pitches upon first glance, I started to have thoughts that this guy might be for real as soon as he started throwing his curveball.  Wilson’s breaking ball sits in the 77-79 mph range.  I was astonished by how well he was able to locate his curve and the amount of movement on each and every one he threw.  Watch him send White Sox slugger Jose Abreu down swinging in the video below:

Abreu had no chance.  In his most recent start against the Twins, Wilson’s curve looked even better.  Check out the one he threw to Byung-Ho Park:

Both of those pitches came in a 2-2 count.  Many pitchers are scared to throw a breaking ball in a 2-2 count, especially to players with plus power such as Abreu and Park.  If you miss your target, two things can happen.  One — you leave the ball up in the zone and it gets hit out of the stadium.  Two — you throw it in the dirt; the hitter lays off; and now you have to pitch to this slugger with a full count.  Wilson isn’t scared to throw his curveball in any count and that is what makes him so dangerous.  You never know when to expect it, but at the same time you have to expect that he can throw it at any moment.

The last pitch in Wilson’s arsenal is his changeup.  This pitch has a ton of downward movement and produces a lot of groundballs.  While there were many better examples that I could have shown you of his change-up in action, I wanted to show one of his bad ones.  Even when he missed his target, the batter was still fooled by the amount of movement on this pitch.  Check out the following pitch to Royals SS Alcides Escobar:

The catcher set up down in the zone and Wilson clearly misses his target.  Luckily it didn’t seem to matter as the pitch had an insane amount of horizontal movement, running in on Escobar and jamming him.

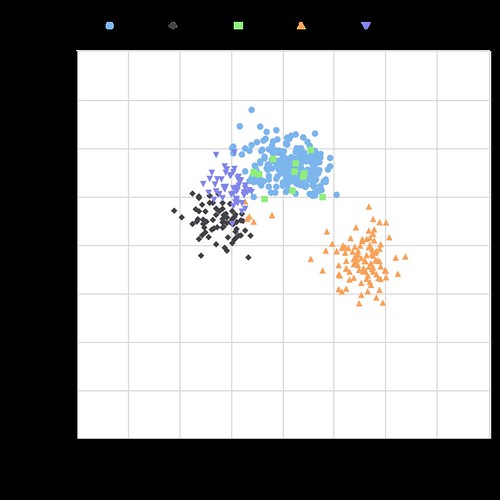
Take a look at the chart below, showing the vertical and horizontal movement on each of Wilson’s pitches:

Tyler Wilson Movement

The middle portion of this chart is empty.  All five of his pitches have a tremendous amount of movement, and none of them move in the same direction.  The fact that he is able to command each of these pitches so well and keep hitters guessing with which one will come next is the reason why he has had so much success.  A big reason why hitters are having trouble guessing his pitches is because of how well Wilson is able to repeat his delivery.  The chart below shows Wilson’s release point for each type of pitch:

Tyler Wilson Release Point
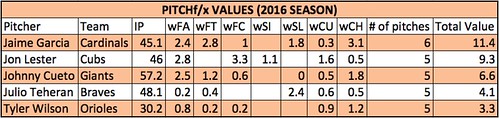
As you can see, his release point is almost identical with all five of his pitches.  At this point, I have watched all of his starts from this season and was very impressed.   I then decided to do some research and was immediately impressed with stats such as his career BB rate and low WHIP, but wanted to dig further.  I began to look through the PITCHf/x data because I was curious to see how effective each of his pitches actually were.  Based on the PITCHf/x value metric, all of his pitches so far this year have graded as above average.  If you are not familiar with the PITCHf/x value scale, someone who has a fastball ranking of zero means that he possesses an average fastball.  Any value above zero means that pitch is above average.  Obviously the higher the number, the better the pitch.  The same goes for negative numbers and pitches being below average.  See the table below for the breakdown of Wilson’s arsenal:

Screen Shot 2016-05-15 at 1.19.17 AM

Based on the above values, the change-up has been Wilson’s most valuable pitch this season with his curveball close behind.  Obviously it is very early in the season and we are working with a small sample size…but that doesn’t mean we can’t have fun!  While doing this research, I set out the goal to find every starting pitcher who throws five or more above-average pitches.  Below is the list of players who fit that description:

Screen Shot 2016-05-15 at 1.41.09 AM
IP = Innings Pitched
FA = Fastball
FT = Two-Seam Fastball
FC = Cut Fastball
SI = Sinker
SL = Slider
CU = Curveball
CH = Change-up
KC = Knuckle Curveball
EP = Eephus

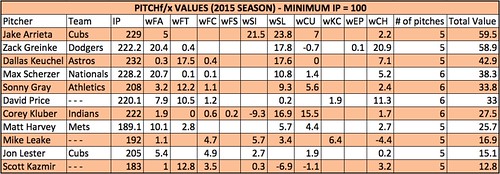
There are only five pitchers who have thrown five or more pitches above average so far this season!  Wilson is in great company, as the other four pitchers are all All-Star-caliber players and borderline household names.  Being that this is such a small sample size, I decided to look back at last year’s stats to see how many players fit this description over a full season.  Using the same parameters and setting the minimum IP to 100, the following table was produced:

Screen Shot 2016-05-15 at 2.05.17 AM

Once again, the names on this list are some of the top pitchers in baseball.  A few of these pitchers have a pitch that graded out as below average, but since they had five or more different pitches all individually grade as above average, they made the final cut.

As you can see, it is very rare to have a pitcher who has five legitimate plus pitches.  I am very interested to see if Tyler Wilson can maintain these results over the course of a full season, and I really hope he is given the opportunity to do so.  If he continues to pitch the way he has been, the Orioles will have no choice but to leave him in the rotation.  Although he has had limited success, Wilson has struggled in each of his starts when facing the lineup the third time around.  This could be due to the fact that he is still in the process of being stretched out from his bullpen role.  When in the bullpen, you don’t have to prepare to face the same hitter three times.  I am hopeful that once he is fully stretched out and back into his starter mentality, he will be able to make the necessary adjustments and continue to throw all of his pitches with confidence.  If he can continue to make quality pitches as he faces the lineup for a third time, I believe Tyler Wilson has the chance to become a very special pitcher.

Memorable quotes I heard during the TV broadcasts:

“Everyone thinks that I pitch with a chip on my shoulder but I really don’t.  I just go out and compete.  I don’t think of it that way.” – Tyler Wilson

“I think he understands himself.  He can maintain his game-plan throughout the game.  He’s going to keep us in the game and give us a chance to win.  What more can you ask for?” – Pitching Coach Dave Wallace

“I love that he can make the ball run in and then cut away.  He pitches to both sides of the plate.  Not a lot of young pitchers can do that.” – Manager Buck Showalter

…no Buck, not a lot of young pitchers can do that.

Twitter – @mtamburri922