Archive for Detroit Tigers

Using Statcast to Substitute the KC Outfield for Detroit’s

As I write this post the KC outfield defense is ranked No. 1 in Defensive Runs Saved (DRS) with 43, and is No. 2 in UZR at 28.6 (first is the Cubs with 29.0).  KC sports one of the best, if not the best defensive outfield in the majors this season.

Detroit on the other hand has a fairly poor one.  They rank last in DRS, with -44, and last in UZR at -31.8.  Though Baltimore gives them a good run for their money, Detroit is probably the worst defensive outfield in the majors so far this season.

So I wondered if we could do an analysis to show what would happen if we substituted them entirely for one another?  How would that work?  Well, one simple approach would be to just use the DRS metrics for each team and basically say that DET would go from -44 to +43, so that’s a swing of +77 runs. Using the 10 runs per win thumb-rule, that’d be a pretty big swing, nearly eight games. Detroit is a whole lot better.  But I’m not sure this method is really the best we can do.  After all, we have all this Statcast data now.  Could we use that?

I set out to try to do just that.  So my first step was to hypothesize that the likelihood of a ball hit to the outfield actually dropping for a base hit could be correlated to the launch angle provided by Statcast and then that this likelihood would change depending on the team.  So to test this theory out I went to Baseball Savant and grabbed all the Statcast data for balls hit to the outfield for KC and for Detroit.

The KC data consisted of 1722 balls hit to the OF (when removing the few points that had NULL data for launch angle).  I took these 1722 points and bucketed them by launch angle in buckets that were 2 degrees each.  I then calculated the percentage of hits to total (hits + outs) for each bucket.  This percentage was the likelihood that a ball hit to the outfield at a certain launch angle would end up being a base hit.  This led me to my first realization, which was that anything that was basically < 8 degrees on launch angle (so including all negative angles), and made it to the OF, was a guaranteed hit.

The results of this analysis for the 1722 KC points made a lot of sense intuitively.  As the launch angle increased, so did the likelihood that it was an out, so my hit percentage trend went down.  Using a simple linear regression projecting the likelihood of a hit by angle had a 92.5% R^2.  This equation was going to work nicely.

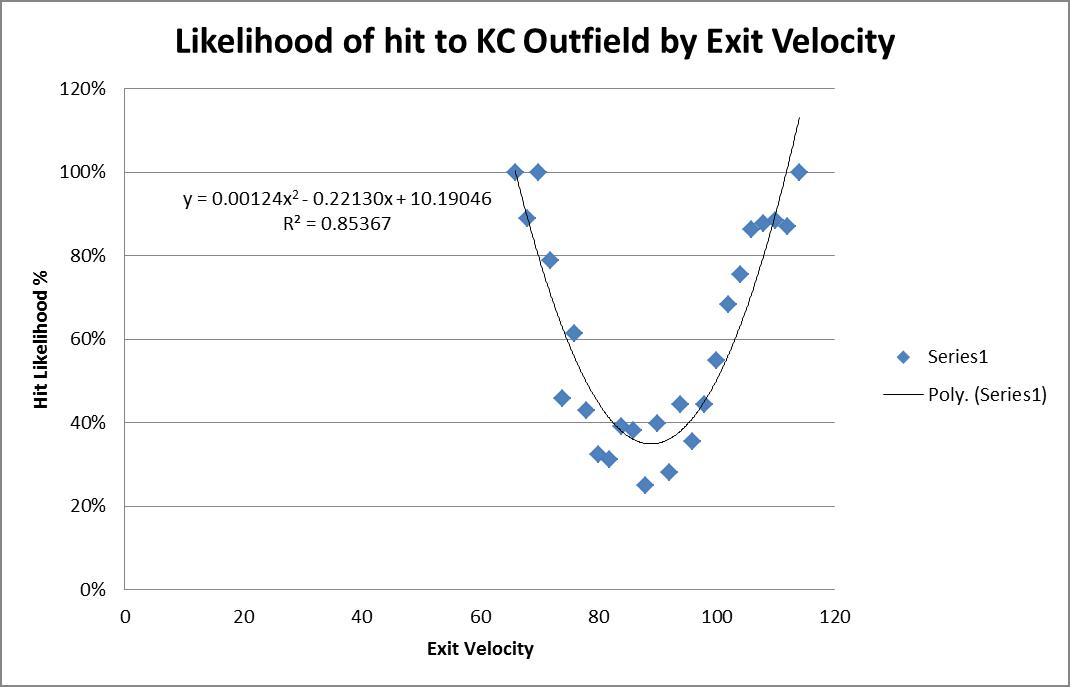
I then considered running the same drill but this time using exit velocity of the hit to see how that impacted the likelihood of a ball being a hit.  There have been at least a couple article written on this topic, and the results I got matched up with the projections I had seen in other articles on the topic.  That’s to say the trend isn’t linear, but more parabolic. Using a simple second-order polynomial trend, a very reasonable projection could again be made of a hit likelihood based on the exit velocity of a ball hit to the OF.
Using these two points of data for any ball put in play to the outfield (exit velocity and launch angle) it seems as though OF defense could be projected fairly reasonably.
I proceeded to re-run those same drills using Baseball Savant’s Detroit outfield data. Launch angle provided another great fit, 95% R^2 and a slightly higher overall trendline than KCs (notice the higher y-intercept or “b” value).  KC’s OF was almost 4% more likely to catch a ball just from the “b” value.
Using a simple second-order poly trend for Detroit’s exit velocity also resulted again in an 85% R^2, very similar to that of KC.  It also showed the expected parabolic action.
What I now had was a way to project the likelihood of the KC outfield or the DET outfield making a play on any ball hit to the outfield.  All I needed to know was what the angle and exit velocity was.  Lucky for us, Statcast gives us all that information.
My next step was to take all the OF plays made by Detroit and, using my newfound Detroit projection system, project the number of real hits based on the hit events to the OF.  My Detroit projection system projected 1089 hits, in reality there were 986 hits. Not perfect, and something that could undergo some more tweaking, but reasonable.  My projection system was overly simplistic — I took the likelihood from the angle * the likelihood from the exit velocity.  If the multiplication was > 25% (i.e. 50% for each as the minimum threshold) then I projected a hit; else, an out.
So my Detroit projecting Detroit resulted in 1089 hits.  When I substituted the KC projection equations in, the Detroit projected hit to the OF dropped to 903.  This was a reduction of 186 expected hits!  Wow.  That’s some serious work the KC outfielders would’ve done.
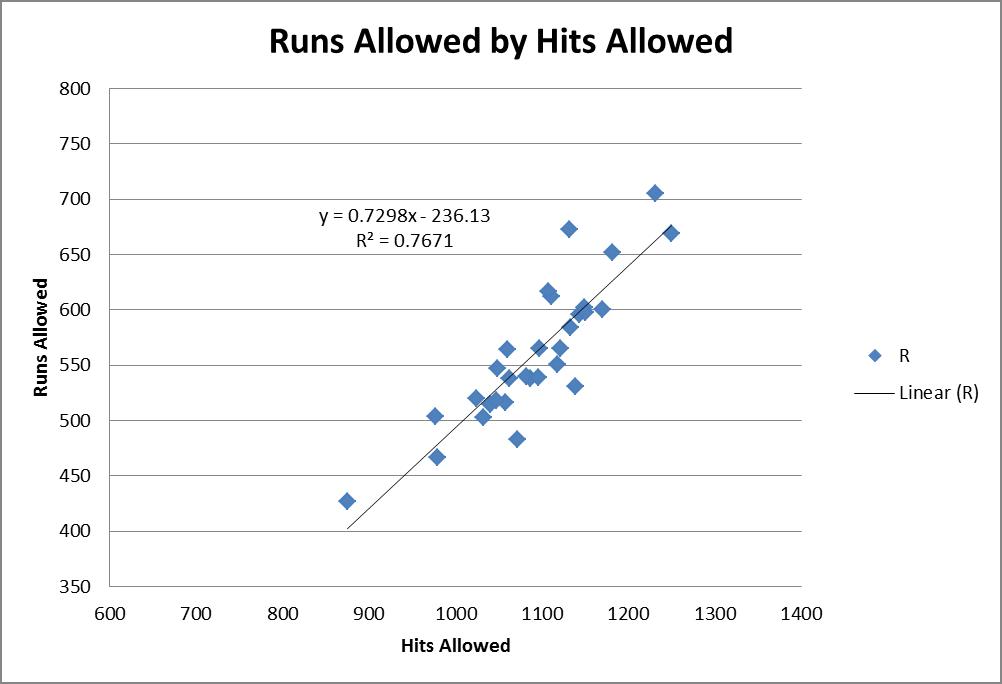
The last step here was then to attempt to convert this reduction in hits to a reduction in runs.  I grabbed FanGraphs’ year-to-date pitching stats by team and used that to do a simple regression on hits allowed to runs allowed.
This showed strong correlation with a ~77% R^2.  Using the slope of this equation it shows that each hit allowed correlates to 0.7298 runs.  This means that a reduction of 186 hits would correlate to a reduction of 136 runs! Again, using the 10-run thumb-rule, that’s a nearly 14-win move.  That’s amazing improvement.   Now of course we are expecting drastic improvement; we’re talking about replacing the worst OF defense in the league with the best!
Conclusions
Are there some bold assumptions made here? Yes.  However, I do think it’s a fairly reasonable approach.  It’s fun to see all the different ways this new Statcast data can be used.  This same drill could be run on all sorts of “swap” evaluations and could be a whole lot of fun for a variety of what-if scenarios.  I enjoyed attempting to answer this question using the new data and hopefully you found this entertaining as well!

Expected RBI Totals: The Top 267 xRBI Totals for 2013

While there is almost zero skill when it comes to the amount of RBI a player produces, through the creation of an expected RBI metric I have found a way to look at whether or not a player has gotten lucky or unfortunate when it comes to their actual RBI total.

I hope I don’t need to do this for most of our readers, because it’s 2014 and you’re reading about baseball on a far off corner of Internet, so you obviously are more informed than the average fan who consumes ESPN as their main source of baseball information, but lets talk about why RBI, as a stat, and why it is not valuable when you look at a players’ talent. The amount of RBI a player produces are almost—we’ll get into the almost a little later—entirely dependent on the lineup a player plays in. If a player doesn’t have teammates that can get on base in front of them in the lineup, there aren’t very many opportunities for RBIs; that’s the long and short. Really, RBI tell more about the lineup a player plays in than the player himself.

Intuitively, this makes sense.  The more runners there are on base, the more chances the batter will have for RBI, and the more RBI the batter will accumulate. When I said, “The amount of RBI a player produces are almost…entirely dependent on the lineup a player plays in”, lets be a little more precise. My research took the last three years of data (2010 to 2013) and looked at all players that had 180 runners on base (ROB) during their at bats over the course of a season. Over the three seasons, which should be enough data—it was a pain in the ass to obtain the data that I did find—ROB correlated with RBI by a correlation coefficient of .794 (r2 = .63169), which is a very strong positive relationship.

But hey, that doesn’t mean that you can be a lousy hitter get a lot of RBI. That would be like if you threw a hobo in the Playboy Mansion and expected him to get a lot of tail; all the opportunity in the world can’t mask the smell of Pall Malls, grain alcohol and a lifetime of deflected introspection; trust me, I worked at a liquor store for three years in college, and I know.  In the same sample of players from 2010 to 2013 as used above, the correlation between wOBA—what we’ll use here to define a player’s ability at the plate—and RBI is .6555. So there is a relationship between a player’s ability and their RBI total, but nowhere near as strong as the relationship between their RBI total and their opportunity—ROB.

However, when we combine a player’s opportunity—ROB—with their talent—wOBA—we should get a good idea of what to expect for a hitter’s RBI total. Here is the formula for the expected RBI totals based on the correlations between ROB and wOBA, and RBI: xRBI =- 85.0997 + 262.7424 * wOBA + 0.1918 * ROB.

When you combine wOBA and ROB into this formula you end up with a correlation coefficient of .878 and an r2 of .771. Wooooo (Ric Flair voice)!!!!!  With the addition of wOBA to ROB we increase our r2, from .63 with just ROB, by fourteen percent.

2013 Expected RBI Leaders

Click Here to See xRBI Leaderboard

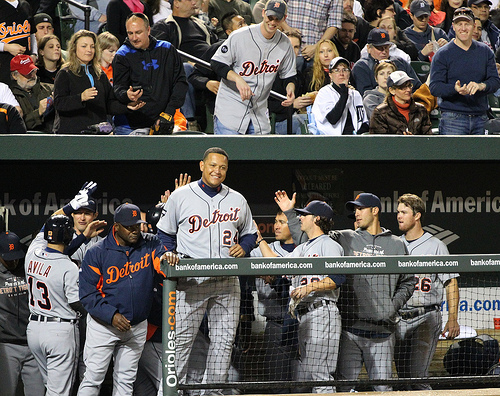
Miguel Cabrera
Photo by: Keith Allison

Let’s think about why Chris Davis’ xRBI is so much lower than his 2013 actual RBI total.

Davis had 396 runners on base while he batted in 2013, which is 140 ROB less than Prince Fielder who led the league with 536 ROB; Davis’ opportunity was limited.

Davis’ RBI total was considerably higher than what his opportunity would suggest his RBI total should be, and one of the reasons that he outperformed his xRBI total by so much was because of the amount of home runs he hit. Davis, or any batter, doesn’t need a runner on base to get an RBI when he hits a home run. But beyond home runs there is another reason why Davis and other batters outperform their xRBI totals: luck.

Hitting with runners on base is not a skill. A batter has the same probability, regardless of the base/out state, of a hit. Lets forget pitcher handedness and Davis’ platoon splits at the moment. With a runner on second base and two outs Chris Davis will get a hit .272 (27%) of the time—I averaged his Steamer and Oliver projections for 2014 together. Davis, and Alfonso Soriano for that matter, who was the only player to outperform his xRBI by more than Davis in 2013, was lucky and happened to have runners on base the majority of the 28.6%—Davis’ 2013 batting average—of the time he got a hit in 2013.

To put Davis’ 2013 136 RBI season into perspective, in the last five seasons there have been eight players to record 130 or more RBI in a season. Of those eight players, only two—Ryan Howard (2008-9) and Miguel Cabrera (2012-13)—were able to duplicate the performance the following year.

While the combination of ROB and wOBA has allowed us come up with a reliable xRBI, the next step, to increase the reliability of xRBI and account for players who produce a large amount of their RBI from home runs (i.e. Davis), is to include a power component in xRBI: HR/FB ratio.

Follow Me on TwitterDevin Jordan is obsessed with statistical analysis, non-fiction literature, and electronic music. If you enjoyed reading him, follow him on Twitter @devinjjordan.


Justin Verlander: Ready to Regain Righteousness

So last year in my 10-Team, 35 man roster, dynasty fantasy baseball league, I found myself in need of some starting pitching after the first two months of the season. I was last in my league in quality starts, and near the bottom in ERA and WHIP. Manny Machado was my cornerstone 3rd baseman, and he was hitting a fiery .355 for the month of May. For how good he is, I did not believe he was a batting title contender, so was interested in seeing what I could get for him.

Enter Justin Verlander. The Tigers’ ace, (at the time) had a 1.83 ERA and was 3-2 in April, and had hit a rough spot in May where he surrendered 16 ER in 12.2 innings. After going 17-8 with 239 K’s in 2012, I felt like this was a great time to buy low on the guy, while selling high on Machado. So I traded the Orioles’ phenom for the Mr. Kate Upton. Well, safe to say, that WAS NOT the trade that ended up winning me the league. From the end of May forward, Verlander posted a 3.36 ERA for the remainder of the season and was walking batters like it was the cool thing to do, posting a 3.07 BB/9 (which is AWFUL for him). He ended the season with a 3.46 ERA and only 13 wins, which were his worst totals in those categories since 2008. This isn’t an argument against Machado’s lack of offensive ability, which I will discuss at a later date. Instead, I will be telling you why Verlander’s performance last season was a fluke, and he will regain his Cy Young form in 2014.

As pitchers age, they usually lose a little oomph on their fastball. People will probably look at Verlander and assume this is the reason why he was less effective in 2013.


Year

Age

Fastball Velocity (average)

2010

27

95.5

2011

28

95.0

2012

29

94.7

2013

30

94.0


Based on the table above, you can see how he has lost some velocity on his fastball. For more detail, follow this link to view his velocity charts for 2013 and compare it to his prior years. If you notice, in his first five starts of 2013, his fastball average was hovering around the 93 mph mark, well below his average of the last four years, 95.2 mph. In those first five starts, Verlander posted an ERA of 1.83, had a K/9 of 9.38, WHIP of 1.19, and held batters to a .242 average. Even with a fastball that seems to be slowing down, Verlander has still found a way to retire batters, and more importantly, still strike them out. So the argument that his fastball is becoming “too hittable” isn’t necessarily correct.

BABIP, for those of you who don’t know, is the percentage of time that if a batter makes contact with a ball and puts it in the field of play, it will go for a hit. Generally, the league average for hitters falls somewhere between .290-.310. But there are plenty of factors that can influence BABIP, such as a player’s skill, defense behind a pitcher, and our good friend LUCK. More on that in a moment, but first, let’s establish what factors influenced Verlander’s BABIP. From 2008-2012, Verlander had an average BABIP of .282, which is below the league’s average range of .290-.310. Based on this sample size, we can assume Verlander’s skill set is above the mean for pitcher. Secondly, Defense. According to baseballreference.com, the Detroit Tigers ranked 12th out of 15 AL teams last year in errors and double plays. On a more optimistic note, they were 4th in fielding %. Those numbers indicate that they were a mediocre, at best, defensive team, which would cause Verlander’s BABIP to slightly increase toward the league mean. Lastly, we don’t have a way to measure luck, but Verlander’s 2013 BABIP was way above his recent average of .282, sitting at .316.

Point being, there were too many balls that were put in play that fell for hits considering all the conditions I stated above for Verlander.

It was not just his inflated BABIP that led to a down year in 2013 for Verlander. He posted a five-year high in BB/9, at 3.09. When you walk people and then give up hits, runners are bound to score. In 77.2 innings in June and July of last year he walked 33 batters. In the final 97.2 innings of last season and the playoffs, he only walked a combined 22 batters. He was able to regain his control in the second half that he had lost mid-way through 2013. I think the control he demonstrated toward the end of 2013 will carry over into 2014.

One more random stat to consider: Verlander’s IFH% (infield hit percentage) for his career sits at 5.9%. Last season, that stat jumped up to a recent high at 8.3%. Reasons for that stat being high could result from the inefficiencies of Miguel Cabrera at 3rd base, or inconsistent defense of Jhonny Peralta. The Tigers now have the more athletic Nick Castellanos at 3rd, and made a mid-season trade last year for Jose Iglesias. Both of those additions provide upgrades defensively for the Tigers compared to last year.

With everything that I’ve discussed, this guy is being way undervalued in fantasy drafts this year, going in the 5th or 6th rounds depending on the format. If you can grab him in the 4th over guys like Zach Greinke or Madison Bumgarner, I would do so. He still strikes people out at a high rate, posting 217 K’s last year. Also, don’t forget that he pitches for a team with one of the most potent offenses in the game. When Verlander’s BABIP regresses, his improved defense and control kicks in, he will regain his righteousness.


Comparing the Captain: Jeter vs. Trammell

On Wednesday, February 12th, Derek Jeter announced that he will be retiring at the end of the 2014 season. This has taken over baseball headlines, and rightfully so. Jeter, a lifetime New York Yankee, is their captain and has been their starting shortstop since 1996. He is a 13 time All Star, 5 time Silver Slugger award winner, 5 time Gold Glove winner, and a 5 time World Series champion. On top of all that, Jeter has long been considered one of the true class acts of the game. In 2020 when he is eligible for the Hall of Fame, he will almost certainly be elected to it with close to a unanimous vote. Derek Jeter’s playing career was nothing short of spectacular.

On the other side of the comparison we have Alan Trammell, who played his entire career with the Detroit Tigers. Manning shortstop from 1977 to 1996, Trammell is a 6 time All Star, a 4 time Gold Glove winner, a 3 time Silver Slugger winner, and a World Series champion. He is not in the Hall of Fame and is barely holding onto a spot on the ballot. His career was also spectacular.

When you compare the accolades that each earned, Jeter easily beats out Trammell. Funny thing about all of those awards mentioned above is that they are either voted on by a committee or earned with 24 other guys on the roster. The only way to truly compare their careers is to delve into their individual advanced statistics, so let’s do exactly that!

Offense
Let’s start with with the offensive side of the stats. Through 11,986 plate appearances, Derek Jeter has a career OPS of .828, a wOBA of .365, and an average wRC+ of 121. Jeter is also a member of the 3,000 hit club. In 9,375 career plate appearances, Tram has an OPS of .767, a wOBA of .343, and an average wRC+ of 111. Alan Trammell does not have 3,000 hits, coming up short with 2,365.

Shortstops are generally considered to have the least amount of offensive production among position players. Based off of the numbers from Scoresheetwiz, the average shortstop OPS is around .749. According to FanGraphs, in 2011 the average wOBA for shortstops was .303. The average wRC+ for shortstops during Trammell’s career fluctuated between 68 and 93, and 80 and 97 during Jeter’s career according to SABR. Among shortstops, all of Jeter and Trammell’s numbers are considered well above average, but the Captain clearly has the edge.

For Hall of Fame shortstops, both of their numbers stack up quite well. Among Hall of Famers, OPS fluctuates between .653 and .859, wOBA between .296 and .409, and wRC+ between 83 and 147. Jeter will be near the top in all three of those hitting categories when he enters the Hall, while Trammell would be more towards the lower middle. Needless to say, both have earned their spots among the all time greats based off of their performances at the plate.

Defense
Comparing Derek Jeter’s defense to Alan Trammell’s is where this article gets tricky. Defensive metrics have come a long way since Trammell’s day. Today, sabermatricians use advanced metrics such as Ultimate Zone Rating (UZR), and Probabilistic Model of Range (PMR). I’ll mention Jeter’s UZR, but I won’t use it to compare him to Trammell. The statistic I will use, which is widely considered to be the most accurate way of measuring defensive ability from 1954-2001, is Total Zone (TZ).

Alan Trammell’s TZ for his entire career at shortstop was 80, while Derek Jeter’s is -129. Total Zone isn’t as accurate as a defensive metric such as UZR, but when you have a 209 run difference, I think it’s fairly easy to distinguish the better fielder. Trammell only had a negative TZ in 5 seasons out of his 20. The only years that Jeter posted a positive TZ rating were 98′, 04′, and 09′.

The metric that I used to compare both of these players to other Hall of Famers was Defensive WAR. The lowest career Def in the Hall of Fame is 27.3, held by Robin Yount. The high Def is 375.3, which is from Ozzie Smith. Alan Trammell would actually be tied with Honus Wagner for 13th on the list of Def with 184.4, while Derek Jeter would be in last place with a Def of -25.7.

I am well aware of some of the seemingly spectacular plays that Derek Jeter made in the field. Unlike Trammell, I grew up watching Jeter. Yes, Jeter made some eye popping plays throughout his career, but people fail to acknowledge that there were numerous plays that he didn’t make. Judging by Jeter’s UZR, he cost the Yankees -67.8 runs throughout the more recent bulk of his career. He may have made some big plays along the way that will be remembered, but he cost the Yankees way more runs that theoretically could have made it so the big plays weren’t even necessary.

Bottom line, Alan Trammell was a much better defensive shortstop than Derek Jeter despite having fewer Gold Glove awards. Judging by Jeter’s advanced metrics, he really wasn’t that good of a fielder at all.

Total Value
Oh no, this is where I bring out that WAR mumbo jumbo. If you’ve read anything from me before, you probably know that I am an advocate of using Wins Above Replacement to analyze a player’s total value. While it shouldn’t be the end all, be all statistic, it is great to use when comparing two players’ total contributions on the field.

Derek Jeter has a career WAR of 73.7, and Alan Trammell has a career WAR of 63.7. Despite Jeter’s poor defense throughout his career, he hit well enough to still prove more valuable than Trammell. I think that’s a testament to how truly great of a hitter Jeter was. When compared to other Hall of Famers, both WARs fit in nicely. Honus Wagner holds a large lead for WAR at 138.1, while John Ward is in last with a 39.8 WAR. When Jeter enters the Hall, he will be 4th on the list, and if Tram was in the Hall, he would be 11th.

Conclusion
Overall, Derek Jeter had a better career than Alan Trammell, but both are much deserving of spots in the Hall of Fame. To almost any baseball fan, Jeter is considered a first ballot Hall of Famer. Why then, is Allan Trammell being completely overlooked? The voters in the BBWAA need to sit down and reexamine Trammell’s career. Trammell didn’t have the New York media following that Jeter has gotten to experience throughout his legendary career, but media coverage shouldn’t be what decides who goes into the Hall and who doesn’t. Allan Trammell deserves justice, and when you compare his numbers to the greatest players to ever play his position, you will see that he ranks right up there with them.


Warning! Beware of Nelson Cruz

Lately I’ve been hearing some rumors connecting the Tigers to free agent outfielder Nelson Cruz. I understand how fans have been hungry for another power bat since Prince Fielder was traded, but Nelson Cruz is not the guy you want. It’s not because of the whole PED suspension last year, or even the fact that he single-handedly dismantled the Tigers in the 2011 ALCS. No, it’s simply because he is not that valuable of an all around baseball player.

I don’t particularly enjoy writing pieces where I talk about a player’s shortcomings. At the end of the day, these guys are major leaguers and I’m still a kid who’s a fringe high school bench player who doesn’t know whether he’s a natural right-handed or left-handed hitter (I’m really bad at both). But due to the recent clamoring for Cruz, I figured it was my duty to all my readers to expose the truth about him.

The Good

Nelson Cruz is a solid power hitter. Despite having a shortened season due to a 50 game suspension, Cruz still managed to hit 27 HR in 109 games. With a respectable ISO of .240 in 2013, and a career ISO of .228, Nelson can still manage to hit for very good extra base power. His wOBA in 2013 was .359 and is .353 over the course of his career, both being good. Bottom line, he’s a good power hitter, but I never said that I’m debating that aspect of his game.

The Bad

Nelson Cruz does not have very good plate discipline. Assuming that we’re talking about the guy that’s supposedly going to be “protecting” Miguel Cabrera in the batting lineup, plate discipline does play a huge factor in this discussion. We don’t want a guy who’s a free swinger batting after a walk to the best hitter in the game who also happens to be really slow on the base paths. Last season, Cruz swung at 30.8% of pitches that were outside the strike zone (O-Swing%), which is really bad. He only made contact with 73.1% of the pitches that he swung at (Contact%), which is also bad. His BB/K was also bad, clocking in at 0.32. Bad. What have we learned so far? Basically, Nelson Cruz is an all or nothing hitter, which some fans really don’t mind. In the case that he’d be hitting behind Miguel Cabrera, I’d tend to shy away from a hitter like Cruz.

The Ugly

To an extent, all the bad I mentioned could be forgiven if Nelson Cruz wasn’t such a terrible defensive outfielder. Move him to DH you say? The Tigers have Victor Martinez and Miguel Cabrera who will both rotate time at 1B/DH, so there is no room whatsoever for another DH. Cruz would have to play everyday in RF or LF. He is 34 years old and 240lbs. His ability to chase down balls in open space is clearly declining. Sticking him in the outfield with Torii Hunter, who looked lost in the outfield for most of 2013, would be a horrible idea for a team that used the offseason to vastly improve their infield defense. The stat that I like to use for defense is UZR, but because of Nelson’s shortened season though, I’m going to use UZR/150. Last year, Cruz’s UZR/150 was -6.5, which is way below average. Considering he’s posted a negative UZR for the last three seasons, you can see that he is not very good at defense and is clearly not getting any better. It’s also worth mentioning that the Tigers would have to give up their 2014 first-round draft pick to the Texas Rangers considering Cruz turned down their qualifying offer of $14 million.

Total Value

In 2013, Cruz was worth 1.5 Wins Above Replacement. Andy Dirks 2013 WAR: 1.7. Obviously WAR is not the end-all-be-all statistic, but it does give a pretty good idea of what a player is worth when you replace him with someone who is league average at his position. In this case, the WAR of each player is practically identical, which means over the course of a season they will somehow be worth the same amount of wins to their team. Cruz will probably cost around $7-9 million in 2014, whereas Andy Dirks is already under contract for only $1.625 million. Assuming Cruz signs for $8 million and has the same WAR as 2013, the Tigers would be paying $5.33 million per win for him. Andy Dirks with his current contract and WAR? $956,000 per win. I know this might be some moneyballin’ right here, but if the goal of baseball is to buy wins, wouldn’t you rather have the wins at a cheaper cost?

Conclusion

When all aspects of the game are taken into account, you see that Nelson Cruz is a below-average baseball player with a plus power tool. The Tigers have Miguel Cabrera, Victor Martinez, Ian Kinsler, Austin Jackson, and Torii Hunter (and sometimes Alex Avila too) who will all contribute their fair share of runs this upcoming season. Not only do they not need a one-dimensional power hitter, he just doesn’t make sense for the makeup of their lineup which now features a solid balance of on-base average, power, and speed. Mix that with the huge liability that he is on defense, and you get a player that I don’t want to play for the Detroit Tigers.


For more information from me on the Detroit Tigers, visit www.ttowntiger.com


An Introduction to GRIT

Earlier in the month I had an idea. It all stemmed from the idea of quantifying the un-quantifiable. I was going to record grit.

A lot of times we hear about how gritty a player is, but it’s tossed around with no real proof. Sure Nick Punto dives into first a lot, but is that really more gritty than stupid? Is a guy like David Eckstein really the grittiest of all gritty players, or can it be a guy we don’t really notice?

To figure all of this out I, along with some help, wrote a formula. The formula is imperfect, because of a lack of reliable sources for things like headfirst slides and broken-up double plays, but it tries and does its job. The formula is as follows:

(((InfH+1stS3+(.5*CS+SB2+1.5*SB3+3*SBH))(2*P/PA+.5*Foul/S%))/(HR+1)+(.1*PA/Seasons)+PitchingAppearances

Where InfH stands for Infield Hits and 1stS3 means first to third on a single, we have found a way to see a players GRIT (Game Rating In Testosterone.) All this stat is designed to show is who works harder to score a run for their team, it doesn’t show you who is better or worse, but it does show who tries.

Using this formula my small team of experts has found David Eckstein to have a career GRIT of 172.16, which is very impressive over a 10-year career, but it’s no Juan Pierre, who has amassed a career GRIT of, wait for it, 1582.

We also found the difference between Martin Prado and Justin Upton, who was the subject of criticism from Diamondbacks GM Kevin Towers who said he wasn’t gritty enough prior to trading him for Prado. We found out that Kevin Towers may have been wrong.

Using their numbers the formula says that Prado has put together a GRIT of 57.93 in his career, where Upton has a GRIT of 68.65, despite playing in one less season. So, Kevin Towers, you may need to rethink your strategy.

Also invented was TeamGRIT, a stat that uses numerous numbers to calculate how hard a team works for each run.

A disclaimer here before I list the GRITs: I am not trying to say that some teams work harder than others, nor am I saying that a high GRIT is more or less valuable than a low GRIT, all these numbers illustrate is that some teams are more comfortable with power numbers to win games, while others are more inclined to small ball.

The formula used is

(((InfH+1.5*BuntHits)+1stS3+2ndDH(.5*CS+SB2+1.5*SB3+3*SBH)(Pitches/PA+.5*Fouls/Strike%)+(GIDPinduced+OFAssists))/(HR+.5*HRA))+(.1*PA/GamesPlayed)

The following are the AL leaders prior to games played on August 7th 2013

Royals – 90.57 (9th in wins)

Indians – 74.77 (6th in wins)

Red Sox – 73.92 (1st in wins)

A’s – 70.57 (5th in wins)

Blue Jays – 61.73 (10th in wins)

Rangers – 56.52 (4th in wins)

Astros – 55.70 (15th in wins)

White Sox – 51.62 (14th in wins)

Rays – 51.10 (2nd in wins)

Angels – 48.98 (12th in wins)

Twins – 46.97 (13th in wins)

Yankees – 45.59 (8th in wins)

Orioles – 40.49 (7th in wins)

Tigers – 30.30 (3rd in wins)

Mariners – 25.90 (11th in wins)

The most interesting numbers to me are those of the Royals and the Tigers. On opposite ends of the spectrum, one is a team that absolutely crushes the ball, everything that comes their way, the Tigers hit it, and they’re fine with it. They don’t feel the need to manufacture runs the way that the Royals do. The Royals seem to grind more to score their runs. More than any other team in the league by a large margin. They, like the Astros at 55 GRITs, are doing everything in their power to score more runs. It doesn’t always work, but there’s something to be said about a team that works to get extra runs and extra outs. If anything, they’re less comfortable with a lead than the Tigers. That isn’t to say the Tigers get lazy, just that they tend to not have to try so much.

In the NL there appears to be a negative correlation between GRIT and wins; I assure you, this is just a coincidence.

NL leaders prior to games played on August 7th 2013

Pirates – 80.83 (2nd in wins)

Rockies – 77.08 (8th in wins)

Marlins – 76.31 (15th in wins)

Brewers – 73.57 (14th in wins)

Mets – 67.33 (11th in wins)

Giants – 64.21 (12th in wins)

Padres – 62.53 (9th in wins)

Phillies – 57.06 (10th in wins)

Dodgers – 51.83 (4th in wins)

Cardinals – 47.67 (3rd in wins)

Nationals – 45.03 (7th in wins)

Cubs – 44.79 (13th in wins)

Diamondbacks – 42.38 (6th in wins)

Reds – 39.99 (5th in wins)

Braves – 31.12 (1st in wins)

The only thing these numbers definitively tell us is that there is a lot more GRIT in the American League, which is a deviation from the stereotype of hard-hitting AL clubs. The longball is less important in the American League, whereas manufacturing runs is a lot more emphasized. In the National League one team stands out from the pack: The Pirates.

They have a GRIT of 80.83 while also being in 2nd place, they are the only team in the top 5 of wins who is also in the top 5 of GRIT. The Pirates also hit a fair amount of home runs, but that’s not enough for them. They aren’t comfortable with just a lead. They want more of a lead. They try their damnedest to score more runs than anyone else by any means necessary. Is this because they spent so many years as a losing team? Possibly, but that’s just a theory.

As I said before, these numbers are not proof that any team is better than another, nor are they proof than any player is better than another, just that some teams and players are GRITtier than others.

So there you have it, your introduction to GRIT.


Have the Tigers Ruined Rick Porcello?

Coming out of Seton Hall Prep in 2007, Rick Porcello was an ace in the making.  When scouts combined his age, velocity, and dominance (103Ks in 63 IP as a Senior); they saw a front-of-the-line major league starter. After being draft 27th overall, Detroit wasted no time showcasing their young ace. In order to ensure Porcello developed his other pitches, the Tigers insisted that Porcello stop relying on his curve. With his new approach, Porcello only managed 5.18 K/9 in his brief stint in the minor leagues.  Two seasons later, the strikeouts and the curveball have almost disappeared completely. While it’s still extremely early in his career, is it possible that the Tigers may have ruined Rick Porcello?

Here’s what Keith Law wrote about Porcello in 2009:

He doesn’t miss a lot of bats with the new approach, but generating ground balls keeps the pitch count down, and pitchers who throw strikes and don’t give up home runs can be very successful. But bear in mind that Porcello has the raw stuff to be more of a strikeout pitcher, and when he reaches the majors, he could blend the two approaches and be one of the top pitchers in the game.

That last sentence sums up the main cause for concern with Porcello. While scouts believe Porcello has the ability to dominate, his K/9 rate in the majors is a dismal 4.70. Even more disturbing is Porcello’s disappearing curveball. After throwing his curve 8.1% of the time in 2009, Porcello is only throwing his curveball .2% of the time in 2010.  Unless Detroit is still enforcing the “no-curve rules,” it might be time to start worrying whether his approach has been permanently impacted. It is interesting that the curve was Porcello’s worst pitch in 2009 according to the pitch type values. His reluctance to throw it in 2010, could mean that he has lost confidence in the pitch. The big question is, whether Porcello can be an ace without his curve?

Then again, Porcello is still only 21 years old and has already experienced success in the majors. It’s certainly possible that a) the Tigers are still enforcing the “no-curve rules,” or b) Porcello continues to develop into an ace while in the majors. Porcello did not spend a lot of time in the minors, and he is exceptionally young for his level. Typically, only the most promising players reach the majors at Porcello’s age. However, it is disturbing that his current approach has not produced “ace” results. Just for reference, Mark Buehrle has a higher career K/9 rate than Porcello’s current K/9. As Keith Law stated in his 2009 top prospect list, pitchers that get ground balls and prevent home runs have a lot of value, but Porcello was drafted as an ace and not an innings-eater. Yes, it’s still incredibly early in his career, but there is already some evidence to suggest Detroit may have mishandled their prized pitcher.

*This article was originally written on Foulpole2Foulpole.com