Archive for Cubs

Where Are Anthony Rizzo’s Missing Hits?

Anthony Rizzo is hitting just .257 this year with a .242 BABIP. A fantasy-league mate of mine proclaimed “Rizzo sucks this year” after a recent trade. However, the only thing I can see that’s changed is his BABIP. He’s on pace for 106 RBI and 95 runs after totaling 109 RBI and 94 runs last season. His ISO is an identical .252. For all intents and purposes, he’s the same hitter, except he’s missing some hits. My league-mate chalked this up to “he’s getting shifted more” or “he’s worse hitting against the shift.”

One of those two things is correct. Rizzo has faced a shift in 85.7% of his plate appearances this year, which isn’t different from the 85.5% he faced last season. Rizzo is, however, hitting only .247 on balls in play when facing the shift (.214 when not shifted) this year. This is a 54-point swing in BABIP from a year ago (.301 while shifted; .359 when not shifted). This amounts to 13 missing hits thus far this year against the shift (and six more when not shifted). For the purposes of this article I want to focus on the missing hits against the shift.

What we have here is the symptom of something that’s going on when Rizzo is hitting this year that wasn’t happening as much last year, so I started sniffing around for other major changes in the Rizzo data. One thing that popped into my head was that the Cubs offense, especically the top of the order, has been getting on base much less this year than last year. That led me to thinking about what the defense looks like when there are runners on base versus when the bases are empty.

For a reference point, this is a typical shift against Rizzo with no one on base:

Rizzo_Shift_No_One_On_Base

With only a runner on first base, the shift is the same, but with the obvious addition of the 1B holding the runner on.

In 2016 Rizzo batted with runners on base in ~55% of his plate appearances and ~32% of the time with runners in scoring position. In 2017 those numbers have dropped to ~45% and ~24%.

While I don’t have Rizzo-specific defensive placements for all his batted balls in play, I did compare his spray charts from last year and this year and noticed two very empty spots.

The first spot is just behind the second-base bag, where the SS typically lines up in the over-shift against Rizzo. In 102 games this year, Rizzo has yet to collect a hit to this part of the field, while he had six hits within this area of the field last year and a few more just behind it to the opposite-field side. Using the FG splits tool we can see Rizzo has an .054 AVG in this area of the field this year vs. .333 from a year ago.

Rizzo

The second empty spot is where you’d find line drives to the opposite field falling in before the left fielder. This led me to look into Rizzo’s batted-ball distribution to the pull side and opposite-field side for both ground balls and line drives. As you’ll see, Rizzo is going to the opposite field ~5% less on his ground balls, and non-oppo GBs turn into outs more frequently for Rizzo due to the shift.

Rizzo Batted Ball Distribution 2016 & 2017
PULL OPPO
2016 2017 2016 2017
GB 63.9% 60.8% 10.4% 4.8%
LD 39.2% 50.9% 25.8% 22.8%

Rizzo is hitting .140 this year on ground balls to the left or up the middle, against a .345 mark from a year ago. This accounts for eight of his 13 missing hits. Another three hits are accounted for from luck against the shift on the pull side. The remaining two missing hits are from a slight change in batted-ball distribution on line drives to the opposite field. At the end of the day, I don’t think anything has changed with Rizzo outside normal variance in various batted-ball outcomes.


The New* Eddie Butler

Eddie Butler has been a different pitcher in 2017. Through four starts with the Iowa Cubs, he is sporting a shiny 1.46 ERA, a far cry from his career 6.50 ERA after years of turmoil in the Rockies organization. The story here is an easy one to latch on to: top-shelf pitching prospect gets devoured by an offense-heavy ballpark, gets traded to the Cubs, becomes a bona fide ace. It’s the same backstory as Jake Arrieta’s, and the early returns are pointing to the same conclusion.

I am here to disagree. The further I looked into his underlying stats, the more I realized that Eddie Butler still needs to make a serious change if he wants to have any big-league success. In 2017, the “new” Eddie Butler is really the same old Eddie Butler masked by some small-sample good fortune.

Butler has never been a big strikeout guy, so he has to limit walks to survive. While his 2017 walk rate is below his career average, his strikeout rate has dipped as well, leading to a K-BB% of 3.0%. That is not good, and unfortunately, it is right in line with his career mark of 3.3%. The most recent qualified starting pitcher to post a lower K-BB% was 2012 Ricky Romero who had a K-BB% of 2.3%…which was accompanied by a 5.77 ERA. Pitchers with this profile don’t accrue very many innings, and when they do, the results show why.

If you are walking guys without striking them out, you better keep the ball in the ballpark, and Eddie Butler has definitely done that this season. He has yet to give up a single home run in his time with Iowa. David Laurila recently chatted with the right-hander about his new approach, which involves driving the ball downhill and getting back to his two-seamer, while the Rockies always prioritized his four-seamer. This new approach sounds like a recipe for a successful ground-ball pitcher, and it would explain the new ability to limit home runs. But, hold on, Butler’s career FB% is 28%, and his 2017 rate has skyrocketed to 41%, which doesn’t fit the rest of the narrative. Allowing this many fly balls is not a good sign for Butler, who has always had a bit of a home-run problem, as his career HR/FB rate sits at 18% (and no, that’s not just Coors Field – since the installation of the humidor, Rockies pitchers have posted a HR/FB rate of 11.6%). When I look at Butler, I don’t see a guy who found success with a new approach; I see a guy who is prone to home runs with a massive spike in fly-ball rate.

Butler’s success at limiting home runs thus far has allowed him to strand runners at a rate that is screaming for regression: his LOB% of 86.7% would be the highest mark for a qualified starter since Dwight Gooden in 1985. Opposing teams haven’t been able to string hits together against Butler, but that tends to even out over time, especially considering the fact that Butler’s career LOB% is below league average. When you don’t strike guys out, the ground balls eventually find holes, the fly balls eventually leave the yard, and the walks start to come around to score.

To be fair, I have not seen footage of Eddie Butler pitching this year. He might be making guys look foolish, and he might be on the path to becoming the next king of soft contact; if you have watched him pitch first-hand this year, please feel free to share your observations. He does still have the pedigree and he seems to have the work ethic to go with it, and it would make an incredible story if he could put it all together.

After all, Eddie Butler is a professional baseball player, and I’m just a guy with some spreadsheets. But right now, the spreadsheets are telling me to seriously pump the brakes on the Arrieta comps – underneath the ERA, this still looks like the same Eddie Butler.


2016 Cubs Run Differential

In this post, I take a look at the 2016 Chicago Cubs though their first 100 games. I’ll start out by focusing on the Cubs’ run differential (Runs Scored – Runs Allowed). After a historic start, they reached their pinnacle after the 67th game of the year against the Pirates. At this point, the Cubs were 47-20 and had outscored opponents by 171 runs! Since then, the ball club is 13-20 and their current run differential is at +153.

Still, the Cubs’ +153 mark is 42 runs better than the next-closest team (Washington Nationals). The Cubs and Nationals are the only clubs to have a run differential that is greater than +100. The second-place Cardinals rank third in the league at +95 right now. While the Cubs dominate the top end of the spectrum, the Reds and Braves are running away with the worst run differentials in the league. The Reds have a -143 mark, largely due to the thrashings they have taken at the hands of the Cubs so far in 2016. The Braves have the second-to-worst differential at -134 runs.

Projected Runs to Wins

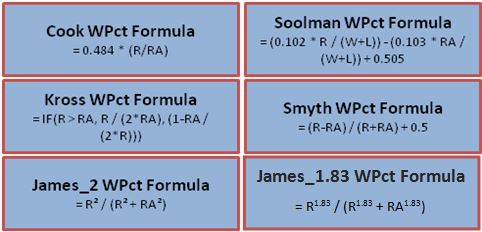
In another place, I introduced the “Pythagorean Theorem’s of Baseball” which basically tries to determine the number of games a team will win based on their number of runs scored and number of runs allowed. Here are the formulas for six of the most common win-percentage projection formulas:

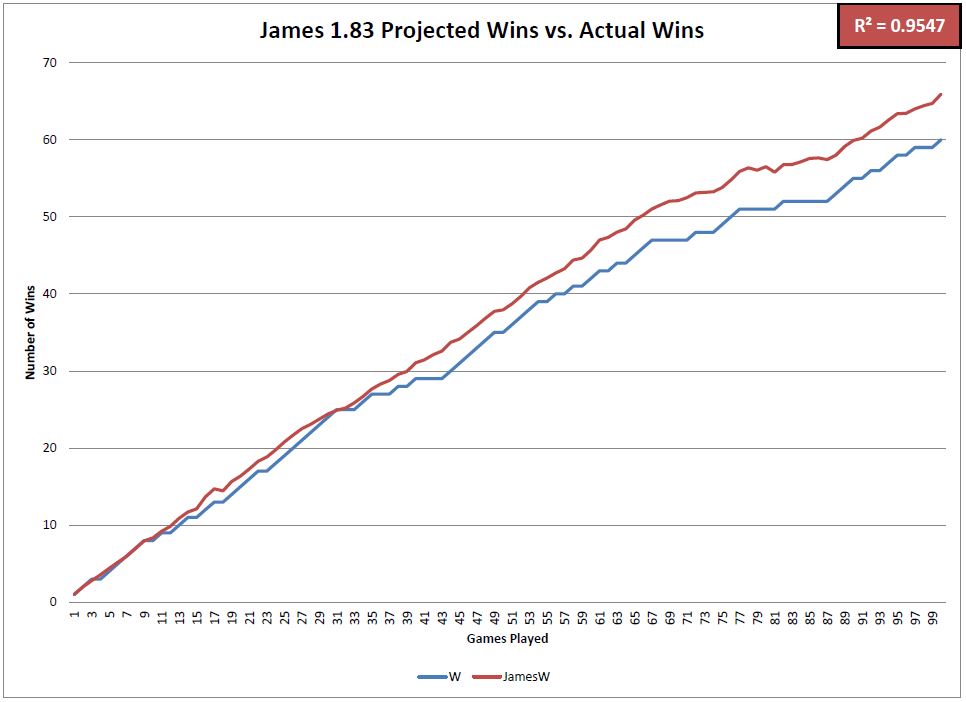
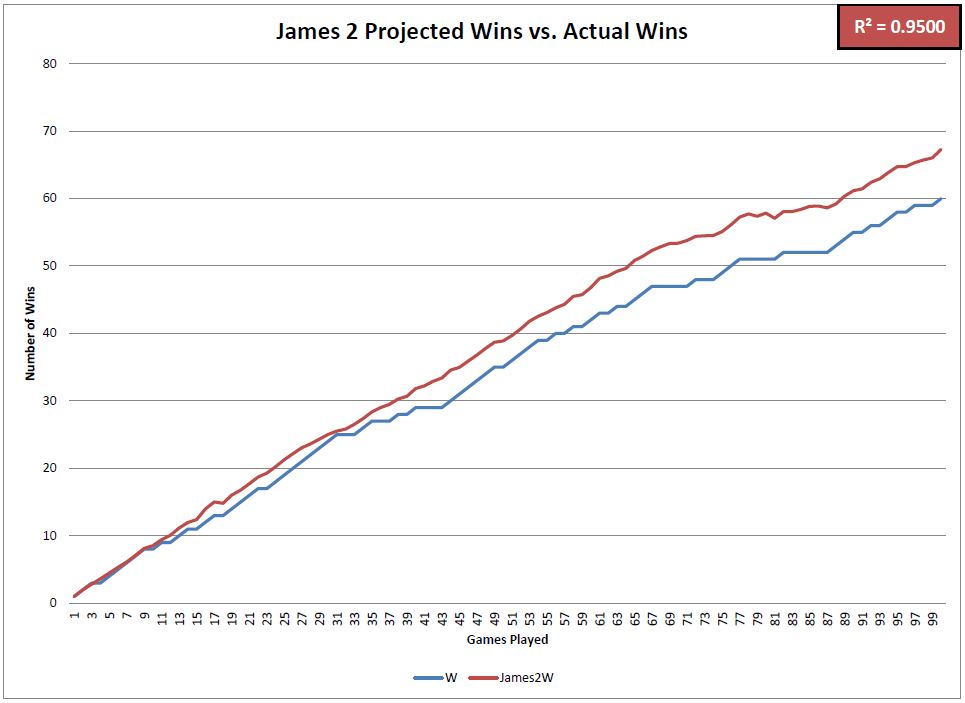
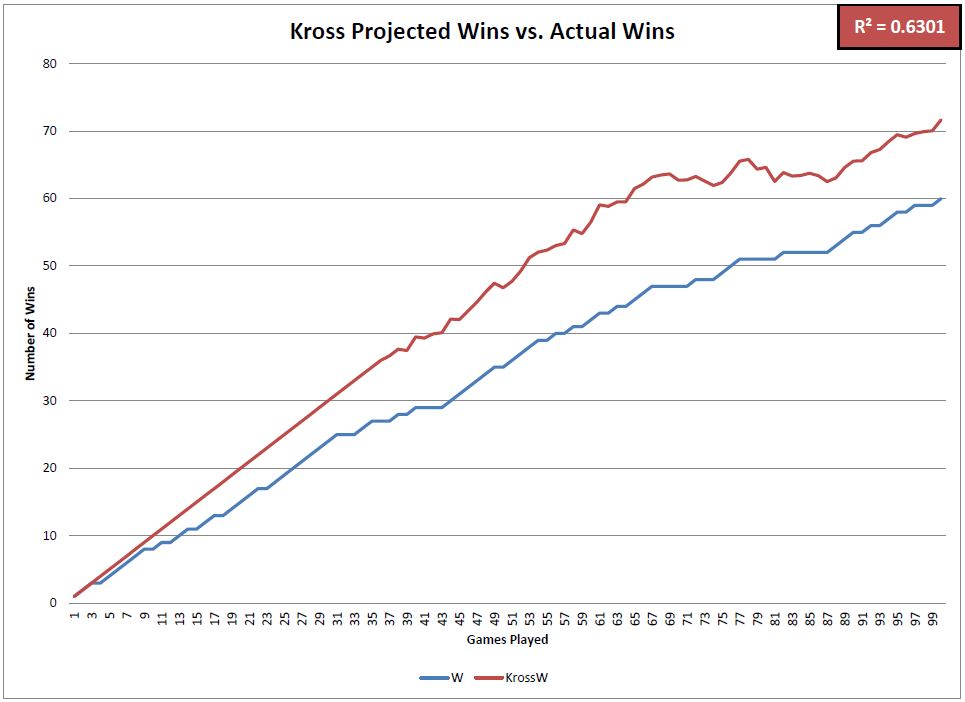
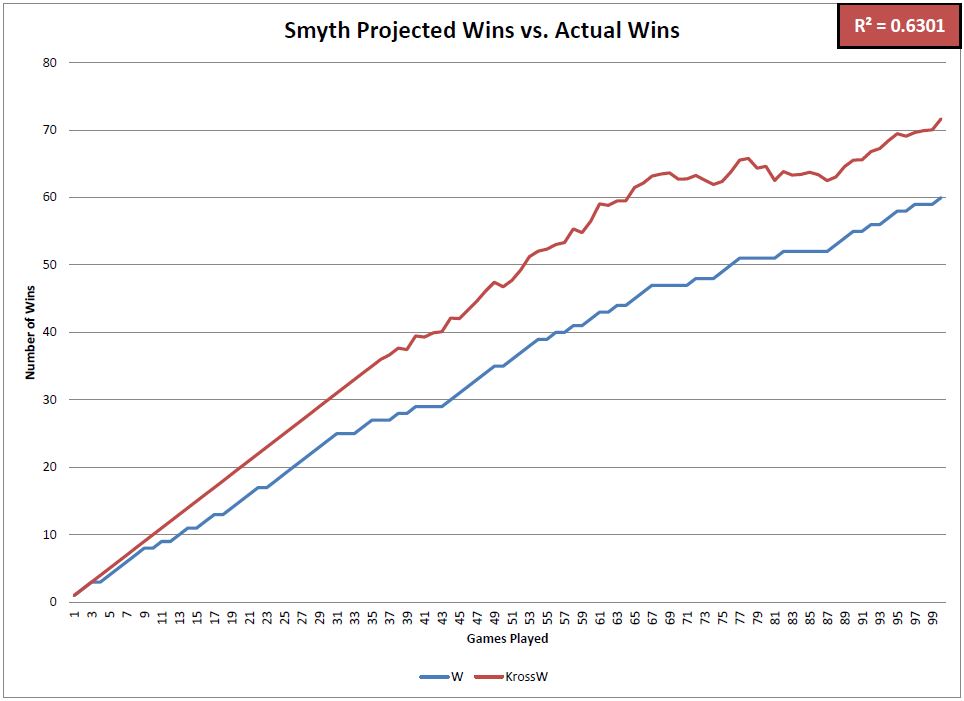
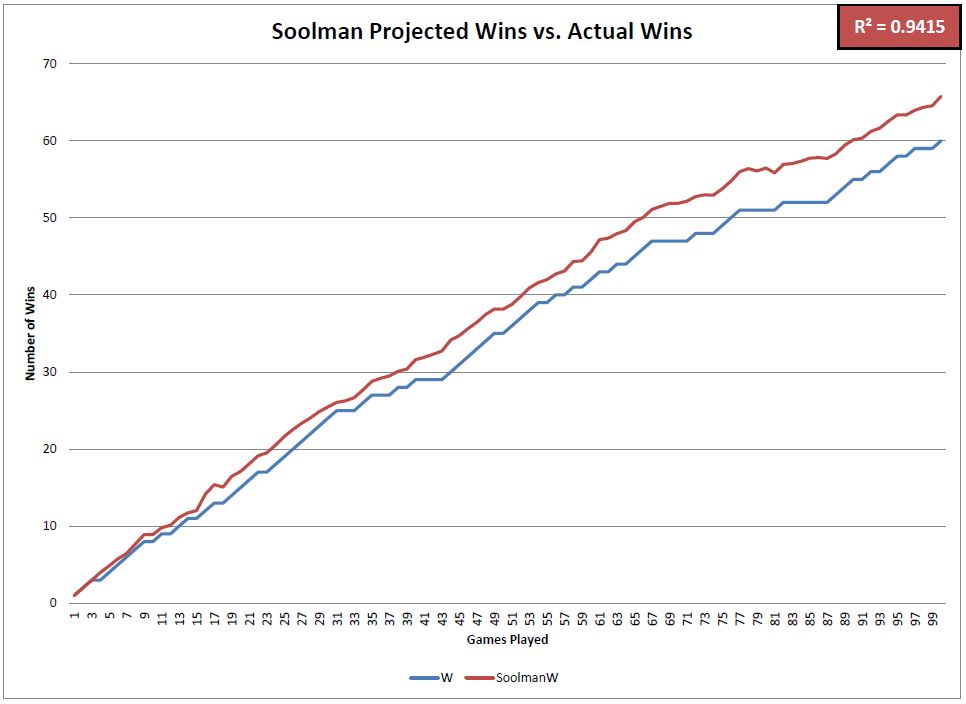
I added up the Cubs’ total runs scored and total runs allowed after each game this year and compared their actual number of wins to the projected number of wins based on each formula. These charts visualize the differences between those numbers.

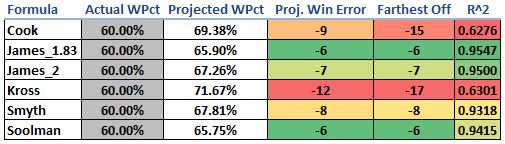
This matrix summarizes how accurate each of the projection formulas has been in predicting the Cubs’ winning percentage and total number of wins so far in 2016. The most accurate formulas was the James_1.83 followed by the James_2 and Soolman. Four of the six formulas were very good predictors, but the Cook and Kross formulas overforecasted the number of wins that they expected the Cubs to have. Notice that at one point this year, each of those formulas projected the Cubs to have over 15 more wins than they actually had. The R^2 value (coefficient of determination) is indicative of how well the projected win percentage matched up to the actual win percentage after each game this season.

All in all, the Cubs have should have at least six more wins this year based on these formulas. Scoring as many runs as they have (4th most in the MLB) and allowing as few runs as they have (T-1st in the MLB) should result in an even better record than 60-40. We knew it was unlikely that they would keep up their record-setting start in the run-differential category, but it will be interesting to see how these numbers match up as the season progresses.

@CubsAdvMetrics on Twitter


The Case For Jake Arrieta as the Most Dominant Pitcher of All Time

C.R.A.P.  It’s a fairly modern affliction that affects a great deal of people like you and me — and by ‘you and me’ I mean internet users.  It’s clear that the internet, like all of mankind’s greatest achievements, is not without drawbacks.  Never before have we been so connected, and never before have we heard the terms: Athazagoraphobia (Fear of missing out), ‘Paradox of Choice’, and ‘Intellectual Technologies’ (just Google it — because I can’t remember what it means).  The level of connectedness is so intense that on a day-to-day basis, I feel like I meet people whose personalities are plagiarized patchworks of charismatic, yet ill-informed internet voices (myself included).  And then, of course, there’s C.R.A.P., which stands for Combative Responses to Antipodal Posts.  An amusing component of C.R.A.P. is the ferocity with which contrary opinions are met with online; I have experienced 30 years of life and not once have I heard strangers communicate with each other in the manner that they do in the comments section of baseball blog posts on the internet.

To be clear, I’m not completely condemning the common vernacular found in said comments sections, because debate and conversation simply happen differently when we’re responding to a pun that’s a screen name rather than a face with eyes.  On Thursday, the 21st of April, Jeff Sullivan wrote a piece titled, The Case for Noah Syndergaard as Baseball’s Best Pitcher, and the comments section is littered with people who suffer from C.R.A.P.  In my opinion, if you actually read the article, you’d be able to tell that Jeff isn’t declaring Syndergaard the best pitcher, but based on his stuff and recent results, there’s definitely a case for it, hence the title.  Essentially, I think Jeff is saying that it’s possible Syndergaard is taking that step, and he’s open to the idea.  Jeff did a great job (as always, thank you, Jeff) as evidenced by reactions to the article.  He got us thinking and he got us discussing — some of us liked what Jeff had to say and some of us clearly weren’t receptive to the idea.  At all.  To his credit, Jeff did exactly what he’s supposed to do.

Now before we nosedive into the reasoning behind the outlandish title of this article, I want to get a few things out of the way: First and foremost, I’m sorry for throwing gasoline on an already raging fire.  Second, I think Clayton Kershaw is the best pitcher in baseball because of his sustained dominance (1.98 ERA over his last 1066.1 IP).  Certainly that doesn’t mean that pitchers can’t be better than Kershaw for a period of time, however, it’s just that while others rise and fall to his level, Kershaw remains.  And finally, I think Pedro Martinez is the best pitcher of all time.  That’s partly because I was born in 1985, and partly because I read it on the internet.  Mentioning Pedro is a good time to tie back into Jeff’s article.  To quote:

…Right now, in 2016, Syndergaard has a 23 ERA- and a 22 FIP-, through three starts…

Believe it or not, Kershaw has 37 three-start stretches with an ERA- no higher than 23. He has just seven three-start stretches with an FIP- no higher than 22. What Syndergaard is doing, Kershaw has done several times. But it’s not like this is Kershaw’s resting level. And Syndergaard is just as much about the scouting as he is about the stats.

That 23 ERA- just happens to be the number I was looking for.  During his peak (97 – 03), Pedro was preposterously good, posting a K-BB% of 26.1%, a 47 ERA-, and a 52 FIP-.  The acme of his peak came in a 22-game stretch spanning the 1999-2000 seasons when he posted an ERA- of 23 and an FIP- of 33.  His K-BB% was an unruly 34%, and he allowed just 95 hits in 168.1 IP.  Marvel at the overall line: 

August 3, 1999 – June 14, 2000

GS IP TBF H R ER HR BB K ERA WHIP FIP GSv2 K-BB% ERA- FIP-
22 168.1 635 95 25 21 7 31 247 1.12 0.75 1.51 84 34.0% 23 33

Again, that 23 ERA- is what I’m focusing on because it’s the number we saw in Mr. Sullivan’s article.  I could not find a better or equal stretch of dominance, based on ERA-, over 22 games, than Pedro’s going back to 1969…until Jake Arrieta.  Looking at only regular-season games, dating back to July 2nd of 2015, Arrieta has produced that magic 23 ERA- number we’re looking for:

July 2, 2015 – April 21, 2016

GS IP TBF H R ER HR BB K ERA WHIP FIP GSv2 K-BB% ERA- FIP-
22 162 590 84 19 16 4 31 159 0.89 0.71 2.12 75 21.7% 23 55

For those of you who prefer FIP I say leave your C.R.A.P. in the comments section, because as we gain more data, we learn that pitchers have some modicum of control over the quality of contact they allow, and at this point it’s probably safe to say that Jake Arrieta is a proven FIP-beater, even if he’s earned this title in less time than it takes others.  But Arrieta’s streak is now actually at 24 starts in the regular season, and two of those have been no-hitters.  His line:

June 21, 2015 – April 21, 2016

GS IP TBF H R ER HR BB K ERA WHIP FIP GSv2 K-BB% ERA- FIP-
24 178 647 91 20 17 4 33 173 0.86 0.70 2.09 76 21.6% 22 54

Pop the confetti!  Blow your vuvuzelas! Or Tweet!  That 22 ERA- is something we’ve never seen over such a large quantity of starts (at least going back to 1969 — and at least with my hack-job research)!

What this means in the scope of baseball’s long history isn’t nothing.  It’s a marvelous line.  Of course, it is just one number I’m looking at, and ERA-, like the internet, is not without flaws.  It’s arguable and perhaps even likely that Pedro’s line, with that 34.0% K-BB%, is more impressive (that mark was 293% better than league average — lolz).  But Arrieta has two no-hitters.  However, if we look at quality of opponents, well, Pedro’s line becomes more impressive because the teams he squared off against combined for an average wRC+ of 102, whereas Arrieta’s opponents averaged 94 wRC+.

Dave Cameron wrote an article about Arrieta’s ability to control the quality of contact he allows, and as we learn more about this skill, perhaps we’ll revere it a little more — never as much as strikeouts, but definitely more than we do now.  One of Jeff’s points about Syndergaard is that he undoubtedly has the arsenal and command to become the game’s top arm.  Arrieta has legit weaponry as well, but I don’t think anything we’ve ever seen from a starter matches what Syndergaard is throwing.  We know Arrieta’s story up to this point, which makes his sudden-ish ascent to a level where he can put a streak together like the one he’s on more interesting, if not more impressive.  What he does from now until the end of his career will go a long way in determining the weight this current streak holds.  If he flames out, or loses his ability to induce weak contact, it will be seen as a lucky blip; but if he rallies off another few years of 5 – 8 WARs and 50 ERA-es, then we’ll feel better about objectively putting his streak into an historical perspective.  As of right now, even despite his current run, I’m nowhere near putting Arrieta’s name in with the all-time greats (yes, the title was click-bait, spare me the C.R.A.P.), but, like Jeff in regards to how he feels about Syndergaard, but to a lesser extent, I’m open to it.  And that’s about as far as it goes for me — but I’m so contented to sit here and watch the debate unfold, violently, online.


Why the Chicago Cubs Should Keep Starlin Castro

Ever since the Cubs acquired top shortstop prospect Addison Russell from the Oakland Athletics in the Jeff Samardzija and Jason Hammel deal people began to speculate that Starlin Castro’s time in Chicago may be coming to a close sooner rather than later. Castro’s name began to pop up in trade rumors all the time, Castro to the Mets, Castro to Seattle etc… but Cubs President Theo Epstein and General Manager Jed Hoyer told teams that Castro wasn’t going anywhere. With all the middle infield talent the Cubs have people see Castro as the odd man out. The front office repeated their message about Castro being their guy early in the offseason by saying “ Starlin is our shortstop in 2015.” I know a lot of people expect Castro to be traded at some point, but I’ll go over why I think they should keep the three-time All-Star, and how he’s becoming a better player.

Contract

First off Castro is still young currently 24 years old (he’ll turn 25 in spring training). Castro also has a team friendly deal at 7yr/$61M with an option for the 2020 season. This contract averages out to $8.7M each year, although the contract is back loaded, but still an average of $8.7M is a bargain for a premium position in today’s MLB market.

 Year  Age  Salary
2015 25 $6,857,143
2016 26 $7,857,143
2017 27 $9,857,143
2018 28 $10,857,143
2019 29 $11,857,143
2020 30 $16,000,000 (Team Option) $1M Buyout

Lets compare Starlin’s contract to another young shortstop, Elvis Andrus of the Texas Rangers. Andrus signed an 8yr/$120M contract with the Rangers.

Year Age Salary
2015 26 $15,000,000
2016 27 $15,000,000
2017 28 $15,00,000
2018 29 $15,000,000
2019 30 $15,000,000
2020 31 $15,000,000
2021 32 $14,000,000
2022 33 $14,000,000
2023 34 $15,000,000 (Vesting Option)


As you can see Andrus is due significantly more money than Castro. Compared to Andrus’ contract Castro’s seems like a bargain. But the real question is who is the better player, and is Andrus worth $60M more than Castro? Lets look at each player’s career numbers.

Andrus has posted of career line of (.272/.335/.345) with an OPS of .680, 20 points lower than league average. He has totaled 20 home runs in 6 seasons. Castro has a career line of (.284/.325/.410) with an OPS of .735, 35 points higher than league average. Starlin has clubbed 51 career home runs in one fewer year than Andrus. By comparing these two players numbers and contracts you can clearly see that the Cubs are getting a great deal on Castro. Castro not only makes far less than Andrus he is a superior offensive player, and is also younger with more upside. I believe that Castro’s contract could become more of a steal if Castro becomes a better player, which he is starting to show signs of. Lets go over how Castro is starting to become better in all facets of the game.

Improving Power

Castro totaled 14 home runs in 2014 tying his career high set back in the 2012 season. Starlin would have easily set a new career high if not for an ankle injury that cost him most of September. Despite missing almost 30 games Castro still put up a career high SLG% of .438 besting his 2011 season SLG% of .432. Keep in mind that is the season where Castro hit .307 and had over 200 hits so therefore his slugging percentage was based more on singles and triples and fewer long balls.

One reason for Castro’s improving power is that he is starting to hit more fly balls, and those fly balls are starting to leave the ballpark. In 2010 when Starlin got called up as a 20 year old he looked like a 16 year old due to his lean frame. Castro hit only 3 home runs that year and was mainly a singles hitter when he first started his career. In 2010 Castro’s groundball percentage (GB%) was 51.3% and his fly ball percentage (FB%) was 29.2%, this equaled a groundball to fly ball ratio (GB/FB) of 1.76. Castro’s home run to fly ball ratio (HR/FB) in 2010 was only 2.6%, which ranked 19th out of 22 qualified shortstops. As you can see when Starlin first came up he was a singles hitter who mainly hit the ball on the ground, which isn’t a bad thing, and when he did elevate the ball it rarely left the yard.

Let’s look at these same numbers in 2014. His GB% dropped to 45.3% and his FB% rose to 32.3%, which equaled a GB/FB ratio of 1.40. Now where the biggest change happened is in his HR/FB ratio — it skyrocketed to 10.1%. This means 1 out of every 10 fly balls that Starlin hit traveled over the wall for a homer. His increased HR/FB ratio brought him to 4th among qualified shortstops in HR/FB ratio, which is a huge improvement over his rookie season.

With more fly balls from Castro you’ll see more of this…

and this…

and this…

Not only is Castro hitting more home runs; he is hitting more impressive home runs like these above. Watching Castro’s 2014 season I found myself saying, “wow that was far” on more of his home runs than ever before in previous seasons.

For these reasons above I believe that Castro is poised to show even more power in the coming seasons due to his increased FB% as well as his vastly improved HR/FB ratio.

Improving Defense

Lets take a look at Castro’s fielding numbers from the beginning of his career until now.

Year Errors Fielding Percentage (FP%) FP% Change
2010 27 .950 N/A
2011 29 .961 +11
2012 27 .964 +3
2013 22 .967 +3
2014 15 .973 +6

When Starlin came up in 2010, defense was the biggest weakness of his game by far. In 2010 he committed 27 errors in 123 games, which ranked as the 2nd most in the MLB that year. His FP% of .950, was 2nd to last among qualified shortstops in 2010. In 2011 Castro committed 29 errors, which was the most in the majors that year, although he still ranked last in FP% among shortstops, his FP% rose by 11 points. In 2012 Castro tied for the major league lead in errors at 27. 2013 was more of the same tying for the second most errors in the majors, but in 2014 we saw a great improvement by his committing only 15 errors. This improvement is Starlin’s fielding brought him towards the middle of the pack in FP% among shortstops. Castro even had a 38-game errorless streak in 2014 as well, showing that he has gotten over his problem of making the routine throw to first.

Although the metrics are down on Castro as a defender, I see Castro get to balls that he has no business getting to. For example Castro is one of the best shortstops at making plays on bloopers and shallow fly balls, like this for example.

Castro has great range on balls hit over his head. Not only can he make the plays in shallow left and center field, he covers a lot of ground moving laterally and is quickly able to get to his feet and unleash a strong throw, like this for example.

As you can see Castro is improving his defensive game year by year and there is no evidence to suggest that he can’t get any better in 2015 as well. This is just one of the many ways that Castro is steadily improving his overall game.

Comparing Castro to Other Shortstops

As offensive numbers are down in recent years, finding a premium offensive shortstop is a hard thing to do. Lets see how Castro stacks up compared to other shortstops around the league in 2014.

Among qualified shortstops Castro led all of them in batting average at .292, He was 2nd in OBP at .339, and 3rd in SLG at .438. I’ll take a guy any day of the week that ranks in the top three of those categories among his position. Castro also ranked sixth in line drive percentage at 22.3% (which beat his previous career high by 2%), trailing the leader by only 2%. Castro also ranked first in batting average on balls in play (BABIP); these two categories combined shows that he is putting the ball in play and hitting the ball hard all over the field, which will generate a good average as well as power. Another stat where Castro is ranked in the top three among shortstops is wRC+; his wRC+ was 115, 15 points over league average, good enough for third among shortstops.

One knock on Castro in his career is that he doesn’t walk enough, but looking at the shortstop position as a whole no one is posting a staggering OBP (Except for Troy Tulowitzki, who is in another league compared to every other shortstop, but he can’t stay healthy). Therefore Castro’s .339 OBP is extremely good for a shortstop in the game today. I think people need to compare players to others playing that same position, because if you look at Castro’s numbers compared to other shortstops Starlin is clearly a top three shortstop in the game offensively.

What Do You Do With All These Shortstops?

Some people see the Cubs’ surplus of shortstops as a problem, but I see it as a good problem to have. Normally your shortstop is your most athletic player and covers the most ground, so why not have three of them in the infield? I think if the Cubs fielded and infield of Castro, Javier Baez, and Addison Russell, that infield would gobble up every groundball. Whether Castro sticks at short or if Russell comes up and becomes the shortstop that everyone thinks he will be, the Cubs could have a huge defensive advantage by playing three shortstops in the IF.

Playing three shortstops in the IF would shift Kris Bryant, who will be an average defensive 3B at best, to the outfield where his defense wouldn’t be as much of a concern. Bryant in LF would fill the one spot where the Cubs don’t have a top prospect. This would mean you would have a top prospect at every position in the future. For example C: Kyle Schwarber (if he can stick at C), 1B: All-Star Anthony Rizzo, a combination of Baez, Castro, and Russell all fitting at 2B, 3B, and SS (future positions TBD), LF: Bryant, CF: Albert Almora or Arismendy Alcantara (Alcantara could become super utility as well, a Ben Zobrist role), RF: Jorge Soler. I don’t know about you but a lineup filled with all those top prospects and all that power excites the heck out of me.

Overall I think Starlin Castro is severely under-appreciated not only by the MLB, but also by Cubs fans. Castro has improved in many areas, and I believe that he is among the top three shortstops in the game. Castro is starting to show that he has more power in that bat with an increased FB% and in his FB/HR ratio. Keeping Starlin Castro as well as all of the other shortstops could be very beneficial for the Cubs.


The Resurgence of Jon Lester: How a Small Mechanical Change Brought Back a Pitch that Earned Millions

Jon Lester just got paid. Early Wednesday morning, it was announced that Jon Lester accepted a 6-year $155M contract with a vesting option for a 7th year to become a member of the Chicago Cubs. This is over $20M more than the FanGraphs readers predicted in the offseason free agent crowdsourcing. This is the same pitcher that the Red Sox offered a 4-year $70M extension to prior to the season and proceed to nearly double their offer to $135M in the off-season. Before 2014, it was reasonable to think Jon Lester might be looking at a deal similar to the 5 years $90-95M that has been predicted for James Shields. What did Lester do to convince teams he is closer to a $200M pitcher than a $100M pitcher? He looked like the elite Lester we saw in 2009-2010, and not the merely very good pitcher he was in the past few years. How did he improve in his contract year? Let’s take a look.

Jon Lester fWAR/Season fWAR rank FIP FIP rank K% K% rank Contact % Contact% Rank
2009-2010 5.8 9th 3.14 10th 26.4% 2nd 76.1% 7th
2011-2013 3.6 16th 3.84 60th 20.4% 48th 80.9% 68th
2014 6.1 6th 2.80 9th 24.9% 12th 78.6% 29th


Lester was one of the top pitchers in the game during the 2009 and 2010 seasons, and even placed 4th in AL Cy Young voting in 2010. His peers were Felix Hernandez and Adam Wainwright, along with Lincecum and Sabathia (before they became husks of their former selves on the mound). While WAR still treated Lester well in 2011-2013, partially due to the sheer number of IP and park and league statistical adjustments, his FIP placed him in the leagues of Kyle Lohse, Homer Bailey, Yovani Gallardo and Ian Kennedy. During that period, Lester’s opponent contact rate and swinging-strike rate were the same as those of Clay Buchholz. So comparing a theoretical Lester deal to the Bailey extension, which was looked at as an overpay by some, didn’t seem unfair. From 2011-2013, Lester trailed Shields by over 2 WAR, so a similar contract didn’t seem unfair prior to 2014.

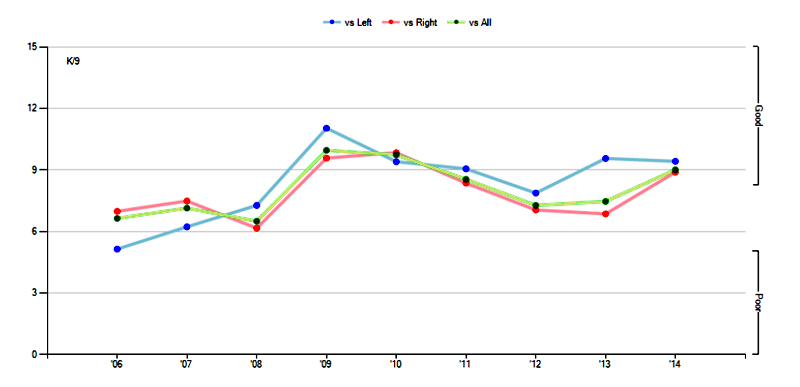
What caused Lester to fall from the ranks of the elite and become more of a number-two starter? The strikeouts disappeared.

800x387xlester-l-r.png.pagespeed.ic.p9Ej

800x394xlester-k9.png.pagespeed.ic.-Zrox
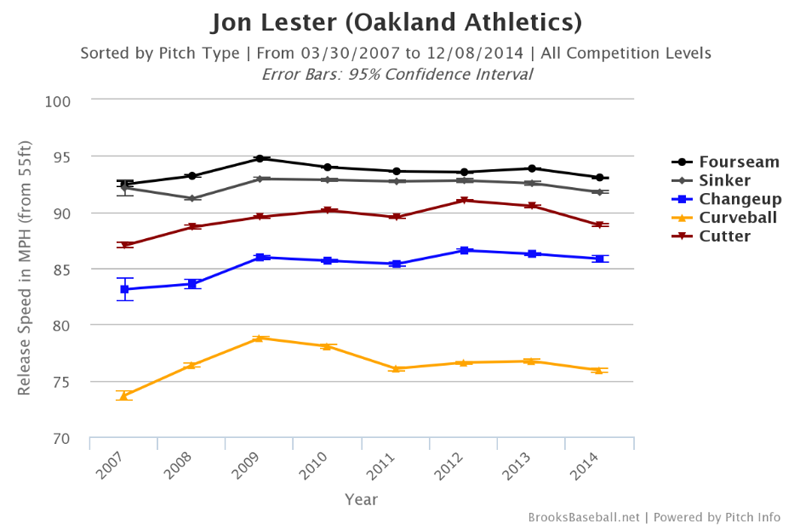
The problem was especially apparent against righties, whom he struck out at only a 17.9% clip in 2013 (compared to 26.3% in 2010). What caused this decline? Let’s take a quick look at the Pitch F/X data. A lot of people are under impression that the decline was due to velocity loss that occurs with aging. This isn’t really the case for Lester. Lester’s fastball velocity has declined by less than one mile per hour, from 94 MPH in 2010 to 93.2 MPH in 2014. While the cutter and curveball have lost velocity, they aren’t as dependent on velocity as the fastball:

800x529xlester-pitch-type.png.pagespeed.
If we take a look at his pitch usage, we notice two things: He has for the most part ditched the sinker and changeup in favor of the fastball, cutter, curveball combination that our Matt Trueblood detailed in his recent piece.

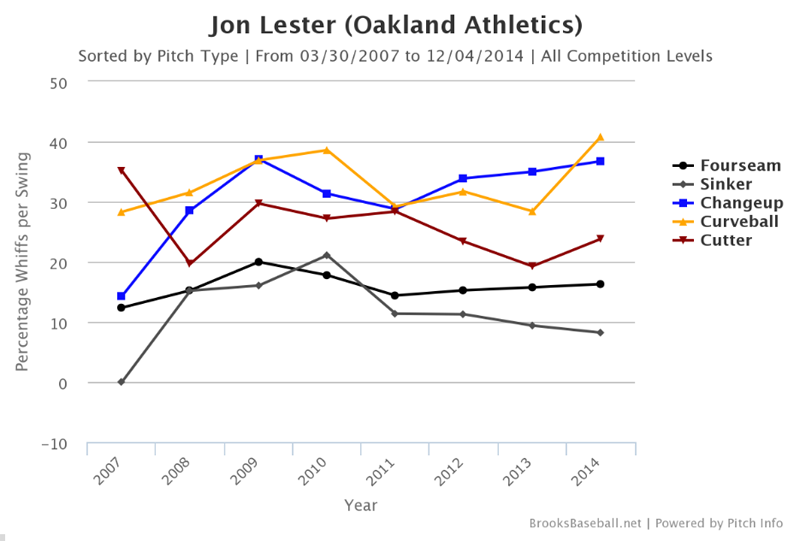
Let’s take a look for the most telling data for any pitcher: the ability to get hitters to swing and miss.

800x541xlester-whiff.png.pagespeed.ic.Br

Lester’s fastball generated whiffs on 16.3 percent of all swings in 2014, his best mark since 17.8 percent in 2010. That is around the league average of 16.4 percent, according to Eno Sarris’s benchmarks. The cutter, which he is throwing at a career-high frequency of 31.0% of all his pitches, is generating a whiff-per-swing rate of 23.8 percent (5th in MLB, minimum 500 pitches thrown), above the league average of 21.4%. The pitch isn’t as good as it used to be, when it generated whiffs on over 28 percent of swings, for reasons Sarris detailed last year. However, it’s still a very good pitch that was even better in 2014 due to improvements in the horizontal movement.

The curveball, though, is what’s special. In 2014, Lester’s curveball generated whiffs-per-swing on 40.8 percent of opponents’ swings, the highest mark of his career—and 12 percentage points more than in 2013, when his curveball was league-average in that regard. In 2014, It was the best curveball in the league in terms of whiffs per swing, with pitchers like A.J. Burnett, Adam Wainwright and Sonny Gray behind him.

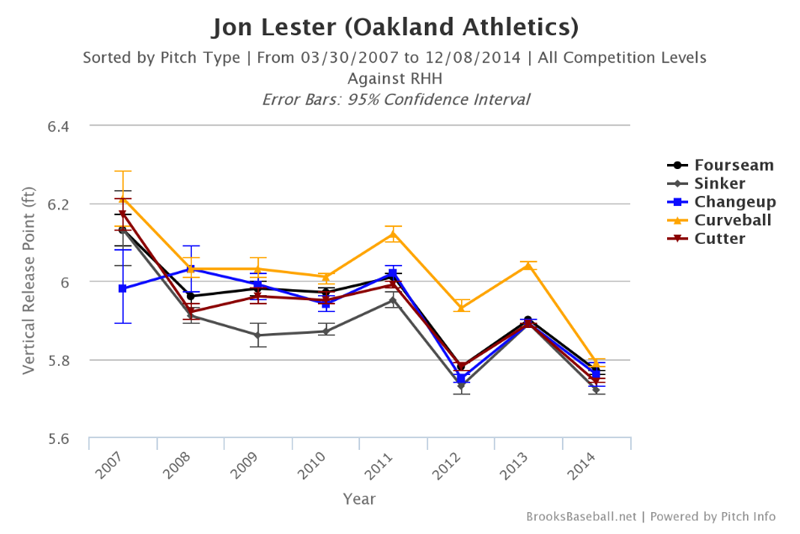
Now what happened to the curveball? It didn’t gain velocity. It didn’t gain movement. It gained a more consistent vertical release point. Look at 2014. Lester changed his release point on all pitches, but as you can see, the release points of the fastball, cutter, and curveball are tightly grouped together. Now look at 2009 and 2010, and compare it to 2011-2013. It appears that in his “peak years,” Lester maintained a better-disguised release point on the curve than he did in 2011-2013.

If the curveball was being tipped or was less deceptive, righties would have the best look at it.  Let’s check that out:

800x534xlester-release.png.pagespeed.ic.

nAa3HGr.png


NqtDfGc.png

There is something incredibly satisfying in finding the results we might expect. The curveball generated 41.4% Whiffs/Swing vs. righties compared to the 25.8% in 2013. Lester’s Curveball caused 25 Ks against righties, 6th in baseball compared to 2014 when it only caused 6. This is exceptional because he only generated 55 whiffs on the CB vs. RHH. When righties do make contact, they aren’t hitting it hard, only slugging .151 against the hook last year, compared to .338 in 2013. Righties aren’t picking up the curveball like they were before, and in 2014, that solved the platoon issues he had against them in previous years. Trueblood said, “Lester might have tapped into something that will allow him to dominate right-handed batters in the future.” That something is the curveball. It allowed him to ditch his changeup with little consequence.

The gist is that 2014 Jon Lester was more like 2009-2010 Jon Lester than 2011-2013 Jon Lester. A mechanical adjustment allowed the curveball to reemerge as an elite weapon in Lester’s arsenal, complementing a very good cutter and an above average fastball. It also allowed him to enjoy success versus righties again. The question is: How sustainable is this change? If Lester can lose his mechanics for years, is there serious risk of him losing them again? Can he continue to improve? If he can bring the curveball back to its former glory, can he regain a bit more movement on the cutter again? Can he bring back an effective sinker, giving him a deeper arsenal? These are the questions on which the Cubs will be betting $155 million on. If these changes can be sustained, it wouldn’t be surprising if Lester is worth the contract barring injury. Just one 5 WAR season can be worth $40M on this market. Lester made a slight change to his mechanics and it just might have earned him tens of millions of dollars.


What the Cubs Need to Do to Be Successful

The Chicago Cubs have gotten off to a very slow start in the 2013-14 season scoring a total of 9 runs in their first 5 games and as a result of that they are 1-4. The buzz around the city of Chicago is all about the excitement of top prospects Javier Baez, Albert Almora, and Kris Bryant tearing up minor league pitching and rapidly moving up in the Cubs System. All of these players have fantastic stats but the stats don’t truly matter until these players can be productive big league players. The problem is is that these prospects have shown day in and day out that they are ready to move on to the bigs. Almora, might not be quite there yet but Baez and Bryant have proven they are by dominating minor league pitching and posting good spring training numbers. Cubs GM Theo Epstein won’t pull the trigger on sending these guys up. Bringing these players up will significantly improve the quality of the team but many more changes will need to take place in order for the Cubs to be a team to win games on a consistent basis. Here are 3 other things that need to happen for the cubs to start their path to being successful

1. The cubs need to find a reliable, all-around, everyday 2nd baseman. There are many different solutions the their problem at 2nd but first let’s establish what the problem is. Darwin Barney has proven that he is an excellent fielding 2nd baseman but he is an absolutely horrendous hitter. In 2013, Barney posted an atrocious slash line of .208/.266/.303. Not only does this show that he rarely gets hits or gets on base, but when he does it’s mostly because singles. The Cubs have many possible solutions to this problem. One possible solution is to bring up Javier Baez and play him at short and Starlin Castro at 2nd or vice versa. Doing this might slightly weaken the 2nd base spot defensively, but drastically improve it offensively. With the Cubs pitching being surprisingly good in the first few games of 2014, their offense is a glaring problem and Baez would improve it instantaneously.

Another solution would be to slide Luis Valbuena over to 2nd and make Mike Olt the everyday 3rd baseman. Currently, Olt and Valbuena are splitting time at third which is detrimental to the team because both players have shown offensive value to the cubs. Valbuena had an excellent eye and has proven to be adept at drawing walks. He also has shown solid power as he hit 12 homeruns in 108 games in 2013. Olt has also shown the ability to hit for power as he had 5 homeruns in a very good spring training that earned him a spot on the opening day roster. Either of these solutions would be a much better fit for the Cubs then having Barney as the everyday 2nd baseman.

2. If the Cubs want to be good now, their bullpen needs to be consistent, and deeper. The bullpen has been a problem for the Cubs for a very long time. However in 2014 they might show some signs of improvement. In 2013, reliever Pedro Strop Posted a solid 2.83 ERA in 35 innings with the Cubs. In his time in Chicago, he only gave up 11 earned runs, 5 of which were in one performance. Along with solid numbers Strop possesses a 97 MPH power sinker in addition to his best pitch which is his slider. Strop will be put into a much bigger role this season and if the cubs want to succeed he will need to continue to pitch at a high level. In the offseason the cubs also signed lefty Wesley Wright and Jose Veras who in recent history have proven themselves as reliable bullpen options to their clubs. Players like Brian Schlitter and Hector Rondon will also need to step up for the Cubs. If Strop can continue pitching at a high level and the rest of the pen can consistently pitch in late innings. The Cubs will improve as a team very much.

3. Lastly if the Cubs want to succeed Anthony Rizzo and Starlin Castro must have bounce back years. There are many things that I could criticize about these 2 players but there a few problems in their games that are in the most need of fixing. In 2013 Rizzo only hit .233 if Rizzo continues to hit in the heart of the cubs line up, a .233 average is unacceptable. If he was hitting 50 homeruns it might be a different story but .233 with only 23 HRs isn’t going to cut it. In order for the Cubs to succeed, Rizzo will either need to hit 10-15 more homers or improve is average by around 30 points.

Starlin Castro is a much bigger problem for the Cubs. Spending most of the season in the 3 spot, Castro posted a weak slash of .245/.284/.347. Castro’s numbers were only a bit better than Barney’s which makes him a big problem. In addition to his poor offensive play, Castro has been an extremely inconsistent defensive SS his entire career. There is optimism for Castro though. In Castro’s first 2 full big league seasons, he was voted to the All-Star Game and hit close to .300 in both of those seasons. Castro has shown in his career that he has the ability to hit, the question. is will he be able to have seasons reminiscent to his all-star years. Only time will tell for Castro but if he can bounce back along with Rizzo the Cubs might actually be a legitimate team.

Although many things need to happen for the Cubs to be a playoff contender, fans should be optimistic for the future. With a farm system fortified with elite prospects throughout and an improving bullpen, the cubs need their “key players” to perform at a higher level. If all of these things can happen, there might be October baseball played at Wrigley sometime in the near future.


Expected RBI Totals: The Top 267 xRBI Totals for 2013

While there is almost zero skill when it comes to the amount of RBI a player produces, through the creation of an expected RBI metric I have found a way to look at whether or not a player has gotten lucky or unfortunate when it comes to their actual RBI total.

I hope I don’t need to do this for most of our readers, because it’s 2014 and you’re reading about baseball on a far off corner of Internet, so you obviously are more informed than the average fan who consumes ESPN as their main source of baseball information, but lets talk about why RBI, as a stat, and why it is not valuable when you look at a players’ talent. The amount of RBI a player produces are almost—we’ll get into the almost a little later—entirely dependent on the lineup a player plays in. If a player doesn’t have teammates that can get on base in front of them in the lineup, there aren’t very many opportunities for RBIs; that’s the long and short. Really, RBI tell more about the lineup a player plays in than the player himself.

Intuitively, this makes sense.  The more runners there are on base, the more chances the batter will have for RBI, and the more RBI the batter will accumulate. When I said, “The amount of RBI a player produces are almost…entirely dependent on the lineup a player plays in”, lets be a little more precise. My research took the last three years of data (2010 to 2013) and looked at all players that had 180 runners on base (ROB) during their at bats over the course of a season. Over the three seasons, which should be enough data—it was a pain in the ass to obtain the data that I did find—ROB correlated with RBI by a correlation coefficient of .794 (r2 = .63169), which is a very strong positive relationship.

But hey, that doesn’t mean that you can be a lousy hitter get a lot of RBI. That would be like if you threw a hobo in the Playboy Mansion and expected him to get a lot of tail; all the opportunity in the world can’t mask the smell of Pall Malls, grain alcohol and a lifetime of deflected introspection; trust me, I worked at a liquor store for three years in college, and I know.  In the same sample of players from 2010 to 2013 as used above, the correlation between wOBA—what we’ll use here to define a player’s ability at the plate—and RBI is .6555. So there is a relationship between a player’s ability and their RBI total, but nowhere near as strong as the relationship between their RBI total and their opportunity—ROB.

However, when we combine a player’s opportunity—ROB—with their talent—wOBA—we should get a good idea of what to expect for a hitter’s RBI total. Here is the formula for the expected RBI totals based on the correlations between ROB and wOBA, and RBI: xRBI =- 85.0997 + 262.7424 * wOBA + 0.1918 * ROB.

When you combine wOBA and ROB into this formula you end up with a correlation coefficient of .878 and an r2 of .771. Wooooo (Ric Flair voice)!!!!!  With the addition of wOBA to ROB we increase our r2, from .63 with just ROB, by fourteen percent.

2013 Expected RBI Leaders

Click Here to See xRBI Leaderboard

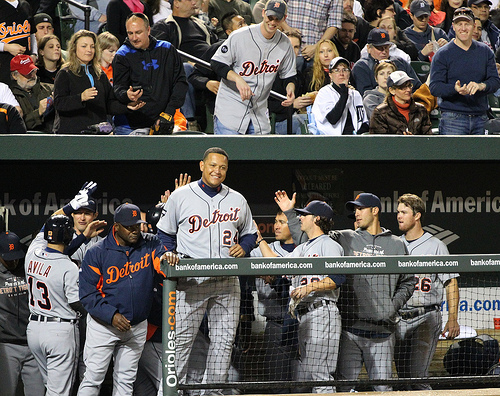
Miguel Cabrera
Photo by: Keith Allison

Let’s think about why Chris Davis’ xRBI is so much lower than his 2013 actual RBI total.

Davis had 396 runners on base while he batted in 2013, which is 140 ROB less than Prince Fielder who led the league with 536 ROB; Davis’ opportunity was limited.

Davis’ RBI total was considerably higher than what his opportunity would suggest his RBI total should be, and one of the reasons that he outperformed his xRBI total by so much was because of the amount of home runs he hit. Davis, or any batter, doesn’t need a runner on base to get an RBI when he hits a home run. But beyond home runs there is another reason why Davis and other batters outperform their xRBI totals: luck.

Hitting with runners on base is not a skill. A batter has the same probability, regardless of the base/out state, of a hit. Lets forget pitcher handedness and Davis’ platoon splits at the moment. With a runner on second base and two outs Chris Davis will get a hit .272 (27%) of the time—I averaged his Steamer and Oliver projections for 2014 together. Davis, and Alfonso Soriano for that matter, who was the only player to outperform his xRBI by more than Davis in 2013, was lucky and happened to have runners on base the majority of the 28.6%—Davis’ 2013 batting average—of the time he got a hit in 2013.

To put Davis’ 2013 136 RBI season into perspective, in the last five seasons there have been eight players to record 130 or more RBI in a season. Of those eight players, only two—Ryan Howard (2008-9) and Miguel Cabrera (2012-13)—were able to duplicate the performance the following year.

While the combination of ROB and wOBA has allowed us come up with a reliable xRBI, the next step, to increase the reliability of xRBI and account for players who produce a large amount of their RBI from home runs (i.e. Davis), is to include a power component in xRBI: HR/FB ratio.

Follow Me on TwitterDevin Jordan is obsessed with statistical analysis, non-fiction literature, and electronic music. If you enjoyed reading him, follow him on Twitter @devinjjordan.