Peter Buck [R.E.M.] (Guitars, Bass, Banjo, Washington Senators)
Mike Mills [R.E.M.] (Bass, Vocals, Atlanta Braves)
The Baseball Project started when McCaughey and Wynn met and discovered a mutual love of The National Pastime sometime around 1992. It wasn’t until 2007 that the pair sat down to write and records songs. “We don’t have any rules about what constitutes a baseball song,” McCaughey explains on the band’s website. “It can be anything from a character study of an obscure guy from the 1920s, to something that just happened, to something completely ridiculous like Extra Inning of Love, which takes the baseball-as-love metaphor and tries to stretch it as far as it will go. They can be fictional songs or non-fictional songs. The great thing with baseball is, we’ll never run out of things to write about!”
The Baseball Project has released three albums, performed The Star-Spangled Banner and Take Me Out to the Ballgame at numerous ballparks, and recorded the theme song for Adult Swim’s animated series Squidbillies in 2013.
Their songs are endlessly catchy and often dense with baseball references. Here’s one of their best, with 30 footnotes to fill in any backstory you may not already know. Read the rest of this entry »
Amid the snaillike pace of the free agent and trade market this offseason, the argument that MLB owners are in collusion against the players does not hold water. It is, instead, the player’s failure to recognize the swing of the pendulum, and to fight back with some creativity in their thinking.
Owners throughout all of MLB, whether they operate in large or small markets have (finally) figured out they’ve been overpaying players at the top of the wage scale for more than a decade. Correction, the nerds with the analytical skills have figured it out for them, and they’re serving it up to owners on a silver platter.
Of all the stats out there today, the most powerful one is Wins Above Replacement, commonly known as WAR. WAR is a number arrived at utilizing a complicated algorithm which boils a player down to how many wins he represents his team if the team had to replace him.
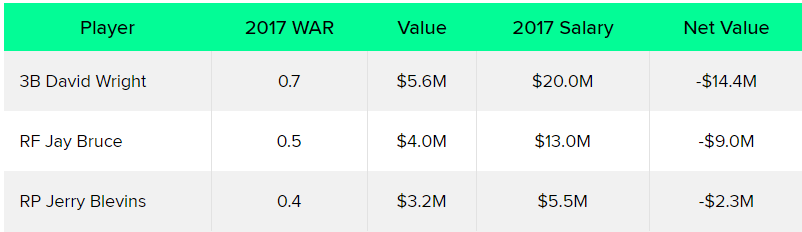
Writing for Bleacher Report, Joel Reuter put together an impressive coalition of stats to demonstrate what he calls a player’s “Net Value,” which is derived from the player’s WAR value (1.0 = $8 million in salary (see FanGraphs), minus the player’s actual salary. Here’s an example of how a few of the Yankees and Mets rated in 2017.
New York Yankees Best
Joel Reuter, Bleacher Report
New York Mets Best
Joel Reuter, Bleacher Report
New York Yankees Worst
Joel Reuter, Bleacher Report
New York Mets Worst
Joel Reuter, Bleacher Report
Now, let’s take Reuter’s accounting one step further. If we total up the Net Values on the plus side benefiting the owners, the Yankees “saved” $43.7 million last season and the Mets saved $48.4 million. On the negative side where the owners took a hit, the Yankees “lost” a total of $28.8 million on those three players and the Mets $25.7 million.
Which, in sum, seems to show that owners are not taking as big a bath as they would like us to believe. And further, that it’s possible players are being underpaid instead of overpaid. To draw any firm conclusions, though, a comprehensive study encompassing the entire payroll of both the Yankees and Mets would need to be executed, which is something the Major League Player’s Association might want to tackle in making their case to MLB and the public.
My thinking is drawn more to the number of years in contracts rather than the money per year that concerns owners and general managers throughout MLB. Giancarlo Stanton, as an example, will likely be worth every penny he is paid – until he reaches a point when he isn’t. At that point, Stanton will become a reincarnation of Teixeria and Alex Rodriguez, each of whom burdened the team financially as their careers faded.
And if we reach far back into MLB’s past, players were routinely issued one-year contracts based exclusively on last year’s performance. MLB will never go there again, but the point the owners and GM’s seem to be making is the need for the pendulum to swing back the other way, in which two and three-year deals represent the top of the pay stratosphere.
[su_pullquote align=”right”]The game as we’ve known it is over. And the players need to come up with some better ways to fight what is happening – other than saying, “I’m gonna take my ball and go home.”[/su_pullquote]
The players and their union (MLBPA) are balking mainly because they (now) realize they shot themselves in the foot when the signed the collective bargaining agreement (CBA) that is with us until 2021. There was talk of boycotting Spring Training, but that will never happen.
But, is it collusion on the part of the owners? Of course, it is. If you and I and ten other people decide to go to the movies tonight, is that collusion? It could be if we plan to rob the concession stand. But otherwise, it’s just twelve people who had the same idea at the same time, and they are acting on it.
The Players Need To Get Creative
The players can do themselves a favor by stepping up the analytics game themselves. They already have one bullet in their arsenal which is MLB Merchandise. For example, how many Matt Harvey t-shirts have been sold over the years? How many pairs of Yoenis Cespedes batting gloves, Noah Syndergaard headbands, and so on? We’re talking big money here, folks. Last year, according to Forbes, MLB Shop took in $9.5 billion (that’s billion with a B) in revenue, a $500 million increase from 2015. For being #1 in the T-shirt sales department, how much money do you think Aaron Judge collected?
Similarly, the players argue that fans come to the ballpark to watch them perform athletic feats that often challenge gravity. True enough, but why not use that as a means to demonstrate the value some of these players have for, as George Steinbrenner liked to say, putting asses in the seats?
Why not, for instance, issue a card to each fan entering the ballpark with a list of all players in uniform that day with one instruction. Check the names of five players on your ballot who you came to see play today. Total ’em up at the end of a season, and the players have their version of WAR. Only this stat can be called TAP, for Tickets Sold Above Replacement.
Individually and as a unit, MLB players are not political animals. They seek only to play the game they have grown up with and love to play. No one, these days, goes to the poorhouse playing major league baseball. No one needs a second job driving a milk truck during the offseason like Hank Bauer, and Yogi Berra did for years during their playing days.
At the time time, the MLBPA and the players themselves need to understand that owners and general managers are (indeed) drawing a line in the sand. In days to come, Albert Pujols and even, Giancarlo Stanton will be seen as dinosaurs, the topic of conversation in bars across America for the contracts they won.
The game as we’ve known it is over. And the players need to come up with some better ways to fight what is happening – other than saying, “I’m gonna take my ball and go home.”
Footnote: A good follow-up read if you have the time appeared in the New York Daily News, and features MLB player, Brandon Moss, who has some controversial views on the current stalemate (“We Screwed Up”)
Let’s start with the surprising conclusion: Batters are getting hit by pitches at near-historic rates. For all that you hear about pitchers who won’t pitch inside, and umpires issuing warnings that make it impossible to throw at hitters, and batters being unwilling to take one for the team, we’re seeing batters get hit by pitches at the highest rate since the turn of the last century.
I looked at each decade since 1901, the first year there were two leagues. Using FanGraphs’ Leaders page, I calculated the number of hit batsmen per 100 games played:
1901-1910 6.5
1911-1920 4.9
1921-1930 3.6
1931-1940 2.6
1941-1950 2.4
1951-1960 3.1
1961-1970 3.4
1971-1980 3.1
1981-1990 3.0
1991-2000 4.7
2001-2010 5.8
2011-2014 5.3
Baseball was kind of a wild game in the early days, with all sorts of shenanigans on the ball field, including throwing at batters. Hit batsmen were already in decline when, on August 16, 1920, Carl Mays hit Ray Chapman in the head with a pitch, killing him. Hit batters declined through the next three decades, bottoming out at 2.14 per 100 games in 1946. They stayed around 3 or so per 100 games through the 1980s, and then they took off. Here are the 30 years with the most batters hit by a pitch per 100 games:
1. 1901 8.0 11. 1907 6.1 21. 2008 5.5
2. 1903 6.9 12. 2004 6.1 22. 2011 5.3
3. 1905 6.9 13. 1909 6.0 23. 2009 5.3
4. 1902 6.8 14. 2003 6.0 24. 2013 5.2
5. 1904 6.6 15. 2006 6.0 25. 1913 5.2
6. 1911 6.5 16. 2005 6.0 26. 2010 5.2
7. 2001 6.2 17. 2007 5.8 27. 1999 5.1
8. 1908 6.1 18. 2014 5.7 28. 1998 5.1
9. 1910 6.1 19. 2001 5.7 29. 2000 5.1
10. 1906 6.1 20. 1912 5.5 30. 2012 5.1
Isn’t that strange? Every year from 1901 to 1913 and every year since 1998. Nothing from the intervening 84 seasons. It raises two questions:
What’s going on? Why have hit batsmen increased despite efforts to cut down on beanball wars? It really has turned on a dime. There were 3.8 hit batsmen per 100 games in 1992, the 68th straight year below 4.0. It hasn’t been below that level since.
When will it change? Andrew McCutchen’s plunking was a big story but didn’t lead to any calls for change. Amid laudable efforts to improve player safety, from batting helmets to neighborhood plays to home plate collision rules, hit batters are returning to levels not seen since the year before Babe Ruth’s rookie season. There have been some pretty terrible beanings, like Jason Heyward’s last year. Let’s hope it doesn’t take something worse than that to reverse the trend.
Thus far, the Year of our Sport 139 — or the Year of our Lord 2000 and 10 — curious whispers have grown to sly murmurs, and in unity they portend: the Year of the Pitcher. Already, fans have indulged in the sight of two perfect games and a third de facto perfect game. By contrast, this time last season, we fans were discussing Albert Pujols’ interminable Power and Joe Mauer’s surprising Pop, all the while swirling the snifter of Slugging; but this year, tales of a Resurgent Carlos Silva and the dazzling Kid Stephen Strasburg have seized our headlines. This, the media assures us, is the Year of the Pitcher.
But is it? Perhaps it is the year of the Pat Burrell — the aging slugger — or perhaps the year of the missing needle? One thing is certain: Our teams are scoring fewer runs. The 2010 MLB’s runs per game has reached pre-Clinton lows:
Of course, taken with a tankard of greater perspective, this recent descent does not appear too outrageous. It in fact puts us closer in line with historical performances: