Archive for Bartolo Colon

Give a Fat Guy a Chance?

Bartolo Colon has not been good. There is no way to spin things to say that he has been good. Conversely, it is pretty easy to spin things to say he is bad. After another bad outing on Monday, his ERA is 7.78 in 59 innings of work. Masahiro Tanaka and Bronson Arroyo are second- and third-worst among qualified starters, at 6.34 and 6.24 respectively.

However, if you look at other statistics, they are not so bad. By FanGraphs’ measure of WAR, he is a tick above replacement level. His K% and BB% have both trended in the wrong direction by a couple points when compared to recent three-year stint with the Mets. His HR rate is up, though some of that may be attributable to what might be a very homer-friendly home park. Colon has also suffered from some bad batted-ball luck, with a BABIP of .353, only .004 points lower than his 2007 season that ended his tenure with the Angels and made many question if he was finished.

However, above all else, what is hurting Colon is probably his strand rate. As of right now, his LOB% is 48.5%. This is terrible. This is pretty much without precedent. And here is a table to show exactly how unprecedented this is:

Qualified Players with LOB% under 52% (since 1900)
Player Year LOB%
Dolly Gray 1930 51.8
Bartolo Colon 2017 48.5
Mike O’Neill 1903 47.4


When you see charts like this and statistical points like this, one thing that should always pop into your mind is that the 2017 figure represents about one-third of a season. Regression to the mean should make Colon’s LOB% go up over the course of the next year. Unfortunately for Colon, he is on the wrong side of 40 and often times when older players struggle, whether fair or not, it spells the end of the road. However, there is evidence that in cases like this, pitchers do not get the opportunity to play their ways out of struggles, regardless of age.

What I wanted to do here was look up pitchers who had similar LOB% to Colon through a comparable amount of the season, and to see what happened to those players. To me, that would have been ideal. However, I get an error message when I try to do that on the leaderboards, so I’ll have to present some less ideal numbers and invite anyone else who has access to look into this further.

Going back to 2002, using a minimum of 50 innings pitched, Colon still has the very worst LOB%, just ahead of a guy you might have heard of, Roy Halladay, who clocked a 49.4% rate in what was a truly dreadful 2000 campaign. Looking through the bottom 50 LOB% list, you will find a couple interesting trends. First, a lot of these players played for terrible teams. The early-2000 Tigers and mid-2000 Devil Rays have a few entries. Colon joins Williams Perez’ extremely forgettable 2016 season as the recent Braves on this list. Second, aside from Derek Lowe in 2004, none of these pitchers came close to pitching a full season. Lowe, who checks in at #26 on this list, had 10 more starts and 45 more innings than the second-highest total.

What this list does not account for, however, is that there could be pitchers like Colon that do very poorly in the LOB% department early in the season, but then turn things around due to better luck and thus do not end up on this list. In order to do this, I wanted to look at players that were similar to Colon’s 2017 season. Colon sports a 123 FIP-, which is worse than league average by a decent amount, but not close to his 184 ERA-.

Looking at the next 10 worst LOB% ranked players, you see that they were not having good seasons. Here are the players:

2008 Boof Bonser
2007 Dallas Braden
2010 Charlie Morton
2002 Jose Lima
2012 Brian Duensing
2006 Taylor Buchholz
2012 Justin Germano
2011 Charlie Furbush
2014 Yohan Flande
2008 Josh Fogg


And here is how they compare to Colon’s 2017 (numbers as starting pitcher only):

K/9 BB/9 HR/9 ERA- FIP- xFIP- BABIP LOB%
Colon 6.1 2.59 1.68 184 123 113 0.353 48.5
Next 10 5.95 2.82 1.45 166 119 109 0.319 54.3


Finally, a quick rundown of what happened to each of these players during their unfortunate seasons:

Boof Bonser: Bonser was demoted after May 31st to the bullpen, and finished the year there. Bonser was victimized by a horribly unlucky May, where his LOB% was 33.3%. Despite a lack of actual good pitching, the Twins did give Bonser a chance to improve his luck despite him being only 26. He had surgery in the offseason and barely played in the majors after that.

Dallas Braden: Braden actually did a pretty good job of keeping runners from scoring in his 2007 rookie season when he was coming out of the bullpen, but he was awful as a starter. Still, it seems as though the going-nowhere A’s did not hold Braden back as he finished the year as a starter. Braden was fairly successful until injuries cut his career short, most notably pitching a perfect game in 2010. It’s possible that Braden, 23 at the time, was helped by the A’s decision to let him continue in his starting role at the major-league level.

Charlie Morton: After starting with a 9.35 ERA, Morton was disabled, sent to sports psychiatrist, and demoted to the minor leagues on May 27th. He was able to return on August 29th, and had a decent rest of the season. Morton, who was 26 that year, has bounced around as a fringe starter ever since.

Jose Lima: Lima was a bad pitcher in 2000 and 2001 and somehow managed over 50 innings as a starter in 2002 to make this list. He struggled to a 7.77 ERA and famously responded to his release by Detroit by claiming he was “the worst pitcher on Earth.” Twenty-nine at the time, he managed to start 74 more games in the majors after that.

Brian Duensing: Duensing was 29 in 2012 and he makes this list because he managed to make just enough spot starts, despite the fact he was mostly a bullpen guy. For what it’s worth, Duensing’s 11 starts in 2012 were his last, though he still pitches in the majors. The fact that he went into the season thought of as a bullpen guy means you cannot make much out of his trajectory.

Taylor Buchholz: In his 24-year-old rookie season, Buchholz was not bad by peripheral stats when he was demoted to AAA on July 29th. The Astros, with nothing to play for, had given up on him and traded him to the Rockies, where he has two adequate years mostly pitching in relief. While it would be a stretch to say that he could have been wildly successful had he been given a chance, even a team with a new, forward-thinking GM was unwilling to look past the painful on-field results.

Justin Germano: At 29, Germano got a shot to end the year with the Cubs, and performed okay based on peripheral stats. But Germano was a journeyman player who recorded 23 of his career 48 starts in 2007. He was demoted and released, but honestly it would be the toughest sell job to say that he had any real potential.

Charlie Furbush: Furbush was a mediocre reliever in his age-25 rookie season when he was traded to Seattle in the Doug Fister trade, and for some reason the Mariners let him finish the season as a starter. He wasn’t good, but he was also very unlucky in the stranding-runners department. The Mariners held onto him, but put him back in the bullpen, where he was okay.

Yohan Flande: Flande was a 28-year-old rookie in 2014 that only made two starts after mid-August thanks to his struggles. He has barely been heard from since.

Josh Fogg: Fogg was an old man compared to the rest of this list (except of course for Colon) at the age of 33. I can’t find any indication that Fogg was demoted due to his struggles, and he finished the season in the rotation. The Reds were not playing for anything. After the 2008 season, he barely played.

Conclusion: Players with poor LOB% generally are not pitching very well, and generally are not given a chance to recover. It is likely that extremely poor strand rates are correlated with pitching poorly. Colon’s stint with the Braves and his time in baseball may be coming to an end, and he has likely been the victim of some historically bad luck. But the bad luck can only explain so much. Most of the pitchers who have pitched like Colon in the past were young guys who ended up converting to relievers or guys that were on their way out of the game. Only Braden and Morton remained starters for a significant amount of time afterwards, and Morton has been below average. They were also both almost 20 years younger than Colon is now. In other words, considering all of the bad numbers Colon has, even when taking into consideration his bad luck, there is probably not a good case to be made for giving a fat guy a chance. And he probably won’t get one.
Six Feet Under: Evaluating Short Pitchers

It’s September 10th, 1999, and the small flame-throwing right-hander from the Dominican Republic just struck out Scott Brosius and Darryl Strawberry. He’s about to get Chuck Knoblauch swinging (and missing) on 1-2 count for his 17th strikeout of the night to finish the game. He does, and the fans at the old Yankee Stadium go nuts, for they’ve just seen Pedro Martinez’ finest start in the greatest pitching season of all time. The final score is 3-1, with the only Yankee run, and hit, coming off a Chili Davis home run. Pedro is 5’11’’ and 170 lb, one of the smallest pitchers in baseball. While most players tower over him off the mound, Pedro writes a different story when he’s pitching. The Yankee hitters fail to notice his height when he kicks his leg up, down, and serves a 95-mph fastball from a three-quarters delivery at their eyes.

The average male height in the U.S. is 5’10’’. You’d never know this from watching a baseball game, where the average height is about 6’2’’, with pitchers just a little taller at about 6’3’’. We all remember the success Randy Johnson had at 6’10’’, and his height was always considered an advantage. When we watched Pedro Martinez, however, commentators and baseball men viewed him as an exception to some obscure and unwritten rule: that shorter athletes can’t become successful pitchers.

Six feet, like 30 home runs or a .300 batting average, has become a number associated with a distinct meaning. If you hit 30 home runs, you’re a power hitter. Hit 29 homers, and you have some pop. If you hit .300, you’re a great hitter. Hit .299, and you just missed hitting .300. Similarly, if you’re six feet, you can pitch. If not, you’re short, but at least you might get an interesting nickname like Tim Lincecum’s (5’11”) “The Freak.”

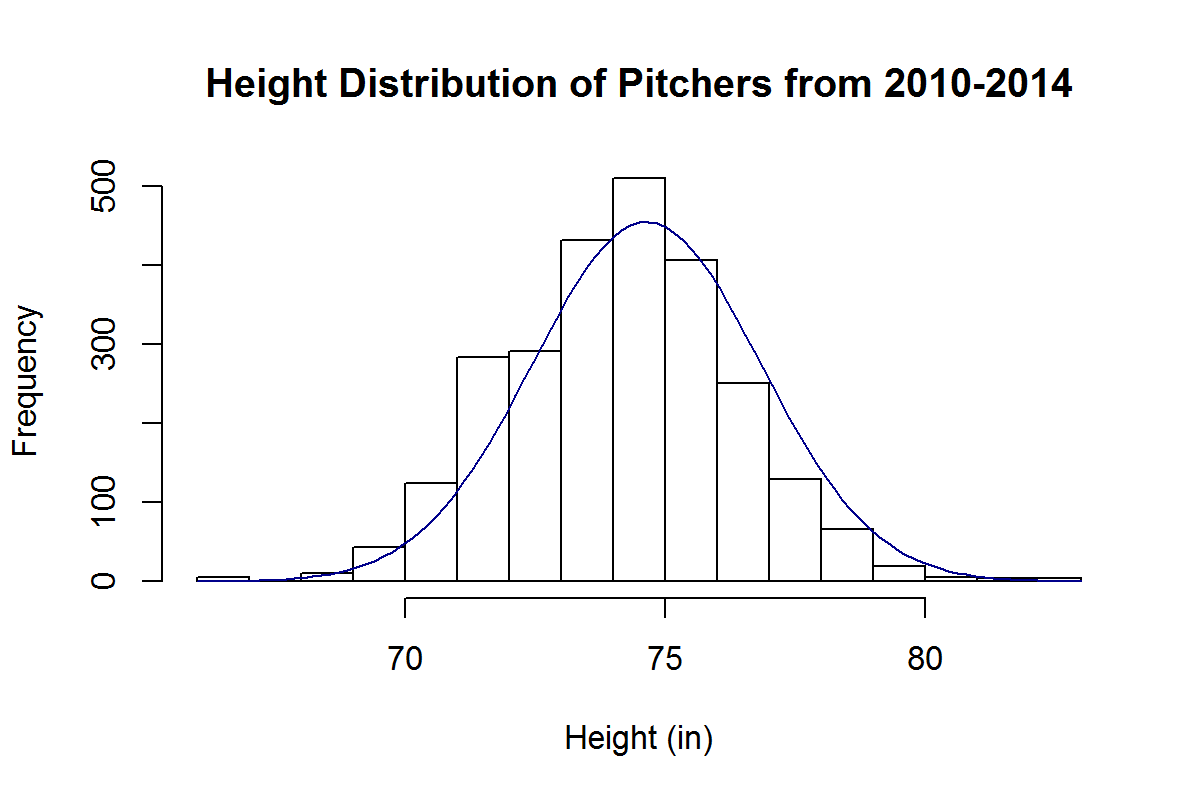
Most Major League pitchers fall between 6’1’’ and 6’4’’. We can look at the height distribution for pitching seasons of the last 5 years and see that it’s approximately normal:

By this approximation, the chance of randomly selecting a pitcher of the last 5 years who is shorter than 5’11’’ is about 5%.

Are short pitchers really destined to fail? We’ve all been told that it’s better to be taller if you pitch. But is this true? Let’s consider short pitchers to be 5’11’’ or under and examine their effectiveness and distribution in comparison to taller pitchers, who we’ll consider to be 6 feet or taller.

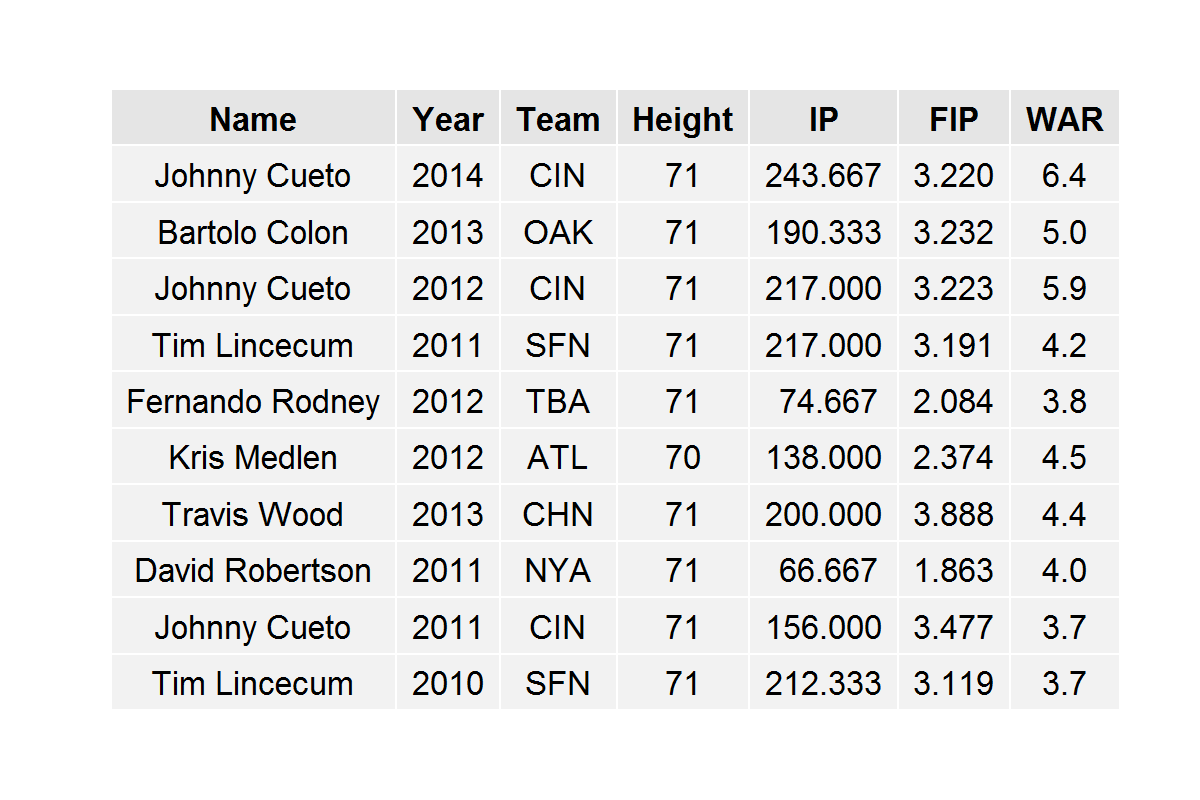
The top ten best pitching seasons for shorter pitchers of the last 5 years are:

We notice that Tim Lincecum appears on this list twice and Johnny Cueto appears on it three times. All of these pitchers are 5’11’’ with the exception of Kris Medlen, who is 5’10’’. So, we see that successful pitching seasons by short pitchers don’t come completely out of the blue. Short pitchers can be successful and can dominate batters, most of whom are much taller, as Cueto did last year and in 2012.

In fact, short pitchers aren’t all that rare to come by, although they’re considerably rarer than taller pitchers. In the last 5 years, there have been 23 instances of short starting pitchers throwing at least 150 innings. In comparison, there have been 402 instances of this type for taller starting pitchers.

Shorter pitchers are generally relegated to the bullpen; there have been 95 instances in the last 5 years of full-time short relief pitchers and 968 instances of full-time taller relief pitchers.

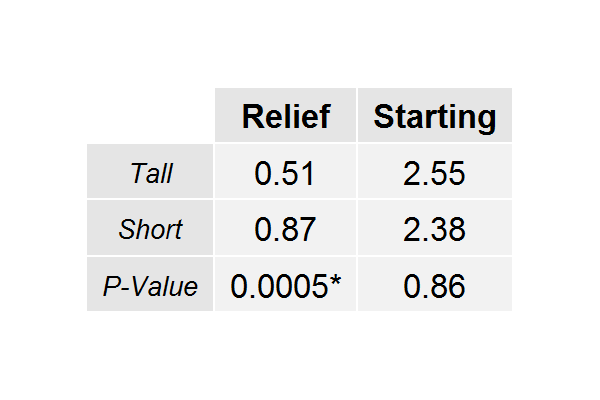
We can see the average WAR breakdowns for all of these pools of players in the following table, along with P-Values for a two-sided t-test comparing the short relievers against the tall relievers and the short starters against the tall starters:

What the 0.0005 is telling us, here, is that we would observe these results by chance alone with probability 0.0005. Thus, there is actually a significant difference in the mean WAR for short relievers and the mean WAR for tall relievers (obviously favoring short relievers). On the other hand, the difference between the starters is not significant. Either way, we have no evidence to suggest that shorter pitchers are any less effective than taller pitchers.

Are shorter pitchers undervalued in the baseball market? If so, to what extent? We can approach this by examining the WAR value of a pitcher relative to his salary in free agency. We can do this by comparing the height groups within relievers and starters (since relievers are generally valued differently than starters).

However, we find that in the last five years, there are only 4 instances of a starter 5’11’’ or shorter pitching for a team that acquired him via free agency; and all of them are Bartolo Colon seasons from 2011-2014.

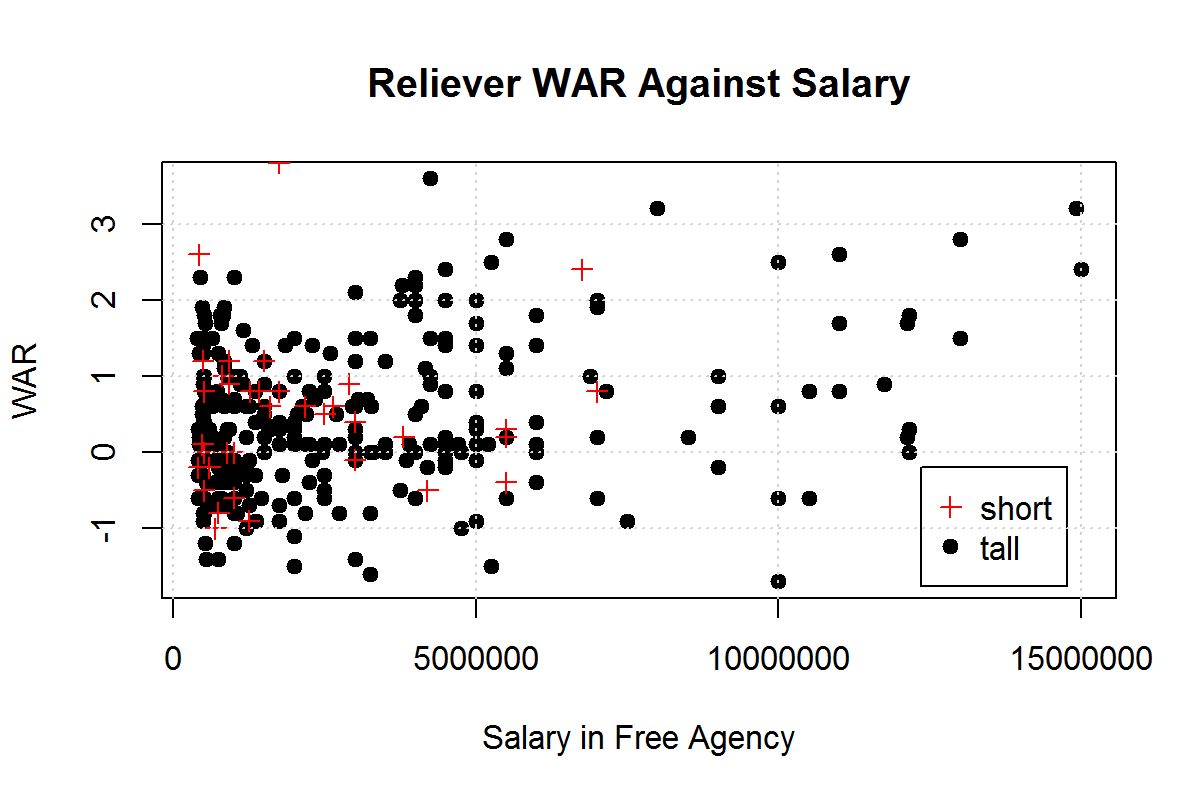
Fortunately, there are more instances of this in relievers, which is what we’ll examine. We notice the distribution of WAR and relievers’ salaries in free agency:

We see that short and tall relievers are clustered between -1 and 1 WAR and $1 million and $5 million dollars. However, we see several taller relievers past the $7.5 million mark with unremarkable WARs, which we don’t see for shorter relievers. From this, we would suspect that taller relievers are being overvalued while shorter relievers are being undervalued.

This is, in fact, the case: short relief pitchers are producing 2.33 WAR for every $10 million they earn in free agency while taller relievers are producing 1.36 WAR for every $10 million they earn. In comparing these values with a one-sided t-test, we acquire a P-Value of 0.0018, meaning these are results we would acquire by chance only .18% (a significant value) of the time. And so it goes, relievers under 6 feet are actually about 1.7 times as valuable as their taller counterparts.

Is there something inherently different about shorter pitchers that makes them less capable of pitching successfully in the big leagues? The evidence says no. In fact, it might be more worthwhile for General Managers to draft pitchers under 6 feet tall and reap the rewards.

Just because an athlete doesn’t tower over his opponents off the mound, doesn’t mean he can’t bring 55,000 dumbfounded Yankee fans to their feet on an unassuming September evening.


Your One-Stop Shop for Postseason Narrative Debunking

I, like you, have been hearing and reading a lot about the postseason and which teams are best positioned to go deep into October. The rationales aren’t always based on more tangible factors — like, say, which teams are good — but rather on “hidden” or “insider” clues (use of scare quotes completely intentional) drawn from other qualities. I decided to test each of the factors I’ve heard or read about.

Full disclosure: This isn’t exactly original research. Well, it is, in that I made a list of various hypotheses to test, decided how to test them, and then spent hours pulling down data from Baseball-Reference and FanGraphs in order to create an unwieldy 275×23 spreadsheet full of logical operators. But it isn’t original in that some of the questions I’m addressing have been addressed elsewhere. For example, I’m going to consider whether postseason experience matters. David Gassko at the Hardball Times addressed the impact of players’ postseason experience on postseason outcomes in 2008, and Russell Carleton at Baseball Prospectus provided an analysis recently. I’m not claiming to be the first person to have thought of these items or of putting them to the test. What I’ve got here, though, is an attempt to combine a lot of narratives in one place, and to bring the research up to date through the 2013 postseason.

I’m going to look at seven questions:

  • Does prior postseason experience matter?
  • Do veteran players have an edge?
  • How important is momentum leading into the postseason?
  • Does good pitching stop good hitting?
  • Are teams reliant on home runs at a disadvantage?
  • Is having one or more ace starters an advantage?

For each question, I’ll present my research methodology and my results. Then, once I’ve presented all the conclusions, I’ll follow it up with a deeper discussion of my research methodology for those of you who care. (I imagine a lot of you do. This is, after all, FanGraphs.) In all cases, I’ve looked at every postseason series since the advent of the current Divisional Series-League Championship Series-World Series format in 1995. (I’m ignoring the wild card play-in/coin flip game.) That’s 19 years, seven series per year (four DS, 2 LCS, 1 WS), 133 series in total.

DOES POSTSEASON EXPERIENCE MATTER?

The Narrative: Teams that have been through the crucible of baseball’s postseason know what to expect and are better equipped to handle the pressures–national TV every game, zillions of reporters in the clubhouse, distant relations asking for tickets–than teams that haven’t been there before.

The Methodology: For each team, I checked the number of postseason series they played over the prior three years. The team with the most series was deemed the most experienced. If there was a tie, no team was more experienced. I also excluded series in which the more experienced team had just one postseason series under its belt, i.e., a Divisional Series elimination. I figured a team had to do more than one one-and-done in the past three years to qualify as experienced. In last year’s NLCS, for example, the Cardinals had played in five series over the past three years (three in 2011, two in 2012), while the Dodgers had played in none. So St. Louis got the nod. In the Dodgers’ prior Divisional Series, LA played an Atlanta team that lost a Divisional Series in 2010, its only postseason appearance in the prior three years, so neither team got credit for experience.

The Result: Narrative debunked. There have been 101 series in which one team was more experienced than the other, per my definition. The more experienced team won 50 of those series, or 49.5%. There is, at least since 1995, no relationship between postseason experience and success in the postseason.

DOES VETERAN PLAYERS HAVE AN EDGE?

The Narrative: The pressure on players grows exponentially in October. A veteran presence helps keep the clubhouse relaxed and helps players perform up to their capabilities, yet stay within themselves. Teams lacking that presence can play tight, trying to throw every pitch past the opposing batters and trying to hit a three-run homer with the bases empty on every at bat. (Sorry, I know, I’m laying it on thick, but that’s what you hear.)

The Methodology: For each team, I took the average of the batters’ weighted (by at bats + gamed played) age and the pitchers’ weighted (by 3 x games started + games + saves) age. I considered one team older than the other if its average age was 1.5 years older than that of its opponent. For example, in the 2012 ALCS, the Yankees’s average age was 31.5, and the Tigers’ was 28.1, so the Yankees had a veteran edge. When the Tigers advanced to the World Series against San Francisco, the Giants’ average age was 28.9, so neither team had an advantage.

The Result: Narrative in doubt. There have been 51 series in which one team’s average age was 1.5 or more years greater than the other. The older team won 27 of those series, or 53%. That’s not enough to make a definite call. And if you take away just one year–2009, when the aging Yankees took their most recent World Series–the percentage drops to 50%–no impact at all.

HOW IMPORTANT IS MOMENTUM LEADING INTO THE POSTSEASON?

The Narrative: Teams that end the year on a hot streak can carry that momentum right into the postseason. By contrast, a team that plays mediocre ball leading up to October develops bad habits, or forgets how to win, or something. (Sorry, but I have a really hard time with this one. We’re hearing it a lot this year–think of the hot Pirates or the cold A’s–but there are other teams, like the Orioles, who have the luxury of resting their players and lining up their starting rotation. I have a hard time believing that the O’s 3-3 record since Sept. 17 means anything.)

The Methodology: I looked up each team’s won-lost percentage over the last 30 days of the season and deemed a team as having more momentum if its winning percentage was 100 or more percentage points higher than that of its opponent. For example, in one of last year’s ALDS, the A’s were 19-8 (.704 winning percentage) over their last 30 days and the Tigers were 13-13 (.500), so the A’s had momentum. The Red Sox entered the other series on a 16-9 run (.640) and the Rays were 17-12 (.586), so neither team had an edge.

The Result: Narrative in doubt, and then, only for the Divisional Series. There have been 64 series in which one team’s winning percentage over its past 30 days was 100 percentage points higher than that of its opponent. In those series, the team with the better record won 33, or 51.5% of the time. That’s not much of an edge. And when you consider that a lot of those were in the Divisional Series, where the rules are slanted in favor of the better team (the team with the better record generally gets home field advantage), it goes away completely. Looking just at the ALCS, NLCS, and World Series, the team with the better record over the last 30 days of the season won 13 of 27 series, or 48%, debunking the narrative. In the Divisional Series, the hotter team over the last 30 days won 20 of 37 series, or 53%. That’s an edge, but not much of one.

DOES GOOD PITCHING STOP GOOD HITTING?

The Narrative: Pitching and defense win in October. Teams that hit a lot get shut down in the postseason.

The Methodology: I struggled with a methodology for this one. I came up with this: When a team whose hitting (measured by park-adjusted OPS) was 5% better than average faced a team whose pitching (by park-adjusted ERA) was 5% better than average, I deemed it as a good-hitting team meeting a good-pitching team. For example, the 2012 ALCS featured a good-hitting Yankees team (112 OPS+) against a good-pitching Tigers team (113 ERA+). The Yankees were also good-pitching (110 ERA+), but the Tigers weren’t good-hitting (103 OPS+).

The Result: Narrative in doubt. There have been 65 series in which a good-hitting team faced a good-pitching team, as defined above. (There were four in which both teams qualified as good-hitting and good-pitching; in those cases, I went with the better-hitting team for compiling my results.) In those series, the better-hitting team won 32 times, or 49%. That is, good hitting beat good pitching about half the time. That pretty much says it.

ARE TEAMS RELIANT AT HOME RUNS AT A DISADVANTAGE?

The Narrative: Teams that sit back and wait for home runs are at a disadvantage in the postseason, when better pitching makes run manufacture more important. Scrappy teams advance, sluggers go home.

The Methodology: I calculated each team’s percentage of runs derived from home runs. In every series, if one team derived 5% more of its runs from homers than another, I deemed that team as reliant on home runs. For example, in last year’s NLCS, the Cardinals scored 204 of their 783 runs on homers (26%). The Dodgers scored 207 of their 649 via the long ball (32%). So the Dodgers were more reliant on home runs. In the ALCS, the Red Sox scored 36% of their runs (305/853) on homers compared to 38% for the Tigers (301/796), so neither team had an edge.

The Result: Narrative in doubt. There have been 60 series in which one team derived a 5% or greater proportion of its runs from homers than its opponent. In those series, the more homer-happy team won 27 series, or 45% of the time. So the less homer-reliant team won 55%, which is OK, but certainly not a strong majority. And if you remove just one year–2012, when the less homer-reliant team won six series (three of those victories were by the Giants)–the percentage drops to 50%.

IS HAVING ONE OR MORE ACE STARTERS AN ADVANTAGE?

The Narrative: An ace starter can get two starts in a postseason series (three if he goes on short rest in the seventh game of a Championship or World Series.) Assuming he wins, that means his team needs win only one of three remaining games in a Divisional Series and only two of five or one of four in a Championship or World Series. A team lacking such a lights-out starter is at a disadvantage.

The Methodology: This is another one I struggled with. Defining an “ace” isn’t easy. I arrived at this: I totaled the Cy Young Award points for each team’s starters. If one team’s total exceeded the other’s by 60 or more points — the difference between the total number of first- and second-place votes since 2010 — I determined that team had an edge in aces. (The difference was half that prior to 2010, because the voting system changed in 2010, when the voting went from three deep to five deep and the difference between a first and second place vote rose from one point to two.) For example, in last year’s Boston-Tampa Bay Divisional Series, the only starter to receive Cy Young consideration was Tampa Bay’s Matt Moore, who got four points for two fourth-place votes. That’s not enough to give the Rays an edge. But in the other series, Tigers Max Scherzer (203 points) and Anibal Sanchez (46) combined for 249 points, while the A’s got 25 points for Bartolo Colon. That gives an edge to the Tigers.

The Result: Narrative in doubt. There have been 82 series in which one team’s starters got significantly more Cy Young Award vote points than its opponents’. The team with higher total won 44 series, or just under 54%. That’s not much better than a coin flip. And again, one year — in this case, 2001, when the team with the significantly higher Cy Young tally won six series — tipped the balance. Without the contributions of Randy Johnson, Curt Schilling, Roger Clemens, Freddy Garcia, Jamie Moyer, and Mike Mussina to that year’s postseason, the team with the apparent aces has won just 38 of 76 series, exactly half.

Conclusion: None of the narratives I examined stand up to scrutiny. Maybe the team that wins in the postseason, you know, just plays better.


Now, About the Methodology: I know there are limitations and valid criticisms of how I analyzed these data. Let me explain myself.

For postseason experience, I feel pretty good about counting the number of series each team played over the prior three years. One could argue that I should’ve looked at the postseason experience of the players rather than the franchise, but I’ll defend my method. There isn’t so much roster and coaching staff turnover from year to year to render franchise comparisons meaningless.

For defining veteran players, there are two issues. First, my choice of an age difference of 1.5 years is admittedly arbitrary. My thinking was pretty simple: one year doesn’t amount to much, and there were only 35 series in which the age difference was greater than two years. So 1.5 was a good compromise. Second, I know, age isn’t the same as years of experience. But it’s an OK proxy, it’s readily available, and it’s the kind of thing that the narrative’s built on. Bryce Harper has more plate appearances than J.D. Martinez, but he’s also over five years younger–whom do you think the announcers will describe as the veteran?

For momentum, I think the 30-day split’s appropriate. I could’ve chosen 14 days instead of 30 — FanGraphs’ splits on its Leaders boards totally rock — but I thought that’d include too many less meaningful late-season games when teams, as I mentioned, might be resting players and setting up their rotations. As for the difference of 100 points for winning percentage, that’s also a case of an admittedly arbitrary number that yields a reasonable sample size. A difference of 150 points, for example, would yield similar results but a sample size of only 39 compared to the 64 I got with 100 points.

For good hitting and good pitching, I realize that there are better measures of “good” than OPS+ and ERA+: wRC+ and FIP-, of course, among others. But I wanted to pick statistics that were consistent with the narrative. When a sportswriter or TV announcer says “good pitching beats good hitting,” I’ll bet you that at least 99 times out of a hundred that isn’t shorthand for “low FIP- beats high wRC+.” If you and I were asked to test whether good pitching beats good hitting, that’s probably how we’d do it. But that’s not what we’re looking at here OPS and ERA are more consistent with the narrative.

For reliance on home runs, it seems pretty clear to me that the right measure is percentage of runs scored via the long ball. Again, my choice of a difference of five percentage points is arbitrary, but it’s a nice round number that yields a reasonable sample size.

Finally, my use of Cy Young voting to determine a team’s ace or aces: Go ahead, open fire. I didn’t like it, either. But once again, we’re looking at a narrative, which may not be the objective truth. Look, Roger Clemens won the AL Cy Young Award in 2001 because he went 20-3. He was fourth in the league in WAR. He was ninth in ERA. He was third in FIP. He was, pretty clearly to me, not only not the best pitcher in the league, but also only the third best pitcher on his own team (I’d take Mussina and Pettite first). But I’ll bet you that when the Yankees played the Mariners for the ALCS that year (too far ago for me to remember clearly), part of the storyline was how the Yankees got stretched to five games in the Divisional Series and therefore wouldn’t have their ace, Roger Clemens, available until the fourth game against the Mariners. Never mind that Pettite was the MVP of the ALCS. The ace narrative is based on who’s perceived as the ace, not who actually is. (And a technical note: Until the Astros moved from the NL to the AL, the difference between first- and second-place votes in the two leagues were different, since there were 28 voters in the AL and 32 in the NL. The results I listed aren’t affected by that small difference. I checked.)


Flooring the WBC: How the World Baseball Classic Negatively Affects the Health and Performance of Pitchers

The World Baseball Classic is certainly a noble idea. I mean, what’s not to like about it on paper? You take the best players from each baseball-playing nation and have them battle it out to see which country reigns over the rest of the globe. Can anyone trot out a more thunderous lineup than the USA? Who has the more dynamic pitchers: the Dominican Republic or Venezuela? Does Japan really produce the most fundamentally sound players? Fans all over the world have shown their support for this, as have many players.

All of this would be fine if baseball were like basketball, hockey or soccer; sports where you could wake up, trip over your dog, tumble down the stairs into a pair of cleats, skates or sneakers and play. Those sports employ bio-mechanics the body was designed to handle like running, jumping, kicking and swinging. Baseball, specifically pitching, is not like that. The human arm was not designed to handle the stress and torque put on it by pitching. If you don’t believe me, then I have a few thousand shoulder and elbow scars to show you, including my own.

The lucky few who are able to withstand such actions and be successful are kept on a yearly routine: start throwing in mid-February, build strength and stamina through March before turning up the intensity at the beginning of April. But just like it isn’t wise to turn the ignition on a new Mustang and instantly floor it, it doesn’t seem right to take a pitcher conditioned to ease into a season during Spring Training and tell him to pitch with October-like intensity in March. Unfortunately, this is the case with the WBC.

After looking through the statistics of those who appeared in both WBC tournaments, it is my belief that pitchers who participate in the WBC, especially starters, are far more likely to see a regression in their performance, get hurt or both than pitchers who do not play in the WBC. I reason that the most likely cause is the tournament’s timing disrupts the normal routine of pitchers and their arms are not yet ready to handle the stress and intensity then. With data collected from various sources, I will demonstrate the stark differences between WBC pitchers and their counterparts who did not participate in the tournament, using spreadsheet data and graphs included in this analysis.

***

The pitchers who were included in this study had to satisfy a few conditions. First, pitchers in the WBC group had to have pitched primarily in Major League Baseball in 2005, 2006, 2008 and 2009[1]. Players who played in one year but not another (spent one year in the minors or injured; or retired after a WBC) were not included. For the baseline of starters and relievers, a pitcher who made 10 or more starts for the year was counted as a starter while a pitcher who made 25 or more appearances with nine or fewer starts was counted as a reliever. The “all pitchers” category includes every pitcher who made an appearance during the 2005, 2006, 2008 and/or 2009 seasons.

***

At the heart of it, the key to successful pitching is how good you are in preventing runs from scoring, with ERA and component ERA (ERC)[2] being the primary statistics used to measure this aspect. The MLB’s ERA usually falls between 4.25 and 4.45 in most years, with only small differences from season to season. The last four groups saw small-to-moderate increases in their ERA between 2005 and 2006, but WBC starting pitchers saw a dramatic jump, from 3.75 to 4.48 while the ERC inflated from 4.09 to 4.79. WBC relievers also saw a significant jump in their collective ERAs (3.15 to 3.51), but not only is that only roughly half of what starters experienced, WBC relievers saw their ERC drop from 3.86 to 3.41. Compared against the league-wide ERA/ERC jumps of 0.24 (4.29 to 4.53) and 0.25 (4.18 to 4.43), respectively, the WBC starters’ jumps look even more like one of Superman’s single bounds. A major factor for this spike may be the above-average rise in HR/9 ratios. The average MLB starter showed no increase in his HR/9 rates and all other groups had increases of 0.1, but the HR/9 rates of WBC starters rose by 0.2 (0.9 – 1.1).

Home runs aren’t so bad, just as long as there isn’t anyone on base, but WBC starters were putting more and more runners on in 2006. Starting pitchers saw the highest rise in WHIP out of the five groups. The major league-average increase in WHIP between 2005 and 2006 was 0.04 (1.37 to 1.41), but the average WBC-participating starter saw his WHIP rise double that amount (0.08) from 1.29 to 1.37. Part of that increase was fueled by an up-tick in their BB/9 rates, which climbed from 2.9 to 3.1 (0.2). The most startling changes, though, were with the starters’ rising H/9 rates and falling K/9 rates . While all other groups saw a 0.2 increase in their H/9 ratios, WBC-participating starters’ ratios shot up by 0.5, going from 8.7 in 2005 to 9.2 in 2006. This may be attributed to a pitcher’s prematurely tired arm or improper mechanics from being rushed along during what normally is Spring Training. Either way, the pitches became more hittable, which also showed a decrease in these pitchers’ ability to strike batters out.

Every group I collected data on showed an improvement in their K/9 ratios by 0.2…except for WBC-participating starters. Their K/9 ratios actually fell, going from 7.0 in 2005 to 6.7 in 2006—a drop of 0.3 whiffs per nine innings. A good K/9 ratio shows both how good a pitcher is at retiring a batter without the help of his fielders and how dominant his repertoire is. The higher, the better. When I see that one group’s ratio is regressing while all others are improving, that would make me a little curious as to what may be causing such a downturn, especially with a group as valuable as starting pitchers. If I were in a team’s front office, it would make me wonder if this little event that is supposedly good for baseball is actually harming my pitcher and my team’s playoff chances.

***

Now, this wouldn’t so much of a concern if the pitchers who saw this decline in performance were just hurlers on the wrong side of 30 and/or at the tail-end of their contract, but that’s not a case. Pitchers like Jake Peavy and Dontrelle Willis saw their performances take a dive after participating in the 2006 WBC, while promising up-and-comers like Francisco Liriano and Gustavo Chacin suffered major injuries that year. Two of the more alarming examples are Peavy and Willis, two National League hurlers from pitcher-friendly ballparks who use complicated or violent deliveries.

Peavy seemed out of sorts during the first half of the 2006 season, posting ERAs of 5.17 or worse in three of the first four months. It was during this time that Peavy was also prone to the long ball, serving up 14 of his 23 home runs in April, May and June. The “gopher-itis” lessened once July hit, but then Peavy had a little more trouble finding the strike zone. After issuing no more than eight free passes in each of the first three months, Peavy walked 12 or more batters in every month during latter half of the season. Peavy eventually straightened himself out in 2007, but the same cannot be said for Willis. After nearly winning the Cy Young in 2005, Willis never could establish any consistency in 2006. His WHIP climbed an astonishing 0.29 points from 1.13 (sixth in the NL) to 1.42 (outside the top 30). At the same time, his HR/9 rate doubled from 0.4 to 0.8 while his opponents’ OPS climbed from .644 to .745. Since then, Willis’ regression went from bad to worse and is now viewed as little more than a reclamation project for the Arizona Diamondbacks.

***

Whereas 2006 saw a decline in WBC pitchers’ performance, the 2009 tournament participants saw an even more disturbing trend: a steep drop in their time on the mound. There were only negligible decreases in innings pitched following the 2006 WBC—10.1 percent for starters, 2.6 percent for relievers—but those figures worsened dramatically following this past tournament. WBC starters pitched, on average, 21.1 percent fewer innings in 2009 than they did in 2008 while relievers saw their innings totals drop by 27.2 percent. Houston ace Roy Oswalt saw his streak of five consecutive 200-inning seasons come to an end due to chronic back problems. Cincinnati’s Edinson Volquez appeared in one WBC game, then made only nine starts during the regular season before undergoing “Tommy John” surgery[3].

A second trend I noticed involved those pitchers who were in the playoffs the previous season. Out of the 11 pitchers who appeared in both the ’08 playoffs and the ’09 WBC, eight of them missed time due to injury (or, in the case of Javier Lopez, demotion) or saw an overall regression in their performance. The pitchers from this group who spent time on the disabled list pitched anywhere from 13.5 percent to 80.3 percent fewer innings than they had in ’08. Some of the more notable examples include Red Sox right-hander Daisuke Matsuzaka, whose 59.1 innings in ’09 were the fewest he’s pitched in either Japan or America, and Angels set-up man Scot Shields, who had never been on the disabled list for his entire nine-year big league career.

***

There are more examples of pitchers seeing their fortunes change for the worse after either of the two WBCs, like Bartolo Colon’s shoulder falling apart after rushing through rehab and Esteban Loaiza’s collapse in Oakland in 2006 or how Volquez’s elbow went kaput in the middle of 2009. I won’t list every pitcher who suffered, but my point is clear: the WBC increases the chances for pitchers to suffer injuries, see an across-the-board decline in performance or both. As I stated earlier, I feel the biggest reason for these unfortunate trends is the timing of the tournament. Holding this tournament in the early spring can only damage the health and careers of the players who wish to represent their countries and, in turn, hurt the player’s team both on the field and their long-term organizational plan. I feel the best possible resolution would be to hold the tournament at two different times: have the preliminary rounds during the week of the All-Star Game—while giving MLB, the Japanese leagues and all other leagues a mid-season break—and the final two rounds shortly after the World Series. This way, not only would the careers and health of the pitchers be better preserved, but it would also be highly beneficial to MLB as a whole.

Under the current scheduling, the WBC and MLB has to battle against the NCAA men’s basketball championship tournament for ratings and coverage. Since all other major professional and collegiate leagues are inactive in July, it would allow MLB a better opportunity to drum up interest in the tournament and give less well-known baseball-playing nations a bigger platform to perform. The week off would also benefit the players who are not in the WBC, as they would have had time to recover from injuries and spend invaluable time with family and friends. Lastly, the buzz over a recently completed World Series could carry over to the final stages of the WBC, with story lines from the first phase being built up prior to the resumption of the tournament. Playoff-participating players could have the option of continuing in the tournament or allow other players, who spent most of October resting and re-energizing, to go in their places. Those fresh bodies would also improve the quality of play seen by the fans.

The bottom line is this: the World Baseball Classic is an excellent idea, but is poorly executed in its current form, with pitchers suffering the most damage. Pitchers are the most valuable and volatile commodity in baseball and MLB should do its very best in order to protect that commodity. Even though there have been only two tournaments to study, the numbers are very clear and the logical decision to change should be made.

Michael Echan is a freelance sports writer from New Jersey. Please contact him if you would like to see the compiled spreadsheet data and graphs. He may be reached at mcechan@hotmail.com


[1] Francisco Liriano spent most of 2005 in the minors, but was included because he spent most of 2006 with Minnesota before a season-ending elbow injury in August. Luis Ayala was on Washington’s roster in 2006, but injured his elbow during the WBC.

[2] ERC is a statistic created by Bill James. It takes the number of hits, walks, home runs, hit batters and total batters faced by a pitcher to give an “alternate” ERA that better reflects his performance.

[3] Volquez did pitch a career-high 196 innings in 2008, his first full season in the big leagues, but has had his workload gradually increased during his career. His combined innings progression: 140 in ’05, 154 in ’06, 178.2 in ’07, 196 in ’08.