When Do Managers Use the Hook?

For the uninitiated, this piece heavily relies on my previous work around refining the inning/score matrix to quantify bullpen usage, and more recently, using RE24 to adjust the score differential for the base/out state in cases where the pitcher is not entering into a “clean” inning.

In that most recent piece, I concluded by alluding to a sort of “leaderboard” for base/out state adjustments. One hypothesis that you might have – certainly, one that this author had – was that we might see elite non-closers at the top of the list, implying that those pitchers are being brought in with runners on base more often than usual. Although closers are generally among the most highly-regarded relief pitchers in the game, the managerial status-quo has been to use closers almost exclusively in the “clean inning” state entering the 9th. Thus, while closers might not lead in terms of score adjustments due to inherited runners, an elite setup man certainly might.

Without further ado, here’s what that leaderboard looked like in 2016.

Largest Average Negative Score Adjustments
Player Team # Apps Mean Adj. Score Mean Adj. Inn Score Diff Inn Diff
Colton Murray PHI 24 -2.30 6.90 -0.22 0.15
Chaz Roe ATL 21 -0.73 7.57 -0.21 0.11
Gavin Floyd TOR 28 0.54 8.04 -0.21 0.11
Dean Kiekhefer STL 26 -1.78 7.59 -0.21 0.13
Alex Wilson DET 62 0.18 6.97 -0.19 0.13
Carl Edwards CHC 36 1.31 7.84 -0.19 0.15
James Hoyt HOU 22 -1.77 7.26 -0.18 0.26
Jordan Lyles COL 35 0.68 7.34 -0.18 0.09
Tommy Layne NYY 29 0.83 7.49 -0.17 0.25
Matt Bowman STL 59 1.08 7.28 -0.17 0.06

So… this isn’t exactly what I thought I’d find. There aren’t any closers in this group, but there really aren’t many top-flight middle relievers, either. If anything, this group came in when the team was tied or trailing more often than not. What’s going on here?

What we can’t discern is whether mid-inning appearances tend to be high-leverage affairs. There are most certainly cases where long men are used in the middle of the 4th inning to relieve an ineffective starter. That situation isn’t interesting in a vacuum; but it may be interesting to know what portion of those mid-inning appearances are of this low-leverage variety, and which are of the high-leverage variety.

One way that we can answer this question is to stratify qualifying relief pitchers by their average inning when entering the game. To accomplish this, let’s define a “closer” as a pitcher with an average inning of 8.5 or higher, and a “middle reliever” as a pitcher with an average inning between 7 and 8.5. Then we can look at the percentage of appearances for each group which were not “clean” innings.

AppearancesByRPType1216
(Click the graph for an interactive version)

As you might expect – even if you vehemently disagree with the practice – closers very rarely enter the game mid-inning. 85-90% of their appearances come in clean innings. Middle relievers, on the other hand, come into the game at the start of an inning closer to 60-65% of the time. That number has been on the rise recently, which seems a bit odd, or at least, at odds with what we’ve seen in the postseason recently (more on that in a bit).

Some small percentage of the time – the area between the lines of the same color – pitching changes are made with 1 or 2 outs in the inning but with no one on base. This is probably not optimal: The pitcher coming into that situation has an easier-than-average job, as they’re essentially getting a shortened inning to work through. If a guy like Dellin Betances can face 300 batters in a season, why waste 20 of them on situations that are easier than average?

The orange lines represent a subset of the overall middle relief group where the team in question is either tied or has no greater than a 3-run lead, in either the 7th or 8th inning. These are situations of high importance and leverage. An effective manager might be employing mid-inning pitching changes more often in these situations in order to limit damage and preserve leads.

Yet, this subset isn’t very different than the overall middle relief group. Whatever difference exited in 2012 and 2013 has been eroded in the last few years, as part of a general trend: Mid-inning appearances in the regular season are becoming less common.

As a final step, let’s contrast this picture of usage with an analogous graph on postseason appearances. We’ll maintain the same definitions of “closer” and “middle reliever” for consistency.

PlayoffAppsByRPType1216
(Click the graph for an interactive version)

Chaos! This graph looks more disorganized than the regular-season version, but then again, the postseason is more chaotic in general. We’re dealing with smaller samples and we can’t put too much faith into these trends. That said, two things stand out when comparing postseason usage to regular-season usage:

  • Closers are no longer treated as a special species. Even through 2014, closers were entering postseason games in clean innings about 80% of the time. In the postseason! When the managers are paying attention! When there are high-leverage situations at every turn! But in the past two seasons, closers have been used increasingly with runners on base – in fact, even more so than middle relievers have in close/lead situations during that time. Again, small samples, but this screams efficiency. If your closer is your most effective weapon, you should be using him with runners on base and a late lead, instead of using your second-most effective weapon instead.
  • Middle relievers have been used more often in “matchup” situations. 2014 and 2016 stand out in this regard, and it probably has something to do with guys named Bochy and Maddon representing large shares of the sample in those years. Recall that the gap between the dotted and solid lines of the same color represents the frequency of “1+ out, 0 on” appearances. Those gaps are huge in 2014 and 2016! While mid-inning appearances among all classes of pitchers were highest in 2016, that’s not the case at all for “men on base” appearances, which were more or less in line with historical norms. This represents an increase in match-up-based thinking, not leverage-based thinking.

These graphs look different, and they probably always will. Teams have relatively fewer resource constraints in the bullpen come October. They have more days off between games, and fewer games to budget resources for in the future.

That said, there’s been no carryover at all from the wild, and relatively new, bullpen management seen in the postseasons of 2015 and 2016. Constraints will limit the extent to which managers can call upon their best arms with runners on base late in games, but it would be hard to imagine that a status quo which holds the closer for the 9th inning almost 90% of the time can’t be improved upon in some way. Teams have spent more on bullpens, but they haven’t figured out how to use them any more efficiently in the regular season, and the differences we’ve witnessed in the postseason show that they’re only getting it about half right, even when it matters most.


Hitters Who Reached Base When They Shouldn’t Have

Some of my favorite moments in baseball are provided by players who, for one reason or another, absolutely should not have done what they just did. Ben Revere hitting a dinger. Vlad Guerrero swinging in the middle of an intentional walk. Willie Mays Hayes sliding short of the bag. Those moments are magical and hilarious.

And perhaps less amusing, but more exciting, there are guys who don’t give a flip if they’re behind in the count and don’t have any leverage. They’re still reaching base at a strong clip, providing small thrills by getting there when it looks like they’re all but back in the dugout. Below are the guys who did it most in 2016.

Read the rest of this entry »


Defensive Pillar or Offensive Killer?

Kevin Pillar recently announced that he played through a torn thumb for the majority of last season’s second half. I was curious to see how much this injury impacted his offensive production, so I decided to delve into his pre- and post-injury numbers. His elite defense in CF makes him a staple in John Gibbons’ lineup card on a daily basis — but how much would this injury negatively impact his ability to help his team at the plate?

Pillar is best known for his glove, and across the league he is often recognized for his diving catches in the outfield, like this gem.

However, despite him not being one of the Blue Jays’ major offensive contributors, the fact that his defense keeps him in the lineup every day, even when hurt, begs the question: At what point do you start sacrificing offense for stellar defense? Among the CFs who ranked in the top 15 in WAR last season with at least 400 PA, he was the only one with a negative offensive WAR component, at -11.9, which was the seventh-worst offensive WAR component last season for any qualified player. His 2016 wOBA (.295) and wRC+ (80) were identical to Billy Hamilton’s — not exactly the type of player you want to model your bat skills after.

But of course, his defense was incredible, as he led all OFs in defensive WAR (23.6), UZR/150 (26.3) and RngR (21.8). He was the third-best defender measured by WAR, only trailing Brandon Crawford and Francisco Lindor. His total WAR was 3.2 in 2016, and this is despite playing hurt from August 6 onward.

Pillar is an elite defender and a fan favorite — but what can he do offensively to make himself a positive offensive WAR player? First, let’s look at what he did pre-injury. Before August 6, Pillar slashed .261/.292/.385 with 7 HR, a 2.9 BB% and a 15.8 K%. When he returned from his DL stint, still feeling the effects of his torn thumb, he slashed .283/.338/.346 with no homers, but his walk rate was 7.8% and his strikeout rate dropped slightly to 14.2%. This is unfortunately based off a small sample size of 141 PA, and his batting average was inflated by a .333 BABIP, vs. his career mark of .305.

The major change to his output is what you would expect from someone battling a hand injury, and that was a major drop-off in power, as his ISO was cut in half after sustaining the injury. Pillar likes the ball up and in and struggles with pitches down and away. You can see how playing through a thumb injury could really hurt his ability to drive and pull the ball. Below is his pre- and post-injury ISO/P.


To further illustrate this point, below are his pull and hard-hit rates for the 2016 season. The line in the graph indicates when he returned from the DL.


He pulled the ball more, but was not able to barrel it up and make hard contact due to his thumb injury. He attempted to pull the ball on pitches not in on his hands, as shown by the two heat maps below for his pre- and post-injury swing percentage.

Despite having his setbacks, Pillar was able to post a slightly higher wOBA after his injury (.303 vs. .292), proving that he could still be a productive player, but in a different way. The Blue Jays quite frankly do not need Pillar to hit 15-20 HR and I don’t even think they care if he hits more than 10. Offensively, they need him to get on base more and provide speed on the basepaths. He needs to focus more on hitting line drives and ground balls rather than trying to hit fly balls, considering that last season Pillar had the third-worst batting average on fly balls (min 100 PA) at .139. He has already shown an improvement in changing his approach by decreasing his FB and IFFB rates by around 2.5% from 2015 to 2016.

All current projections on FanGraphs predict that Pillar will have another negative offensive season; however, in a healthy 2015 season he posted an offensive WAR component of 3.2. I believe that it is possible for him to do that again in a healthy 2017, but he needs to make a few adjustments at the plate and needs to stay healthy. This is something that he’s struggled a bit with in his career, as he tends to go all-out in the field.

He should have a better offensive season in 2017 than he did in 2016, and he appears to be healthy in spring training, so far hitting 10-for-20 with 5 doubles, which is promising but not that meaningful. I hope he can continue to make offensive strides this season without any injury setbacks, but expectations should probably be set that the Blue Jays organization and their fans may just need to accept the fact that they have a stud defender, yet not much more than a mediocre hitter.


The Opportunity Baseball Organizations Are Missing

I realize the title of the article is a very bold statement. If you are looking for conclusive proof through overwhelming data, I would suggest checking back several years from now, well after what I discuss will have largely played out. What I will offer, however, are signs and anecdotes that a significant opportunity does exist. That opportunity: A systematic process for both identifying and fixing hitters performing below potential.

Coming from an investment research background, I was able to discover several specific things where consensus views are either misplaced or do not exist. While I can’t get into specifics in terms of the “what” (yet), the “how”, and “why”, I was able to find these things are interesting to consider. This article (and possibly series of articles) could be considered a “ride along” if you will, where I will share some key parts that I believe are interesting to an analytically-focused baseball audience. Further, there is an upcoming fork ahead where a decision will be made as to strategic direction – attempting to influence wins or selling products. If the latter, I will detail everything either here or on a to-be-established blog.

There are different paths to research success. The keys that I’ve observed are: 1) Determine the primary drivers – i.e. pick a narrow lane, 2) Go deep to discover where consensus views are misplaced or do not exist, and 3) Constantly ask yourself where you might be wrong or what could you be missing. When I started research into hitting, it was this last item – the lack of self-questioning — that really stuck out. The coaching side of baseball at all levels seemed cemented in its views, clearly unwilling to consistently ask itself these very important questions. After almost getting punched by a coach several years ago, I was convinced that the emotion, ego and attachment to opinions that befall many smart investors were likely creating a large opportunity.

One more investing parallel and then I’ll get to some data. In the 2008 financial and housing crisis, one of the primary reasons that a tremendous opportunity to bet against the housing market arose was that the models, based on historical data, assumed housing prices would not decline on a nation-wide basis. However, a small number of investors, focusing on fewer, yet more significant signs were able to make billions by betting against the models and strongly-held consensus views. Similar to this example, baseball organizations don’t believe an opportunity exists because the historical data indicates that it doesn’t. Let’s take a look.

In the past nine years, there have been 92 cumulative changes to the hitting-coach position across major-league baseball. The pitching-coach position, on the other hand, has turned over only 45 times in the same period. The average age of the position is 52.6, and the coaches have an average 19.7 years removed from active play (read – all have significant legacy views). It doesn’t appear that any are adding significantly more value than the group and no individual or organization is consistently fixing broken hitters with recurring success. I believe the real signs are in the anecdotal evidence, which tell a completely different story.

Anecdotal Evidence an Opportunity Exists

J.D. Martinez – In early 2012, I sent a letter and video to his prior organization discussing the opportunity in fixing his mechanics, as well as the opportunity through a systematic process of identifying and fixing underperforming hitters (much the same as you are reading here). In December 2013,  after seeing the specific changes I was looking for, I made the following comment to Dan Farnsworth’s article – Rule 5 Darkhorse J.D. Martinez:

“…..These changes are some of the most significant (and in the right direction!) that I have seen for a major league player….. if he keeps moving his swing in this direction, he will be a major offensive producer in the next few seasons.”

He was released just a few months later. You likely know the rest of the story. Credit and thanks to Dan Farnsworth for writing the article.

Alex Bregman – Upon his major-league debut, I noticed a significant flaw that would likely prevent him from succeeding at the major-league level, and made the following comment in Eric Longenhagen’s post “Scouting Astros Call up Alex Bregman”:

“….only the power and HRs won’t be there consistently because he is cutting his swing so short. With his current approach, I think he’s going to have a far tougher road than what most are projecting.”

The swing shortness was of a particular type that I had come across with several other players who had used a particular swing-training device. I had a very high degree of conviction as to the likely results.

On August 7th, I noticed he had changed his swing and he and also said “It’s just a mechanical issue that we’re working out to get back to how it was.”  I made the following comment on the same post.

 “….. since his terrible start and now likely subsequent improvement may be cast as randomness, better luck, or just needing more major league ABs, I think the real story here is relatively clear – the changes in his mechanics and approach were the primary driving factors both on the way down and the way back up (hopefully?) and would have occurred regardless of the playing level (AAA or MLB).”

Subsequent to his statement of “getting back to my old swing,” he changed his public comments — stating that he really didn’t make a swing change. I’m guessing so that no one gets thrown under the bus. Since the media bought into the revised, post-spin version of events, that seems to be the current consensus view, even though it is clearly inaccurate.

Looking at these cases and other turnarounds, the key takeaways are:

1) The solutions are not coming from within the organization

In the vast majority of cases, players are finding their own solutions. Players seek out advice from other players as well as outside sources. There are numerous quotes from hitting coaches with comments along the lines of “I don’t mess with the mechanics. When they get here, they already know how to hit.” Many hitting coaches appear to have taken the Hippocratic oath approach of “do no harm.”

2) The examples of significant and sustained turnarounds are extremely limited

I screened for players with below-average wRC+ for at least two seasons and also a wRC+ of 120 or more for the past two years. J.D. Martinez was the only return. There have been other notable improvement stories – Jose Altuve, Josh Donaldson, Manny Machado, Nelson Cruz and Anthony Rizzo; however, all were generally at least average or better before the improvement.

Using the same methods that identified the players above (as well as other players commented on this site), I find approximately 50 players at the MLB level who are performing well below their potential and could realize transformational improvement – if given the correct prescription. I won’t bore you with the complete list, but here are the top seven.

  • Mike Zunino
  • Travis d’Arnaud
  • Ryan Flaherty
  • Kevin Kiermaier
  • Yasiel Puig
  • Jason Castro
  • Jake Marisnick


Depending on how things transpire, as noted in the first section above, I may go into detail on both the video and data analysis that leads to the conclusions above in future posts.

The Gap in the Middle

With baseball’s data/analytics side not going deep into mechanics and the coaching/player development side not doing significant research challenging current views, it is not too difficult to consider that there might be an opportunity gap in the middle, relative to new thoughts on mechanics. When I examine how these organizations with vast budgets and resources are missing key things, this “gap in the middle” seems to make the most sense. In hindsight, it was definitely a source underpinning my findings.

I believe it is fairly safe to say that baseball organizations are definitely missing something – it’s just a matter of the size of the opportunity. The recent fly-ball emphasis is a case in point. It’s somewhat ironic that this is being cast as something “new” when Ted Williams wrote and talked about it (i.e. the swing should not be down but up in the general plane of the pitch) 47 years ago. I am confident the “fly-ball movement” is not the magic bullet many seem to believe. Pursuing this path will only divert focus away from a more valid, comprehensive, and systematic solution.

Arguably, there is no other sport where mechanics play such a significant role in a player performing to potential. Without question, teams and coaches have struggled with this issue, given the high turnover of the hitting-coach position and the lack of consistent value-added input in regard to mechanics. Given the connection of mechanics to performance and performance to value, the possibility of an effective solution should not be considered lightly.

In weighing the evidence, on one side, there is significant historical precedent indicating systematically fixing players has not been possible. Clearly, even the best hitters in the game have not been able to transfer what largely exists in their muscle memory to other players. On the other side, there are a few anecdotes that may not seem significant in isolation; however, taken together, there is a logical story line that warrants consideration. The probability that the signs above are purely random and that they also have no connection to the bigger picture as discussed is extremely low. Given the stakes, shouldn’t organizations be asking themselves “What could we be missing?”


Brandon Finnegan’s Changeup Adjustment

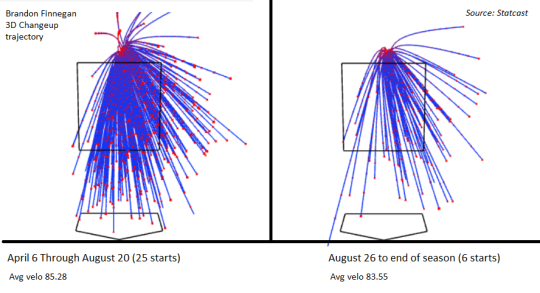
Brandon Finnegan tweaked his changeup late last year, and the result was a significant boost to his overall game. Eno Sarris detailed how he threw it more while taking some zip off, widening the velocity gap between it and his fastball to about 10 mph. That led to an ERA well below three and a strikeout percentage of 30%, which are very baller numbers.

I don’t think it was just the velo difference that led to Finnegan’s outstanding results, though (I don’t think that’s what Sarris was saying, either). The pitch seems to have totally changed. Like, new address, new clothes, new cologne. New everything.


image

It didn’t just get slower. It became less erratic, less a noodle and more a frozen pea. It reminds me of when Cole Hamels wrangled his own changeup, where it went from seducing hitters with its movement to stifling them with its precision. I’m not saying Finnegan’s change now mimics that of Hamels, but it certainly became more wily at the end of last season.

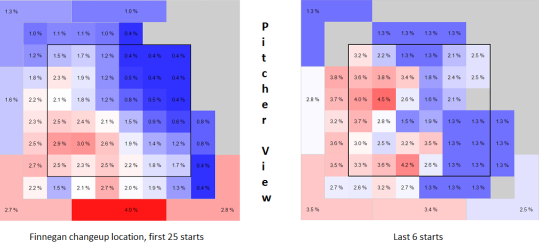
The trajectory of it makes it look like it’s straight and narrow, right? And by itself, it is. It stands to reason that if Finnegan threw the changeup with more consistent trajectory, that it was located more consistently as well. That’s what appears to have happened. In the scope of sequencing his pitches, that’s extremely important, because it means he could rely on it more while hitters could accordingly rely on it less.

Source: FanGraphs

image

Finnegan turning down the velo and fine-tuning the location of his changeup are good things in a vacuum. But what those adjustments really did was make the pitch more closely resemble a four-seam fastball, and one left up in the zone, at that. He took his changeup and made hitters think it was a mistake. They accepted it graciously until it was too late. The results were essentially the same as when Lucy pulls the football out from under poor old Charlie Brown.

It’s important to acknowledge sample size here — six games isn’t much at all. But the adjustments produced results that should certainly encourage Finnegan to keep the altered approach with his changeup from the end of last year. What I’m curious about is how he builds off of this.

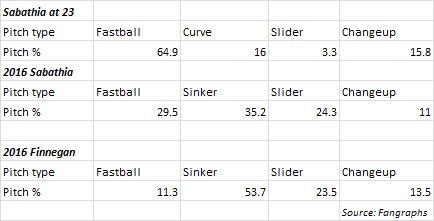
Only three other pitchers in the majors last year threw at least 2500 pitches between their four-seamer, sinker, slider, and changeup: Ervin Santana, CC Sabathia, and Chris Archer. Finnegan used his changeup more than them all year long, but that’s especially true from the end of August through season’s end. It was also the best of the group — by nearly three runs per 100 thrown!

Archer and Santana don’t throw a sinker, which leaves only Sabathia as a comparison for Finnegan through this context. There isn’t necessarily a lot that makes the two comparable aside from their arsenal, but there might be something Finnegan can learn here from his elder statesman.

image

He threw a fastball at a nearly identical rate as Sabathia did at his age. (Sabathia also wasn’t throwing a sinker yet, which was another step in his evolution.) This doesn’t speak to any grand finding, but it does acknowledge a pitcher’s youth. As time moved on, Sabathia learned to rely on his fastball less and less — 13 years later, he was throwing his four-seamer nearly 35% less often. In the case of Finnegan, he might take an additional step by relying on his sinker less and less, and, given the way his changeup fools hitters, he might benefit by throwing more four-seamers.

Maybe it’s intuitive that a pitcher should better balance his offerings to make himself less predictable. That doesn’t mean he’s going to figure it out, though. In terms of adjustments, baseball is paradoxically a game of “dance with who brought you” and “tinker ‘til you’re at the top.” Brandon Finnegan already seems to be getting more confident with the idea of tossing his pitches more equally. But it could also indicate advancing beyond what got him to the majors, to where he’s finding what can keep him there for a long time. The work he’s put into his changeup is just the first step.


Greg Bird: What Can We Actually Expect?

Stop me if you’ve heard this already. First base is a thin position right now. Sound familiar?  I thought so. For that reason, many of us will be bargain shopping this draft and auction season, and one name that comes up as a down-the-board option is Greg Bird.

Personally, I’ve had two major issues with ranking and projecting Greg Bird. The first is that he didn’t log any meaningful time last year due to injury. The second is in his 46-game, small-sample-size debut for the Yankees in 2015, he hit what I believed to be an exaggerated number of fly balls (51%). Further confounding the issue is that the percentage of those that turned into home runs (20.4%) seemed high compared to his output in the minors.

In my quest for a more perfect valuation of Greg Bird, I decided to grab all the game logs from Trenton and Scranton/Wilkes-Barre from 2015 and create my own larger sample size data set for his batted-ball outcomes. In the table below, I’ve listed his batted-ball outcomes from his minor-league games in 2015.

Greg Bird MiLB Batted Ball Outcomes 2015
Type # %
Grounders 82 34.6%
Liners 56 23.6%
Flies 120 46.5%
HR | HR/FB 11 9.1%
AA & AAA Games

The following are his batted-ball outcomes for 2015 at all levels including his call-up with the Yankees later that summer.

Greg Bird Batted Ball Outcomes 2015
Type # %
Grounders 110 30.3%
Liners 79 21.8%
Flies 174 47.9%
HR | HR/FB 22 12.6%
AA, AAA & MLB Games

The fly-ball rate (47.9%) is accompanied by a 16% infield fly ball proportion that was markedly better in his short stint with the Yankees (11%) than in his larger sample in the minors (18%). Through the solely statistical lens, I’d say he squared up a greater percentage of his small sample size fly balls with the Yankees. I did manage to confirm for myself that Bird does come with a very fly-ball-heavy batted-ball profile.

A large part of the reason fantasy league owners are excited about Bird is the park he plays in and the side of the plate he hits from. Yankee Stadium is a bomb-dropping paradise for lefties, and some of the success Bird had in his limited trial should be attributed to the more hitter-friendly parks he played in, versus what he saw in Trenton and Scranton/Wilkes-Barre. Courtesy of rotogrinders.com we can see Yankee Stadium plays with a 1.53 park factor for home runs in right field.

Image and video hosting by TinyPic

Though I couldn’t locate hand-specific park factors for Trenton and Scranton/Wilkes-Barre, both play at around 0.75 for homers, which are very pitching-friendly. Playing half his games in these two parks certainly could have been the limiting factor for Bird’s somewhat lackluster 9.2% HR/FB mark in the minor leagues in 2015.

While it’s fair to say we don’t know Bird’s true-talent level on HR/FB just from his statistics, I did perform some very simple math and calculate the difference in the two sets of park factors on home runs (~1.5 / ~0.75 = ~2x). It’s plausible that Yankee Stadium could offer a 2x boost on his HR/FB. While Bird might not be at a true-talent level of converting 20% of his flies into homers, he might be in the 18% neighborhood. Armed with this larger set of data, I began looking for comps for Bird’s fly-ball and HR/FB rates. My goal was to pull players from either the 2015 or 2016 seasons that had fly-ball rates over 45% and a home run to fly ball ratio at or above 18%.

Greg Bird Comps On FB% & HR/FB%
Player Year FB% HR/FB%
Tommy Joseph 2016 45.1% 18.9%
Trevor Story 2016 47.1% 23.7%
Kris Bryant 2016 45.8% 18.8%
Miguel Sano 2016 45.8% 20.8%
Chris Carter 2016 48.7% 23.8%
Brandon Moss 2016 52.6% 19.4%
Mike Napoli 2016 45.1% 20.5%
David Ortiz 2016 45.1% 18.4%
Brian Dozier 2016 47.7% 18.4%
Todd Frazier 2016 48.7% 19.0%
Chris Carter 2015 51.8% 18.9%
Jose Bautista 2015 48.8% 18.4%

This does turn up an interesting list of sluggers with a wide variety of outcomes. If I relax the requirements a little further, you’ll start to get into the Joc Pederson, Lucas Duda, Luis Valbuena and Colby Rasmus group. Obviously this is a mixed bag of player outcomes because we haven’t tackled their BB% or K%, which impact the HR/SLG/TB categories in roto leagues or the bottom line in points leagues.

Pederson, Duda, Rasmus, Carter, Sano, Moss and Napoli all have a much higher K% than Bird has shown in Double-A and Triple-A. In total, across all his MILB at-bats in 2015, Bird struck out only 17.5% of the time. Though you might speculate the pitcher-friendly confines of his home parks would dictate letting him put the ball in play was a more favorable outcome. In his limited stint with the Yankees in 2015, he posted a K% right around that 30% neighborhood, which brings him back to my favorite comp for his current skills — Mike Napoli.

Bird also has other issues to contend with for fantasy baseball value which include: lineup slot, platooning, and, most recently — Chris Carter. For the sake of imagining the range of outcomes for Bird, let’s assume he got full time at-bats in the sixth slot in the Yankees lineup. We know that the sixth spot in the AL lineups averages around 675 plate appearances. If we use an 11% walk rate for Bird, that will leave him with ~600 at-bats to do HR/SLG/TB damage. My guess is Bird isn’t good enough to avoid a platoon, so for the sake of a range of predictions on his output I’m going to use the FanGraphs fans-predicted number of plate appearances (553) to give what I feel is a best-case set of scenarios for Bird’s home-run totals.

Bird HR Outcomes Given FB% and HR/FB
HR/FB 44% FB 45% FB 46% FB 47% FB 48% FB 49% FB 50% FB
14% HR/FB 24 25 25 26 26 27 27
15% HR/FB 26 26 27 27 28 29 29
16% HR/FB 27 28 29 29 30 31 31
17% HR/FB 29 30 30 31 32 32 33
18% HR/FB 31 32 32 33 34 34 35
19% HR/FB 33 33 34 35 36 36 37
20% HR/FB 34 35 36 37 37 38 39
* Assumes 390 balls put in play (11% BB; 20% K) on 553 PA

Bird may already be the left-handed version of Chris Carter. I’m even more bullish on Greg Bird than I was before I started the investigation, and easily the high man on his HR output when considering Steamer, Fans, ZIPS and Depth Charts. His batting average will ultimately depend on where he settles in on his K% and his ability to blast liners and grounders through for hits. I think he’ll be an interesting Statcast case to monitor early this year.


Matt Carpenter Makes Good Wood

Since earning a starting job with the Cardinals in 2013, Matt Carpenter has been one of the league’s best run producers, and one of the best OBP lead-off hitters. From 2013-2015, health was a staple for Carpenter, as he had 2109 PA (avg. 703), which ranked third, only behind Nick Markakis (which is a bit surprising) and Mike Trout. In 2016, Carpenter injured his right oblique on July 6th and was never quite the same after returning back from his DL stint. A lot of fans were surprised to see a power outbreak for him in 2015, Carpenter posting a career-high 28 home runs (in 665 PA) when he had only hit 25 homers in his previous 1766 PA. He made some changes to his approach at the plate in 2015 and strove to hit more fly balls, pull the ball more and to sacrifice some contact for some power.


2016 Avg. Launch Angle and Avg. Exit VelocityNow let’s jump to 2016. It was a tale of two halves. His offensive production was finally impacted by an injury which directly affected his swing and, more specifically, his new power-enhanced swing path.

In a recent article by Jeff Sullivan from FanGraphs, he references data from Baseball Savant which indicates that the optimal launch angle for slugging percentage is between 20-29 degrees. Carpenter has increased his average launch angle from 17.2 degrees to 18.2 between 2015 and 2016. Continuing to increase his launch angle while playing injured likely contributed to his plummeting batting average in the second half, as he continued to try to hit fly balls and line drives but simply couldn’t create the same bat speed and power to carry the ball into gaps and over the fence.

Below is a 15-Game rolling average of Carpenter’s Weighted On Base Average for the 2016 season. He got injured during game 78 of the season, which can easily be identified on the chart. He clearly never got back to form after hurting his oblique, but he did have the fourth-best wOBA before his injury, getting beat out by only David Ortiz, Josh Donaldson, and Mike Trout.

When playing healthy, his average swing speed was 62.7 MPH, but it dropped to 61.8 MPH after returning from the DL. His hard-hit rate also dropped by 6.7% and his soft-hit rate increased by almost the same amount. He clearly wasn’t the same hitter at the plate, and his numbers down the stretch took a massive hit.

If we focus on his 2015 and the beginning of 2016 production, we are looking at an elite run generator and on-base machine. He ranks ninth in OBP, 12th in BB% and wRC, had the same OPS as Nolan Arenado, had the same wOBA as Edwin Encarnacion (tied for 11th), and lastly he and Joey Votto were the only hitters in that timeframe to have a combined medium+hard-hit rate over 90%. That is some elite company.

Health will be imperative for Carpenter in 2017. If he is able to avoid a major injury this year and show no ill effects in spring training from his oblique injury from last season, we could be looking at someone who could shatter his current projections. His hitting tool and batted-ball profile are quite similar to Joey Votto and Freddie Freeman, with a high walk rate and hard-hit rate, a high line-drive rate, and power in the 25-30 home run territory.

The following stats are from 2015 – July 6th, 2016.

Advanced Stats:
Batted Ball Profiles:

Putting Carpenter in that category of hitter might be a stretch for some; however, since making adjustments to his swing path and approach at the plate, he really isn’t that far off, as Carpenter, for the majority of these metrics, falls below Votto but ahead of Freeman.

He has withdrawn from the World Baseball Classic due to a back injury that his manager has indicated isn’t too serious. Nevertheless, he is definitely worth monitoring in the coming weeks leading up to opening day, to make sure he looks like his hard-hitting normal self.


Basic Machine Learning With R (Part 3)

Previous parts in this series: Part 1 | Part 2

If you’ve read the first two parts of this series, you already know how to do some pretty cool machine-learning stuff, but there’s still a lot to learn. Today, we will be updating this nearly seven-year-old chart featured on Tom Tango’s website. We haven’t done anything with Statcast data yet, so that will be cool. More importantly, though, this will present us with a good opportunity to work with an imperfect data set. My motto is “machine learning is easy — getting the data is hard,” and this exercise will prove it. As always, the code presented here is on my GitHub.

The goal today is to take exit velocity and launch angle, and then predict the batted-ball type from those two features. Hopefully by now you can recognize that this is a classification problem. The question becomes, where do we get the data we need to solve it? Let’s head over to the invaluable Statcast search at Baseball Savant to take care of this. We want to restrict ourselves to just balls in play, and to simplify things, let’s just take 2016 data. You can download the data from Baseball Savant in CSV format, but if you ask it for too much data, it won’t let you. I recommend taking the data a month at a time, like in this example page. You’ll want to scroll down and click the little icon in the top right of the results to download your CSV.

View post on imgur.com


Go ahead and do that for every month of the 2016 season and put all the resulting CSVs in the same folder (I called mine statcast_data). Once that’s done, we can begin processing it.

Let’s load the data into R using a trick I found online (Google is your friend when it comes to learning a new programming language — or even using one you’re already pretty good at!).

filenames <- list.files(path = "statcast_data", full.names=TRUE)
data_raw <- do.call("rbind", lapply(filenames, read.csv, header = TRUE))

The columns we want here are “hit_speed”, “hit_angle”, and “events”, so let’s create a new data frame with only those columns and take a look at it.

data <- data_raw[,c("hit_speed","hit_angle","events")]
str(data)


'data.frame':	127325 obs. of  3 variables:
 $ hit_speed: Factor w/ 883 levels "100.0","100.1",..: 787 11 643 ...
 $ hit_angle: Factor w/ 12868 levels "-0.01               ",..: 7766 1975 5158  ...
 $ events   : Factor w/ 25 levels "Batter Interference",..: 17 8 11 ...

Well, it had to happen eventually. See how all of these columns are listed as “Factor” even though some of them are clearly numeric? Let’s convert those columns to numeric values.

data$hit_speed <- as.numeric(as.character(data$hit_speed))
data$hit_angle <- as.numeric(as.character(data$hit_angle))

There is also some missing data in this data set. There are several ways to deal with such issues, but we’re just simply going to remove any rows with missing data.

data <- na.omit(data)

Let’s next take a look at the data in the “events” column, to see what we’re dealing with there.

unique(data$events)


 [1] Field Error         Flyout              Single             
 [4] Pop Out             Groundout           Double Play        
 [7] Lineout             Home Run            Double             
[10] Forceout            Grounded Into DP    Sac Fly            
[13] Triple              Fielders Choice Out Fielders Choice    
[16] Bunt Groundout      Sac Bunt            Sac Fly DP         
[19] Triple Play         Fan interference    Bunt Pop Out       
[22] Batter Interference
25 Levels: Batter Interference Bunt Groundout ... Sacrifice Bunt DP

The original classification from Tango’s site had only five levels — POP, GB, FLY, LD, HR — but we’ve got over 20. We’ll have to (a) restrict to columns that look like something we can classify and (b) convert them to the levels we’re after. Thanks to another tip I got from Googling, we can do it like this:

library(plyr)
data$events <- revalue(data$events, c("Pop Out"="Pop",
      "Bunt Pop Out"="Pop","Flyout"="Fly","Sac Fly"="Fly",
      "Bunt Groundout"="GB","Groundout"="GB","Grounded Into DP"="GB",
      "Lineout"="Liner","Home Run"="HR"))
# Take another look to be sure
unique(data$events)
# The data looks good except there are too many levels.  Let's re-factor
data$events <- factor(data$events)
# Re-index to be sure
rownames(data) <- NULL
# Make 100% sure!
str(data)

Oof! See how much work that was? We’re several dozen lines of code into this problem and we haven’t even started the machine learning yet! But that’s fine; the machine learning itself is the easy part. Let’s do that now.

library(caret)
inTrain <- createDataPartition(data$events,p=0.7,list=FALSE)
training <- data[inTrain,]
testing <- data[-inTrain,]

method <- 'rf' # sure, random forest again, why not
# train the model
ctrl <- trainControl(method = 'repeatedcv', number = 5, repeats = 5)
modelFit <- train(events ~ ., method=method, data=training, trControl=ctrl)

# Run the model on the test set
predicted <- predict(modelFit,newdata=testing)
# Check out the confusion matrix
confusionMatrix(predicted, testing$events)


Prediction   GB  Pop  Fly   HR Liner
     GB    9059    5    4    1   244
     Pop      3 1156  123    0    20
     Fly      6  152 5166  367   457
     HR       0    0  360 1182    85
     Liner  230   13  449   77  2299

We did it! And the confusion matrix looks pretty good. All we need to do now is view it, and we can make a very pretty visualization of this data with the amazing Plotly package for R:

#install.packages('plotly')
library(plotly)
# Exit velocities from 40 to 120
x <- seq(40,120,by=1)
# Hit angles from 10 to 50
y <- seq(10,50,by=1)
# Make a data frame of the relevant x and y values
plotDF <- data.frame(expand.grid(x,y))
# Add the correct column names
colnames(plotDF) <- c('hit_speed','hit_angle')
# Add the classification
plotPredictions <- predict(modelFit,newdata=plotDF)
plotDF$pred <- plotPredictions

p <- plot_ly(data=plotDF, x=~hit_speed, y = ~hit_angle, color=~pred, type="scatter", mode="markers") %>%
    layout(title = "Exit Velocity + Launch Angle = WIN")
p

View post on imgur.com


Awesome! It’s a *little* noisy, but overall not too bad. And it does kinda look like the original, which is reassuring.

That’s it! That’s all I have to say about machine learning. At this point, Google is your friend if you want to learn more. There are also some great classes online you can try, if you’re especially motivated. Enjoy, and I look forward to seeing what you can do with this!


Catchers, Points Leagues, and Z-Scores

STATEMENT:

Catchers are undervalued in points leagues based upon their ADP compared to the relative replacement value to their position.

BACKGROUND:

I play in a head-to-head points league with a pretty standard scoring system for hitters. Points leagues tends to be a little more straightforward than rotisserie leagues with projecting player value, because you can translate the projections directly into your scoring system. The end game is total points for the player, and it does not matter how they achieve it, whether through stolen bases or home runs etc. In an effort to gain a little insight into the total points rankings rather than just sort all players by points and draft off of that list, I’ve used z-scores to attempt to calculate the value of a player’s points relative to the positional average. I wanted to quantify how much value you may gain from drafting Carlos Correa at SS as opposed to Paul Goldschmidt at 1B, even though Goldschmidt is projected to score more points. This is not a particularly new concept, as there is  a great series articles written by Zach Sanders about it here: http://www.fangraphs.com/fantasy/value-above-replacement-part-one/ .

In calculating the z-scores based upon Steamer projections, I have found that the top three catchers (Posey, Sanchez, Lucroy) have a higher score than expected, and it would seem to place their actual value among the top 20 hitters overall, despite projected significantly fewer points than their peers, while maintaining an ADP anywhere from the 4th to 7th rounds. It would seem that it may be smart to exploit this value differential in points leagues.

WHY ARE THE TOP CATCHERS UNDERVALUED?

Based upon Steamer projections and using a standard points-league scoring system, the z-scores for Posey, Sanchez, Lucroy put their top-end value with players such as Manny Machado and Paul Goldschmidt, and the low-end value with Xander Bogaerts. Buster Posey has a z-score of 2.31, Gary Sanchez has a score of 1.36, and Jonathan Lucroy has a score of 0.75. You may disagree with the ranking of Sanchez over Lucroy etc., but the main takeaway is that there is significant value with the top three catchers, as the next-highest projected scoring is Stephen Vogt, who has a z-score of -.05.

In rotisserie leagues, catchers do not carry as much value, because while Gary Sanchez may be projected for 28 HRs and cost a 6th-round pick, you can wait 6-8 more rounds and draft a Yasmani Grandal and only lose a projected 8 HRs. In points leagues, the difference between Sanchez and Grandal might be close to 100 points. That is the difference between having Paul Goldschmidt or Brandon Belt as your starting 1B. For reference, here are the projections with z-scores for 1B and 3B. I used replacement values of 23 for 1B and 17 for 3B based upon this article: http://www.fangraphs.com/fantasy/value-above-replacement-part-two/

I am not advocating that, because of the numbers, you draft Posey over Rizzo or Sanchez over Bryant, because that would limit any potential value you may get by drafting Posey at his ADP. I also do not believe they carry as much value as those players despite the z-scores. I am just saying that, at least in points leagues, it may be time to reevaluate the value of the top catchers, compared to other positions. Having a Posey, Sanchez, or Lucroy in points leagues gives a significant value week to week in head-to-head leagues, or for total points. Additionally, there is added value in having a catcher like Posey or Sanchez, who also perform occasional 1B or DH duties, which increase their ABs and scoring potential. Ideally, with a top catcher, you are not playing musical chairs week to week at the position, hoping for good match-ups, only to end the week with a catcher who may have scored under 10 points.

Based upon projections and experience, points leagues tend to be fairly top-heavy with scoring, where the top five or so at each position hold significantly more value than they would in standard rotisserie leagues. That is because there are only 20-30 points separating the No. 6 3B from the No. 12 3B, and spaced out in 22 weeks in head-to-head points, it is a difference of 1-2 points per week.

CONCLUSION:

I do not believe you should be drafting Posey or Sanchez in the first two rounds in fantasy points leagues, because it would not be the most efficient way to accumulate valuable players. I do think that catchers are particularly undervalued in points leagues relative to their draft positions. In points leagues, it is more valuable to have a top-three player at a weak position than having the No. 6 player at a strong to average position, even if traditional wisdom may say to draft Freddie Freeman over Gary Sanchez, because points leagues tend to equalize scoring after the top few players.

So my advice is to ignore conventional wisdom that says wait on catchers, and disregard ADPs that put players like Freddie Freeman, Jose Abreu, Jonathan Villar and Xander Bogaerts over Gary Sanchez or Jonathan Lucroy.


Hardball Retrospective – What Might Have Been – The “Original” 1999 White Sox

In “Hardball Retrospective: Evaluating Scouting and Development Outcomes for the Modern-Era Franchises”, I placed every ballplayer in the modern era (from 1901-present) on their original team. I calculated revised standings for every season based entirely on the performance of each team’s “original” players. I discuss every team’s “original” players and seasons at length along with organizational performance with respect to the Amateur Draft (or First-Year Player Draft), amateur free agent signings and other methods of player acquisition.  Season standings, WAR and Win Shares totals for the “original” teams are compared against the “actual” team results to assess each franchise’s scouting, development and general management skills.

Expanding on my research for the book, the following series of articles will reveal the teams with the biggest single-season difference in the WAR and Win Shares for the “Original” vs. “Actual” rosters for every Major League organization. “Hardball Retrospective” is available in digital format on Amazon, Barnes and Noble, GooglePlay, iTunes and KoboBooks. The paperback edition is available on Amazon, Barnes and Noble and CreateSpace. Supplemental Statistics, Charts and Graphs along with a discussion forum are offered at TuataraSoftware.com.

Don Daglow (Intellivision World Series Major League Baseball, Earl Weaver Baseball, Tony LaRussa Baseball) contributed the foreword for Hardball Retrospective. The foreword and preview of my book are accessible here.

Terminology

OWAR – Wins Above Replacement for players on “original” teams

OWS – Win Shares for players on “original” teams

OPW% – Pythagorean Won-Loss record for the “original” teams

AWAR – Wins Above Replacement for players on “actual” teams

AWS – Win Shares for players on “actual” teams

APW% – Pythagorean Won-Loss record for the “actual” teams

Assessment

The 1999 Chicago White Sox 

OWAR: 45.1     OWS: 289     OPW%: .504     (82-80)

AWAR: 28.5      AWS: 225     APW%: .466     (75-86)

WARdiff: 16.6                        WSdiff: 64  

The “Original” 1999 White Sox tied the Royals for second place in the American League Central, eight games behind the Indians. Robin Ventura (.301/32/120) established career-highs in batting average and RBI while earning his sixth Gold Glove Award at the hot corner. Randy Velarde (.317/16/76) rapped 200 base knocks and set personal-bests in almost every offensive category. Mike Cameron drilled 34 doubles and pilfered 38 bags. Harold Baines (.312/25/103) topped the century mark in RBI for the third time in his career during his age-40 season. Ray Durham registered 109 tallies and swiped 34 bags. Magglio Ordonez (.301/30/117) scored 100 runs and merited his first All-Star invitation. Frank E. Thomas clubbed 36 two-baggers and delivered a .305 BA. Chris Singleton (.300/17/72) placed sixth in the AL Rookie of the Year balloting and Paul Konerko contributed 24 dingers and 81 ribbies for the “Actuals”.

Frank E. Thomas rated tenth among first basemen according to “The New Bill James Historical Baseball Abstract” top 100 player rankings. “Original” White Sox chronicled in the “NBJHBA” top 100 ratings include Robin Ventura (22nd-3B) and Harold Baines (42nd-RF).

  Original 1999 White Sox                          Actual 1999 White Sox

STARTING LINEUP POS OWAR OWS STARTING LINEUP POS OWAR OWS
Carlos Lee LF -0.04 10.36 Carlos Lee LF -0.04 10.36
Mike Cameron CF 3.63 21.44 Chris Singleton CF 2.61 16.33
Magglio Ordonez RF 1.7 18.56 Magglio Ordonez RF 1.7 18.56
Harold Baines DH 1.7 12.96 Frank E. Thomas DH 2.2 17.07
Frank E. Thomas 1B/DH 2.2 17.07 Paul Konerko 1B 1.45 14.68
Randy Velarde 2B 5.23 24.19 Ray Durham 2B 3.63 20.45
Liu Rodriguez SS/2B -0.12 1.41 Mike Caruso SS -2.58 4.25
Robin Ventura 3B 5.1 28.27 Greg Norton 3B 0.06 12.36
Mark Johnson C 0.28 6.12 Brook Fordyce C 1.59 11.45
BENCH POS OWAR OWS BENCH POS OWAR OWS
Ray Durham 2B 3.63 20.45 Mark Johnson C 0.28 6.12
Greg Norton 3B 0.06 12.36 Craig Wilson 3B -0.38 4.06
Olmedo Saenz 3B 1.35 8.68 Darrin Jackson LF -0.05 2.68
Craig Grebeck 2B 0.82 4.39 Brian Simmons LF -0.15 1.76
Craig Wilson 3B -0.38 4.06 Liu Rodriguez 2B -0.12 1.41
Brian Simmons LF -0.15 1.76 Jeff Liefer 1B -0.6 0.91
Jeff Liefer 1B -0.6 0.91 McKay Christensen CF -0.27 0.47
Norberto Martin 2B 0.09 0.44 Jason Dellaero SS -0.39 0.32
Jason Dellaero SS -0.39 0.32 Josh Paul C -0.09 0.27
Josh Paul C -0.09 0.27 Jeff Abbott LF -0.73 0.18
Robert Machado C -0.08 0.22
Chris Tremie C -0.18 0.18
Jeff Abbott LF -0.73 0.18
Frank Menechino SS -0.08 0.14
John Cangelosi LF -0.06 0.02

Mike Sirotka (11-13, 4.00) and James Baldwin (12-13, 5.00) labored through their second seasons in the Sox rotation. Alex Fernandez supplied a 7-8 record with a 3.38 ERA after missing the entire 1998 campaign due to injury. Bob Wickman notched 37 saves with an ERA of 3.39 for the “Originals” while Keith Foulke (2.22, 9 SV) and Bob Howry (3.59, 28 SV) secured late-inning leads for the “Actuals”.

  Original 1999 White Sox                       Actual 1999 White Sox 

ROTATION POS OWAR OWS ROTATION POS AWAR AWS
Mike Sirotka SP 3.94 13.5 Mike Sirotka SP 3.94 13.5
Alex Fernandez SP 3.34 10.47 James Baldwin SP 2.19 9.47
James Baldwin SP 2.19 9.47 Jim Parque SP 1.26 6.82
Brian Boehringer SP 1.64 6.91 Kip Wells SP 0.79 2.93
Jim Parque SP 1.26 6.82 Jaime Navarro SP -1.15 2.16
BULLPEN POS OWAR OWS BULLPEN POS AWAR AWS
Bob Wickman RP 1.33 10.19 Keith Foulke RP 3.86 16.7
Al Levine RP 0.77 6.84 Bob Howry RP 0.61 10.06
Pedro Borbon RP 0.36 4.11 Sean Lowe RP 1.58 7.94
Buddy Groom RP -0.27 3.49 Bill Simas RP 0.68 6.46
Steve Schrenk RP 0.54 3.04 Carlos Castillo SW 0.05 1.45
Kip Wells SP 0.79 2.93 John Snyder SP -0.97 1.22
Scott Radinsky RP 0 2.35 Tanyon Sturtze SP 0.48 0.91
Jason Bere SP -0.6 1.6 Pat Daneker SP 0.23 0.82
Carlos Castillo SW 0.05 1.45 Jesus Pena RP -0.27 0.42
Pat Daneker SP 0.23 0.82 Joe Davenport RP 0.13 0.25
Aaron Myette SP 0 0.11 Aaron Myette SP 0 0.11
Chad Bradford RP -0.5 0 Bryan Ward RP -1.15 0.09
John Hudek RP -1.04 0 Chad Bradford RP -0.5 0
David Lundquist RP -0.74 0 Scott Eyre RP -0.66 0
Jack McDowell SP -0.36 0 David Lundquist RP -0.74 0
Nerio Rodriguez RP -0.16 0 Todd Rizzo RP -0.11 0


Notable Transactions

Robin Ventura 

October 23, 1998: Granted Free Agency.

December 1, 1998: Signed as a Free Agent with the New York Mets. 

Randy Velarde

January 5, 1987: Traded by the Chicago White Sox with Pete Filson to the New York Yankees for Mike Soper (minors) and Scott Nielsen.

December 23, 1994: Granted Free Agency.

April 12, 1995: Signed as a Free Agent with the New York Yankees.

November 2, 1995: Granted Free Agency.

November 21, 1995: Signed as a Free Agent with the California Angels.

October 23, 1998: Granted Free Agency.

December 7, 1998: Signed as a Free Agent with the Anaheim Angels.

Mike Cameron

November 11, 1998: Traded by the Chicago White Sox to the Cincinnati Reds for Paul Konerko. 

Harold Baines

July 29, 1989: Traded by the Chicago White Sox with Fred Manrique to the Texas Rangers for Wilson Alvarez, Scott Fletcher and Sammy Sosa.

August 29, 1990: Traded by the Texas Rangers to the Oakland Athletics for players to be named later. The Oakland Athletics sent Joe Bitker (September 4, 1990) and Scott Chiamparino (September 4, 1990) to the Texas Rangers to complete the trade.

January 14, 1993: Traded by the Oakland Athletics to the Baltimore Orioles for Allen Plaster (minors) and Bobby Chouinard.

November 1, 1993: Granted Free Agency.

December 2, 1993: Signed as a Free Agent with the Baltimore Orioles.

October 20, 1994: Granted Free Agency.

December 23, 1994: Signed as a Free Agent with the Baltimore Orioles.

November 6, 1995: Granted Free Agency.

December 11, 1995: Signed as a Free Agent with the Chicago White Sox.

November 18, 1996: Granted Free Agency.

January 10, 1997: Signed as a Free Agent with the Chicago White Sox.

July 29, 1997: Traded by the Chicago White Sox to the Baltimore Orioles for a player to be named later. The Baltimore Orioles sent Juan Bautista (minors) (August 18, 1997) to the Chicago White Sox to complete the trade.

October 29, 1997: Granted Free Agency.

December 19, 1997: Signed as a Free Agent with the Baltimore Orioles.

Alex Fernandez 

December 7, 1996: Granted Free Agency.

December 9, 1996: Signed as a Free Agent with the Florida Marlins. 

Bob Wickman 

January 10, 1992: Traded by the Chicago White Sox with Domingo Jean and Melido Perez to the New York Yankees for Steve Sax.

August 23, 1996: Traded by the New York Yankees with Gerald Williams to the Milwaukee Brewers for a player to be named later, Pat Listach and Graeme Lloyd. The Milwaukee Brewers sent Ricky Bones (August 29, 1996) to the New York Yankees to complete the trade. Pat Listach returned to original team on October 2, 1996.

Honorable Mention

The 1932 Chicago White Sox 

OWAR: 21.5     OWS: 205     OPW%: .380     (58-96)

AWAR: 17.0      AWS: 147     APW%: .325     (49-102)

WARdiff: 4.5                        WSdiff: 58  

The cellar-dwelling “Original” 1932 White Sox fared better than their “Actual” counterparts in terms of team WAR, Win Shares and winning percentage. Although the “Actuals” recorded only 49 victories, the team finished in seventh place ahead of the miserable Red Sox (43-111). Willie Kamm clubbed 34 doubles, delivered a .286 BA and drove in 83 baserunners for the Pale Hose. Second-sacker Bill Cissell posted career-bests in batting average (.315), runs (85), hits (184), doubles (36), home runs (7) and RBI (98). Rookie right fielder Bruce Campbell (.286/14/87) contributed 36 two-baggers and 11 three-base hits. Smead “Smudge” Jolley (.312/18/106) drilled 30 doubles while outfield mate Carl Reynolds produced a .305 BA. Luke Appling aka “Old Aches and Pains” rewarded the Chicago brass with 20 two-base hits and 10 triples after achieving full-time status. Ted Lyons completed 19 of 26 starts and furnished an ERA of 3.28.

On Deck

What Might Have Been – The “Original” 2001 Rangers

References and Resources

Baseball America – Executive Database

Baseball-Reference

James, Bill. The New Bill James Historical Baseball Abstract. New York, NY.: The Free Press, 2001. Print.

James, Bill, with Jim Henzler. Win Shares. Morton Grove, Ill.: STATS, 2002. Print.

Retrosheet – Transactions Database

The information used here was obtained free of charge from and is copyrighted by Retrosheet. Interested parties may contact Retrosheet at “www.retrosheet.org”.

Seamheads – Baseball Gauge

Sean Lahman Baseball Archive