Merrill Kelly: A Mid-Rotation Starter in Korea

How many teams are looking for a cheap starting pitcher to be a veteran presence for a young rotation? Looking for an upgrade over what they currently have for starting pitching? Or just need a warm body to fill the hole left by Joe Ross with someone not named Edwin Jackson? As far as I can tell, 10 teams are looking for a 3/4 starter such as Merrill Kelly, especially considering his stats that he has accumulated in this season (maybe he’ll get one more start to add to his excellent season so far) have been particularly impressive. All this when the Rays thought that Merrill Kelly was just a “AAA starter” who could be a bullpen guy in the big leagues.

Merrill Kelly in the minor leagues was a solid minor leaguer who would become a swingman with the Durham Bulls. In his age-25 season, he went 9-4 in 114 IP with a 2.76 ERA, a 3.74 FIP, and a 3.57 xFIP. Which looked good with his 8.53 K/9 and 2.92 BB/9, a .298 BABIP, and a 47.9% ground-ball rate as well. Perhaps he could a solid swingman/fifth starter in the big leagues. The Rays apparently thought otherwise and said either he’d be a bullpen pitcher for the MLB team or a starter in AAA. Merrill Kelly thought otherwise and went to South Korea to play for the SK Wyverns.

Merrill Kelly in South Korea was all right in his first season, with an 11-10 record in 30 games (29 starts), 181 IP, and an ERA of 4.13. With peripheral rates that weren’t as good (6.91 K/9 and 2.69 BB/9). His next season was similar, with a 9-8 record in 31 games, but a great 200 1/3 IP with similar rate stats: 3.68 ERA, 6.83 K/9, and 2.70 BB/9. This year has been very different for him, with a 15-7 record in 29 games and 185 IP with a 3.65 ERA; his rate stats are much more improved, at 8.90 K/9 and 2.14 BB/9.

What is he doing differently to get these improved stats? Why is his ERA as high as it is, despite getting more strikeouts and walking fewer batters? He is allowing more pesky little hits: that is, his defense is not getting as many outs made as it should (1.08 hits per inning this year, vs 1.03 hits per inning in 2015-2016 combined). He has also allowed one more homer and two more doubles than last year, in 15 1/3 fewer IP.

His repertoire:

-4 Seam Fastball – 92-94 MPH (back in 2015, he was throwing 88-91 MPH)

-2 Seam Fastball – couple of miles slower and has slight sink, and runs in an opposite direction. He mixes this pitch well with his fastball

-Cutter – He started to throw this pitch more once he got to Korea and has mixed it well with his other fastballs and change

-Slider – Has a good slider that can break sharply when he’s pitching well. About 83-87 MPH

-Curveball – Decent enough curve but probably not his best pitch. Up 78-80 MPH

-Circle Changeup – Good sinking and running movement. He throws it about 85 MPH. One of his top pitches

What has he improved? Velocity on his pitches, sharper movement to his fastballs and changeup, getting better with the cutter, and improving his control. (This quoted from this article on Reddit: Merrill Kelly scouting report and info, which I think explains his improvements, but I disagree with his assessment of Merrill Kelly’s talent.) Given the talent level of the average hitter in the KBO is around AAA level, he should be able to perform as around a low-3/high-4 starter, as I’d say he is better than the average starter. A funny thing of note is that the Rays have another version of Merrill Kelly named Ryan Yarbrough, who has pitched better than Kelly did at a similar age; hopefully they’ll give him a chance to prove the Rays wrong for letting Merrill Kelly go.

Since he is on the right side of 30 and will pitch the 2018 season at age 29, I’d offer him a three-year deal worth $6 million per year with incentives that could boost the value of the deal to around $24 million over three years, with an option for a fourth season at $7 million (buyout of $2 million) with incentives to boost the option value to $10 million. This is due to his risk, and likely lower than what Phil Hughes was offered after the 2013 season from the Twins.

Who are the 10 teams that could use Merrill Kelly as a starting pitcher? The answers might be more surprising at first glance than other answers. The best choice would be the Miami Marlins for the same reasons listed, but it could become a wild-card contender taking a chance for Kelly to make more money in a playoff cut. The second-best choice is one that is pretty questionable, depending on whether the Nationals are willing to take a risk on a player from the KBO and whether they want someone better than him. But he’d be great for them in place of Joe Ross, and would be an upgrade over their current options; plus he would be cheap enough to fit in their payroll. One issue is that the Nationals have a hitter-friendly park, but not having to face the Nationals would mitigate some of those concerns. The San Diego Padres would be the third-best choice due to the non-DH league, an extremely pitcher-friendly park according to MLB park factors, and multiple available rotation spots, but they are in a tough NL West and aren’t likely to be a playoff team.

The next one is questionable but they would certainly be able to make room for him — the Oakland A’s have always been unconventional, and the park is usually known for being pitcher-friendly. The Twins would be similar to the A’s in those respects and are in fact a playoff threat (I didn’t expect to be saying this about the Twins this year at all). The Royals are practically in a tie with the Twins and A’s due to a pitcher-friendly park, although their team is going to be worse due to many key players leaving (Cain, Hosmer, and Moustakas).

Despite the Rangers having a definite hole in the rotation (who would let Nick Martinez or A.J. Griffin start in an extreme hitter-friendly park?), they are the seventh-best option due to that park, the DH league, and just not having a great team in general. The White Sox are an even more extreme version of the Rangers, and are extremely bad as well; I doubt he’d want to play for such a poor team. Same with the Reds, except there is no DH, but the Reds might want to give younger options a try first. The Orioles have almost all the bad factors: A league with a DH, a hitter-friendly park, a tough division, a bad defensive team, and generally bad development staff that has done more harm than good for its pitchers.

I would love to see one of the top six teams sign Kelly to a contract, since those would be best for him getting another contract after the first one expires. Can’t wait for him to get his shot in the big leagues, to prove his previous doubters wrong, and to have a long and successful career in the MLB.

All stats are owned by their respective owners (ESPN, FanGraphs, KBO, Reddit), I own none of the stats used. All stats are as of 9-23-2017.


A Lost Member of the Fly-Ball Revolution

We’ve seen names like Francisco Lindor, Yonder Alonso, and, of course, Josh Donaldson associated with the fly-ball revolution constantly. But one of the most underrated breakouts of 2017 has come from the launch-angle craze: Marwin Gonzalez.

If you were familiar with him before 2017, it was almost certainly because of his defensive versatility. Gonzalez has never been much of a force, but the ability to play the entire infield and outfield corner spots earned him consistent playing time in the past. He’s no longer lacking in the offensive department.

Gonzalez is slashing .302/.371/.531 and has more than doubled his 2016 walk rate, while keeping his strikeout rates steady, en route to a 142 wRC+. Names like Jose Altuve, Carlos Correa, George Springer, and Josh Reddick are the first that come to mind with the Astros. But Gonzalez ranks 3rd in batting average, 2nd in wOBA, and 2nd in wRC+. He leads one of the best offenses in major-league history in runs batted in, despite six players having more plate appearances.

Here is his exit velocity and launch angle by year, stretching back to 2015 (when Statcast started measuring):

Year Avg. Exit Velo Launch Angle
2015 86.5 9.1
2016 86.3 6.5
2017 88.6 13.1

Gonzalez has seen a massive uptick in his launch angle this season, and, like the other successful members of the launch-angle increase, has seen a massive uptick in power. With 23 home runs, he has ten more than last season.

Interestingly, with the home-run increase, Gonzalez has increased his use of all fields. His Oppo% is up to 25% from 18% in 2016. But only two home runs have been to the opposite field (he’s a switch hitter, so a basic spray chart won’t show this). He’s displaying the ability to turn on the balls he can crush and adapting better to the ones he cannot.

Just Monday night, September 25th, Gonzalez put this on full display in a four-hit night against the Texas Rangers. Here’s a two-run single:

Gonzalez gets low and adapts to the pitch location, sending it straight back up the middle. Now here he is, a couple at-bats later:

Gonzalez sees a pitch he can hit hard, and does just that, obliterating this ball (sending it 443 feet at 108.1 mph, exactly).

Using all fields while maintaining pull power is a hard skill to master, but one Gonzalez has mastered no less. He has mastered hitting the balls well that he can hit well. His 19 line-drive base hits are tied for 24th in the league, but his 19.8% LD% ranks 98th. He is 287th in average ground-ball exit velocity at 82.3, but 110th in average line-drive/fly-ball exit velocity at 93.9 mph. This is likely what skews his xwOBA-wOBA numbers, which peg him for a much less impressive performance. He’s not hitting everything harder, but he is hitting what he should hit hard harder. And with the increased launch angle, he’s only hitting more and more line drives and fly balls.

Gonzalez has stayed out of the national spotlight despite being one of the most consistent and best players on the league’s best offense. Don’t be surprised to see him explode in the national spotlight.


Jonathan Lucroy, the Rockie, Is Baseball’s Best Contact Hitter

It’s no secret that Jonathan Lucroy is having a subpar season.

The two-time NL All Star was projected to be a top-three catcher in 2017.  Before the start of the season, Steamer pegged his value at 3.6 wins above replacement, while ZiPS had him at 3.2.  His .242/.297/.338 line and 66 wRC+ in 306 plate appearances as a member of the Texas Rangers produced 0.2 WAR.  No one really expected that.

Lucroy was eventually traded to the Colorado Rockies.  The Rockies, who had the worst catching tandem in baseball, instantly viewed Lucroy as an upgrade, while many other playoff-bound teams would have viewed him as a liability.  With the hitter-friendly environment of Coors Field and poor pitching staffs among the San Francisco Giants and San Diego Padres, the team figured that Lucroy would return to his All-Star form once again.  Although he has not returned to being the power threat that he once was, he has changed his game ever so slightly, such that he might have become the game’s best-hitting catcher.

His basic stat line is not reflective of his plate discipline as a member of the Rockies.  His slash line has gone back up to near his career average (.279/.384/.377), but what is most impressive about him is his actual hitting ability.  Always a good contact hitter, he has changed his game to be more selective, get more contact, and put the ball in play.  His 92 percent contact percentage ranks first in baseball since the trade, and his 88 percent contact percentage of pitches outside the strike zone also ranks first.  The result: a high walk rate (12.3 percent) and fewer swinging strikeouts (6.3 percent of plate appearances resulting in a strikeout).  All of this while swinging at fewer pitches outside the strike zone (18.6 percent) and fewer swings in general (38 percent).  You may be asking “Why isn’t he leading the league in hitting with numbers like that?”  Well, the answer is rather simple.

While he is making more contact than anyone in baseball, most of the balls in play are hit to the defense.  This season, he is hitting more ground balls than ever before.  As a Rockie, 50 percent of the balls he has hit in play have been ground balls, well above his career average of 42.8 percent.  As a result, he has hit fewer fly balls (28.7 percent) which has led to fewer home runs (3.2 percent HR/FB).  This explains his lack of power this year.

He has hit the ball in the wrong place more this season than any other.  For his career, Lucroy has had a tendency to drive the ball up the middle — that has not changed much this season — but this season he has hit the ball softer than in any previous season.  His average exit velocity (85.0 miles per hour) is more in line with middle infielders and outfielders than catchers.  In fact, he has the fourth-slowest average exit velocity among all qualified catchers.  His average exit velocity last season was 87.6 miles per hour, and it was 88.6 in 2015.  Without the wheels of a speedy outfielder or infielder capable of beating out a ground ball (or at the very least forcing the defense to rush the throw), a ground ball for Lucroy is as good as an out.  Just as the saying “baseball is a game of inches,” it’s a game of miles per hour, too.

Fewer ground balls are going through the holes in the infield, and fewer ground balls are becoming hits.  His batting average of balls in play as a Rockie is similar to his career average (.308 as a Rockie and .306 for his career), but his RBBIP — percentage of balls in play that go for a hit or an error — is .318.  While it is above league average, it is well below his RBBIP numbers of both his All Star seasons and 2012, when he hit .320.  Has Lucroy been entirely unlucky with his balls in play?  No; pitchers have pitched to him largely down and away, which has resulted in a horrible contact percentage on those pitches, and he has also regressed slightly in every season since 2015.  But if Lucroy can keep his contact percentage up, hit fewer ground balls, and stay selective at the plate, then he could be one of the best-hitting catchers in the game again.


Is Z-O Swing% a Better Indicator of Plate Discipline Than O-Swing%?

In some FanGraphs articles, Z-O swing percentage is thrown around as a measure of plate discipline. That makes sense because generally when a hitter swings at strikes, good things happen, and if he swings at balls, bad things happen.

To test if that stat is really better, I looked at the 2017 leaderboard. I looked at the wRC+ of the top 30 and bottom 30 hitters with Z-swing%, O-swing%, and Z-O swing%. Here is what I found:

wRC+
z-o swing z swing o swing
top30 122 112 122
bot30 103 105 96
all qualified 110 110 110

There is a slightly positive effect of Z-swing, but a much stronger effect of both Z-O swing% and O swing%. At the top, the low-chaser and high-differential guys do about the same, while the bottom chasers do even worse than the bottom differential guys.

If you widen the search for top half and bottom half you get that picture:

z-o swing z swing o swing
119 110 117
102 110 103
110 110 110

Z-swing has no effect at all, and the differential is slightly better than the chase rate, but not by much.

Overall, the Pearson value for differential was a positive .42, for the chase rate it was .32 (used 100 – O-swing% to get positive value), and for Z-swing there was almost no effect (.07). So the differential is a bit better, but the effect isn’t huge; it is probably like with OPS+ and wRC+ where one is mathematically more elegant and correct but the actual values won’t differ much.

I also dissected the hitting into the components OPB, ISO and BABIP.


ISO
z-o swing z swing o swing
top30 .220 .210 .200
bot30 .170 .180 .163
all qualified .193 .193 .193
OBP
z-o swing z swing o swing
top30 .360 .335 .370
bot30 .324 .350 .317
all qualified .341 .341 .341
BABIP
z-o swing z swing o swing
top30 .308 .309 .306
bot30 .304 .303 .306
all qualified .306 .306 .306

The result is quite interesting. The differential (+27 ISO points) does clearly better in the power department than chase rate (+7); in fact, even Z-swing had a more positive effect (+17) on power than a low chase rate.

With OBP, that is reversed. Here, the chase group does better than the differential group, while a high Z-swing rate has a negative effect.

With BABIP there was a very small positive effect of differential and Z-swing, and no effect of the chase rate, but the effects are almost non-existent.

So we seem to have two opposing effects here. Being more aggressive in the zone helps the power but seems to slightly hurt the OBP (of course there probably is a bias that aggressive hitters in the zone are often also aggressive outside, but still). And for OBP, chase rate clearly is king, while it doesn’t really have an effect on power.

Still, that might have an effect for certain hitters and especially pitchers, but overall the advantage doesn’t seem to be big, even though it is a bit due to coincidence due to the opposing effects.


The Mets Should Trade Noah Syndergaard

Thor’s lat tear was the team’s biggest disappointment in 2017, a season that’s been chock-full of frustration and futility.

It was more demoralizing than the poor winning percentage. More displeasing than a certain player’s disappearance. And even more disheartening than the injuries en masse.

The fall of the Mets’ burgeoning ace is so distressing because it raised alarms about the future of their starting rotation. It’s now uncertain whether Noah Syndergaard, the pitcher once dubbed the second coming of Nolan Ryan, can play a significant role – let alone become the successor to Tom Seaver and Dwight Gooden.

How should the Mets deal with this situation? Though unpopular, there’s only one pragmatic solution: hope for a full recovery, let him recoup value, and trade him before future injuries occur.

Wait – trade him? Wouldn’t it make more sense if they gave such a tremendous talent the opportunity to fix his problems before they press panic button?

Sadly, it’s not quite that simple.

Syndergaard’s issues are so deeply rooted that he’s probably going to get hurt again.

And again.

And again.

Two core components of his skill set are the likely culprits of these injuries, and both are difficult to cure – at least without harming his effectiveness.

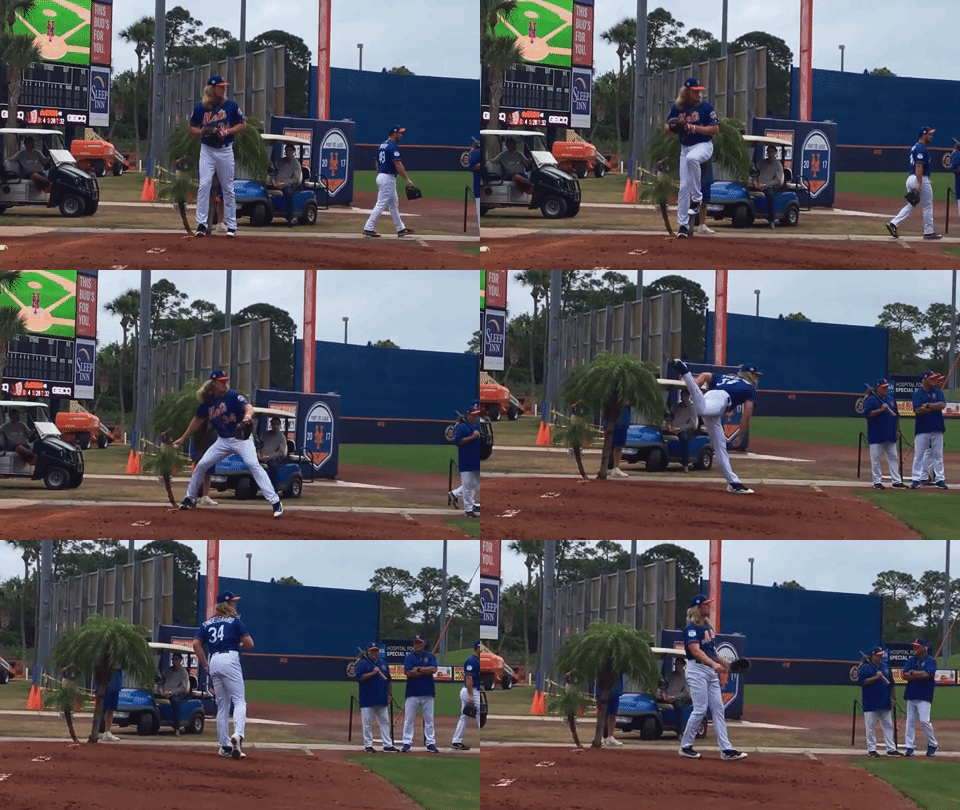
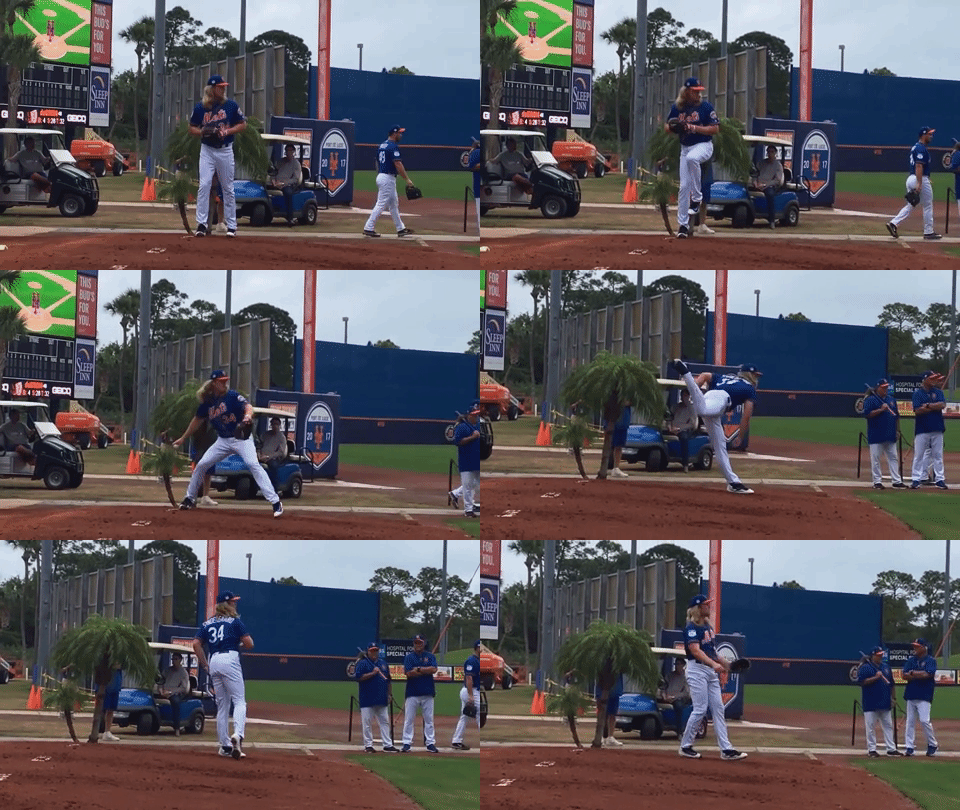
The first is Thor’s throwing motion. In the GIF below, you can see how he relies heavily on his golden arm when delivering a pitch:

At first glance, these mechanics appear quick, straightforward, and minimalistic. But also arm-dependent. If you look more closely, you won’t spot a single movement that attempts to alleviate the immense stress placed on his right wing. Not one.

You don’t see Syndergaard use a high leg kick or take a long stride. Nor do you notice him place substantial weight on his right leg when pushing off the rubber. You can’t observe him rotate his hips fully. And you won’t find too much torque in his upper body.

In short, he utilizes none of the mechanics that generate substantial velocity from his legs, hips, and core. Instead, you witness Thor gain most of his power from a sudden, violent contortion of his back and a quick snap of his almighty arm.

Needless to say, this delivery taxes his right wing…exorbitantly. On every single pitch.

But that’s not all. You also glimpse a slight timing problem that’s already become a ticking time bomb:

Syndergaard’s throwing arm is practically parallel to the ground when he plants his left foot. Then – before raising it to the cocked position – he rotates his hips and accelerates all components of his upper body, actions that place additional stress on his elbow and shoulder.

Mechanics of this sort, both arm-dependent and off-time, significantly increase his chances of getting hurt in the future…and that his afflictions will be far more severe than a torn lat.

The second cause of Thor’s injuries tilts those odds even further. That’s his max-effort pitching style. He looks to dominate batters with a repertoire of five overpowering pitches and, as you can see, holds nothing back:

Noah Syndergaard Average Velocity (MPH), 2015-2017
Pitch Type 2015 2016 2017 Avg MLB Avg
Four-Seam FB 97.72 98.64 98.70 98.23 93.17
Sinker 97.69 98.52 97.99 98.11 91.67
Slider 87.86 91.42 92.27 91.27 84.77
Changeup 88.83 90.31 90.06 89.61 84.13
Curveball 81.21 82.95 84.25 81.91 78.14
OVERALL 92.63 94.83 93.93 93.85 88.52
SOURCE: Baseball Savant/Statcast/PITCHf/x

Both fastballs routinely register around 98 MPH, and his slider and changeup hover about or above 90 MPH. Each one is at least 5 MPH faster than league average and is among the hardest thrown by any starting pitcher. Even his curveball, the “slowest” of the group, is well above the 78.14 MPH mean.

But something sinister lurks beneath these awe-inspiring averages. And that’s the not-so-subtle implication that Thor competes on stuff alone.

There’s neither an inkling that he paces himself nor an indication that he uses complex pitching strategies – at least not to any meaningful degree. Au contraire. From the looks of it, he throws as hard as physically possible all game long. Nothing more, nothing less.

Such an explosive approach requires Thor to exert himself fully on every single pitch he throws. This places additional strain on his elbow and shoulder, accelerates the damage inflicted by his delivery, and dramatically increases his chances of developing major arm problems.

Making matters worse, the two reasons for his injury are incredibly difficult to fix without breaking something else, namely his dominating performance.

Which is exactly why the Mets should move their star pitcher.

Noah Syndergaard is still a blue-chip asset with great trade value. You’d be hard-pressed to find another starter whose repertoire resembles that of an elite closer…let alone one who just turned 25 and won’t be a free agent until 2022.

That combination of unique ability, extraordinary upside, and relatively low financial risk makes him an attractive target despite his injury and its causes. As such, the team would probably acquire several top prospects in return for their ace.

If he’s able to put together a healthy season (or half-season), they should shop him around and pull the trigger on the best deal they find. Otherwise, it’s likely that a catastrophic arm injury will compromise his value; they’d never be able to swap him for anything meaningful again.

Should that day of reckoning arrive, the Mets will be forced to admit that they have another Matt Harvey on their hands: a supremely talented, though fundamentally flawed pitcher whom they should have traded before it was too late.


Reliever Buy-Low: Craig Stammen

Any team need a reliever who can pitch multiple-inning stints if you need? I think lots of teams would jump at the chance to acquire such a reliever considering Madison Bumgarner’s legendary five-inning relief appearance in Game 7 of the 2014 World Series. Andrew Miller became a dangerous bullpen weapon in the 2016 postseason with the Indians, which brought them within a game of winning the World Series in three consecutive games. And there’s some guy on the Astros called Chris Devenski, who could also spot start if you need a starter desperately. The Blue Jays acquired Tom Koehler from the Marlins, who I admittedly have some interest in as a starter or multi-inning reliever. Maybe you want someone like Raisel Iglesias or Michael Lorenzen.

Currently, most relievers are used in one-inning stints; some are even used against lefties or righties only. Christian Bethancourt, Chris Gimenez, and Jordan Schafer have been two-way players: a hitter and a reliever to give more bench depth and help keep Rule 5 draft picks. Some top prospects have been billed as two-way players such as Brandon McKay, Hunter Greene and most notably Shohei Otani, who has been fantastic in Japan.

The reliever who should be receiving more attention as a multiple-inning reliever is Craig Stammen, who used to be a part of the Nationals as a starter and was then converted into a reliever when he was called up from AAA in 2011. Stammen was doing pretty well from 2012-2014 as a setup reliever, but then he missed most of 2015 and didn’t make it back to the big leagues until this season. As a result of him previously having been a starter for much longer, he has more stamina than an average reliever, and can be used in multiple-inning relief stints, providing more bench depth for a team like the effect of having a two-way player (even if they aren’t very good).

This year, he has been getting back to what he was doing before in terms of his ERA, strikeout and walk rates, and innings per appearance. His home-runs, however, have gone up quite a bit despite his 52.2% ground-ball rate. This is due to an unsustainable 19.4% HR/FB ratio(!), which has overly inflated his FIP to 4.34, with a much more appealing 3.75 xFIP and a 3.60 SIERA, which suggest a solid middle relief/ setup type of reliever that he has been performing like. This and his ability to pitch multiple-inning stints create a higher value than his $900,000 contract. He has four pitches with positive values according to Pitch Info this year. Despite minute velocity drops for his pitches from his peak years of 2012-2014, he is still very effective with his pitches, with only one registering a slight negative according to Pitch Info.

Admittedly, his BABIP is a bit lower than it should be at .254, but it shouldn’t regress too badly (somewhere around .280 since he does generate quite a few ground balls). He is only getting about 6.7% pop-ups, which is not very good, compared to his peak seasons. Batters are getting more hard contact this year compared to the rest of his career (30.1% this year compared to 28.5% for his career). And his strand rate is at 85.7% this year, compared to just a 71.9% career mark. Additionally, he has allowed a .329 wOBA against lefties this year vs a .256 wOBA vs righties.

Overall, Stammen has been lucky and unlucky this year. Ultimately, he is a solid reliever who should be able to do quite well in almost any park except Coors Field or any extreme hitters park. He should receive a two-year deal worth around $4-5 million per year for how well he can pitch as a solid multiple-inning reliever, and how he can help increase bench depth for a team that wants to keep a Rule 5 talent, an extra bench player, a normal reliever, or maybe a specialized reliever such as a LOOGY (looking at you, Randy Choate, Brian Shouse, and so many more who have made careers out of being LOOGYs). The former two are much more likely than the latter two — particularly a LOOGY, as most aren’t as useful to teams anymore.

All stats and links are owned by FanGraphs, except for the link to Shohei Otani’s player page, which is owned by the NPB.


Overall Pitch Data

This is the final part of my pitch-ranking data. Let’s start with the top 25 overall pitches, starters and relievers combined.

Top Pitches:

Position Pitch Player Sw+Whf% Sw+Whf% Z xwOBA xwOBA Z Z Total
SP 4-Seam Chris Sale 85.89 3.08 0.24 2.86 5.94
SP Curveball Corey Kluber 109.61 3.16 0.12 2.26 5.42
SP Changeup Stephen Strasburg 104.30 2.31 0.15 2.76 5.07
SP 4-Seam Jacob deGrom 83.06 2.68 0.27 2.13 4.81
SP Slider Carlos Carrasco 108.62 2.51 0.15 2.06 4.56
RP 4-Seam Craig Kimbrel 94.74 2.34 0.23 1.80 4.15
RP 4-Seam Sean Doolittle 90.81 1.91 0.22 2.02 3.93
SP Slider Max Scherzer 104.66 2.10 0.17 1.79 3.89
RP 4-Seam Chad Green 85.35 1.30 0.20 2.57 3.87
SP Cutter James Paxton 89.03 1.81 0.20 2.03 3.84
SP Changeup Luis Castillo 97.25 1.46 0.18 2.27 3.73
SP Sinker Trevor Williams 68.72 1.87 0.30 1.73 3.61
SP 2-Seam Sonny Gray 72.12 2.18 0.30 1.39 3.57
RP Slider Roberto Osuna 108.02 1.97 0.16 1.52 3.49
SP 4-Seam Jose Berrios 74.74 1.51 0.27 1.97 3.48
SP 2-Seam Jaime Garcia 67.96 1.49 0.28 1.97 3.46
RP Slider Arodys Vizcaino 105.81 1.78 0.16 1.54 3.32
SP Cutter Corey Kluber 97.90 2.82 0.28 0.48 3.30
SP Slider Sonny Gray 97.27 1.35 0.16 1.87 3.22
RP Cutter Jacob Barnes 104.09 1.99 0.22 1.21 3.20
SP 2-Seam David Price 72.83 2.29 0.32 0.86 3.15
SP 4-Seam Jimmy Nelson 76.65 1.78 0.30 1.34 3.12
SP Changeup Danny Salazar 102.60 2.11 0.23 1.01 3.12
SP Cutter Tyler Chatwood 84.08 1.25 0.21 1.81 3.06
RP Slider Raisel Iglesias 98.47 1.13 0.14 1.93 3.06

We have two pitchers that show up twice — Corey Kluber and Sonny Gray. Kluber has arguably been the best pitcher in baseball in 2017, so that is unsurprising. However, Gray as his only two-pitch counterpart is unexpected. Gray is by no means a poor pitcher, but not the same level as Kluber. Jaime Garcia and Tyler Chatwood are the only guys on this list who jump out as poor pitchers, in 2017 at least. Luis Castillo and Jacob Barnes are probably the only guys on this list who are completely unfamiliar for most. Castillo’s future looks bright, where Barnes looks less significant.

I’m sure some have been wondering: What are the worst pitches?

Applying some context, these are certainly not the worst pitches in the game. Just the worst thrown consistently. Every pitch had to reach a minimum number of times thrown to reach this list. These are not the absolute worst pitches in the game, but make no mistake, they are still truly awful. The bottom ten of over 700 pitches. Anyway, here are the ten worst that I measured:

Position Pitch Player xwOBA xwOBA Z Sw+Whf% Sw+Whf% Z Z Total
RP 4-Seam Justin Grimm 0.457 -3.16 55.67 -1.98 -5.14
SP Slider Kevin Gausman 0.428 -3.23 68.95 -1.52 -4.75
SP Changeup Mike Leake 0.344 -1.47 61.34 -2.87 -4.33
RP Curveball Dellin Betances 0.405 -2.99 66.16 -1.33 -4.32
RP 4-Seam Warwick Saupold 0.397 -1.85 53.32 -2.24 -4.09
RP Slider Jason Grilli 0.355 -2.19 67.13 -1.65 -3.83
SP Curveball Jordan Zimmermann 0.401 -2.64 60.79 -1.19 -3.83
SP Slider Johnny Cueto 0.337 -1.49 61.61 -2.27 -3.76
SP 2-Seam Paul Blackburn 0.402 -1.21 44.28 -2.43 -3.64
RP 4-Seam Mike Montgomery 0.36 -1.04 50.43 -2.56 -3.60

Two names jump out immediately in that list. Dellin Betances and Johnny Cueto. However, considering the widely-known struggles of those two, it’s not nearly as shocking as it might have been last year. Justin Grimm has been downright atrocious, so it’s fitting to see him there. The same goes for Jason Grilli. And Jordan Zimmermann. Kevin Gausman was awful, but has turned it around. Mike Leake has done the exact opposite of that. This is the first time I have seen Warwick Saupold and Paul Blackburn on a list of any kind, good or bad. Blackburn has actually been solid in a small sample for the A’s in his rookie year. Montgomery has continued to provide quality long-relief innings and spot starts for the Cubs.

This was just my first trial run playing around with pitch values. I will continue to work towards a better formula and continue to post in the future. I will post the Excel file with all the pitches and data I used for calculations. Feel free to add, but please don’t change or delete any of the original information.

Pitch Data Excel File


Relief Pitcher Pitch Rankings

To follow the starting pitchers, we have the relief pitcher pitch rankings.

1. Top Ten Four-Seam Fastball (Min 300):

Player Sw+Whf% Sw+Whf% Z xwOBA xwOBA Z Z Total
Craig Kimbrel 94.74 2.34 0.23 1.80 4.15
Sean Doolittle 90.81 1.91 0.22 2.02 3.93
Chad Green 85.35 1.30 0.20 2.57 3.87
Anthony Swarzak 78.77 0.58 0.20 2.37 2.95
Josh Fields 89.12 1.72 0.27 0.89 2.61
Pedro Baez 90.00 1.82 0.28 0.78 2.60
Tommy Kahnle 84.53 1.21 0.25 1.34 2.56
Drew Steckenrider 84.55 1.21 0.26 1.13 2.34
Seung Hwan Oh 80.80 0.80 0.24 1.50 2.30
Josh Hader 87.30 1.52 0.28 0.67 2.19

The Stars: Craig Kimbrel, Sean Doolittle, Pedro Baez

Young and Coming: Chad Green, Drew Steckenrider, Josh Hader

Surprises: Anthony Swarzak, Josh Fields, Tommy Kahnle

No surprise that Kimbrel, probably the most dominant reliever of the past few years, is at the top. Jeff Sullivan discussed Green’s immense success overall and of his fastball recently in his second year for the Yankees. Steckenrider is an unknown rookie for the Marlins, but he has been exceptional for them. Hader is a top prospect for the Brewers and future starter, but his stint in the bullpen has gone perfectly. Swarzak is having a career year, so much so that the Brewers traded for him in an attempt to contend. Kahnle has broken out with the White Sox and Yankees.

2. Top Five Two-Seam Fastball (Min 250):

Player Sw+Whf% Sw+Whf% Z xwOBA xwOBA Z Z Total
Craig Stammen 67.73 0.49 0.25 1.95 2.44
Kelvin Herrera 81.71 2.71 0.36 -0.52 2.18
Edwin Diaz 75.76 1.76 0.32 0.42 2.18
Joe Kelly 72.95 1.32 0.30 0.79 2.11
Ryan Madson 68.80 0.66 0.28 1.23 1.89

The Stars: Kelvin Herrera, Ryan Madson

Young and Coming: Edwin Diaz

Surprises: Craig Stammen, Joe Kelly

Herrera has been mostly terrible this year, but his track record says he is still a star. And he clearly hasn’t lost anything from his two-seam fastball. Diaz dominated as a rookie, but has slowed down a lot this season. He’s still 23 — no reason to worry. Stammen didn’t even pitch in the MLB in 2016, but he is performing solidly for the Padres. Kelly is having a career year in Boston behind his high-heat fastball.

3. Top Five Cutter Fastball (Min 200):

Player Sw+Whf% Sw+Whf% Z xwOBA xwOBA Z Z Total
Jacob Barnes 104.09 1.99 0.22 1.21 3.20
Dominic Leone 99.80 1.62 0.24 0.81 2.43
Kenley Jansen 90.61 0.84 0.22 1.38 2.21
Alex Colome 85.15 0.37 0.20 1.80 2.17
Tommy Hunter 88.07 0.62 0.22 1.32 1.94

The Stars: Kenley Jansen, Alex Colome

Young and Coming: None

Surprises: Dominic Leone, Jacob Barnes, Tommy Hunter

The most infamous cutter in the game makes the top five, coming from Dodgers closer Jansen. Colome has continued a breakout from 2016 as the Rays closer. Leone had a great rookie season for the Mariners in 2014, but was knocked around in 2015/2016. He has come back nicely in 2017.

4. Top Five Sinker Fastball (Min 200):

Player Sw+Whf% Sw+Whf% Z xwOBA xwOBA Z Z Total
Pat Neshek 70.87 1.06 0.25 1.66 2.72
Matt Albers 66.94 0.58 0.24 1.96 2.54
Tony Watson 73.58 1.40 0.28 1.10 2.50
Scott Alexander 76.57 1.77 0.30 0.47 2.24
Richard Bleier 65.97 0.46 0.25 1.68 2.14

The Stars: Pat Neshek

Young and Coming: None

Surprises: Richard Bleier

Neshek, a two-time All-Star, has been spectacular for the Phillies. Bleier, a 30-year-old second-year player, has been unexpectedly good in the majors the past two years.

5. Top Two Splitter Fastball (Min 200):

Player Sw+Whf% Sw+Whf% Z xwOBA xwOBA Z Z Total
Blake Parker 101.30 1.30 0.18 1.48 2.78
Chasen Shreve 97.50 0.79 0.18 1.48 2.27

Only nine relievers heavily used the splitter, so this is a small leaderboard. Parker has broken out for the Angels in 2017. Shreve is the third Yankee to appear.

6. Top Five Curveball (Min 200):

Player Sw+Whf% Sw+Whf% Z xwOBA xwOBA Z Z Total
David Robertson 102.86 1.89 0.16 0.73 2.62
Jerry Blevins 95.85 1.28 0.16 0.71 1.99
Ryan Pressly 89.25 0.70 0.12 1.28 1.98
Cody Allen 90.94 0.85 0.15 0.85 1.70
Keone Kela 85.24 0.35 0.13 1.12 1.47

The Stars: David Robertson, Cody Allen

Young and Coming: Keone Kela

Surprises: None

Our fourth Yankee to appear on a leaderboard is Robertson. And none of those four have been Dellin Betances or Aroldis Chapman. Scary. Kela has been one of the only relievers holding the Rangers bullpen afloat.

7. Top Ten Slider (Min 250):

Player Sw+Whf% Sw+Whf% Z xwOBA xwOBA Z Z Total
Roberto Osuna 108.02 1.97 0.16 1.52 3.49
Arodys Vizcaino 105.81 1.78 0.16 1.54 3.32
Raisel Iglesias 98.47 1.13 0.14 1.93 3.06
Blake Treinen 105.37 1.74 0.17 1.23 2.97
Pedro Strop 107.08 1.89 0.19 0.97 2.86
Ken Giles 97.17 1.01 0.16 1.57 2.59
James Hoyt 110.74 2.22 0.23 0.19 2.41
Edwin Diaz 99.11 1.18 0.18 1.12 2.31
Adam Morgan 108.19 1.99 0.23 0.16 2.15
Kyle Barraclough 88.13 0.21 0.15 1.67 1.88

The Stars: Roberto Osuna, Pedro Strop, Ken Giles

Young and Coming: Raisel Iglesias, Edwin Diaz

Surprises: James Hoyt

Osuna has been nothing short of excellent for the Blue Jays, manning the closer job for all three of his professional seasons. Still just 22 years old, the best is yet to come. Strop is widely under-appreciated, but he has been a consistent force out of the Cubs bullpen for years. Mariners young stud Edwin Diaz makes his second leaderboard appearance. Hoyt has been terrible for the Astros, so his inclusion is unexpected.

8. Top Three Changeup (Min 200):

Player Sw+Whf% Sw+Whf% Z xwOBA xwOBA Z Z Total
Tommy Kahnle 99.96 1.16 0.18 1.59 2.75
Felipe Rivero 105.68 1.86 0.22 0.47 2.33
Chris Devenski 100.35 1.21 0.20 0.89 2.10

(the changeup is not much of a reliever pitch, so this leaderboard is small)

The Stars: Chris Devenski

Young and Coming: Felipe Rivero

Surprises: None

Kahnle appears again. With much-improved stuff, he has been striking out everybody en route to a big breakout season. Devenksi is only in his second year, but also in his second year of excellence. The unheralded minor-league starter turned long reliever turned dynamic/versatile setup man has been a star in Houston’s bullpen. His changeup is nicknamed the “Circle of Death,” so no surprise seeing him here. Rivero has been dominant for the Pirates in his third year in the bigs.

Top Fifteen Overall:

Pitch Player Sw+Whf% Sw+Whf% Z xwOBA xwOBA Z Z Total
4-Seam Craig Kimbrel 94.74 2.34 0.23 1.80 4.15
4-Seam Sean Doolittle 90.81 1.91 0.22 2.02 3.93
4-Seam Chad Green 85.35 1.30 0.20 2.57 3.87
Slider Roberto Osuna 108.02 1.97 0.16 1.52 3.49
Slider Arodys Vizcaino 105.81 1.78 0.16 1.54 3.32
Cutter Jacob Barnes 104.09 1.99 0.22 1.21 3.20
Slider Raisel Iglesias 98.47 1.13 0.14 1.93 3.06
Slider Blake Treinen 105.37 1.74 0.17 1.23 2.97
4-Seam Anthony Swarzak 78.77 0.58 0.20 2.37 2.95
Slider Pedro Strop 107.08 1.89 0.19 0.97 2.86
Splitter Blake Parker 101.30 1.30 0.18 1.48 2.78
Changeup Tommy Kahnle 99.96 1.16 0.18 1.59 2.75
Sinker Pat Neshek 70.87 1.06 0.25 1.66 2.72
Curveball David Robertson 102.86 1.89 0.16 0.73 2.62
4-Seam Josh Fields 89.12 1.72 0.27 0.89 2.61

Best Pitch: Craig Kimbrel, Boston Red Sox, four-Seam

Biggest Surprise: Jacob Barnes, Milwaukee Brewers, Cutter

The leaderboard is run by four-seam fastballs and sliders at the top, which is unsurprising considering those are the favorite pitches of relievers. I’ve said this before, but three Yankees in the top 15. And neither of their alleged best two! That’s absurd. Seeing Kimbrel at the top is the exact opposite. Jacob Barnes, however, is crazy too. The unheralded second-year man hasn’t shown much yet, with a 4.00 FIP in 2017. But that cutter is doing something to hitters.

I will add one more, combining relievers and starters, and with some interesting tidbits.


Starting Pitcher Pitch Rankings

As I stated in my earlier article, I would be posting data from my pitch-effectiveness measurement I introduced. Let’s start with the starting pitchers.

1. Top Ten Four-Seam Fastballs (Min 500):

Player Sw+Whf% Sw+Whf% Z xwOBA xwOBA Z Z Total
Chris Sale 85.89 3.08 0.24 2.86 5.94
Jacob deGrom 83.06 2.68 0.27 2.13 4.81
Jose Berrios 74.74 1.51 0.27 1.97 3.48
Jimmy Nelson 76.65 1.78 0.30 1.34 3.12
Jeff Samardzija 75.97 1.68 0.30 1.34 3.02
Max Scherzer 73.97 1.40 0.29 1.55 2.95
Chase Anderson 74.24 1.44 0.29 1.45 2.89
Rick Porcello 77.50 1.90 0.31 0.87 2.77
James Paxton 73.32 1.31 0.29 1.42 2.73
Danny Salazar 80.27 2.29 0.33 0.42 2.71

The Stars: Chris Sale, Jacob deGrom, Max Scherzer, James Paxton

Young and Coming: Jose Berrios

Surprises: Rick Porcello, Chase Anderson, Jeff Samardzija

This group includes some bona-fide talent and some surprises. Porcello’s 1.90 Z-Score on the Sw+Whf% jumps out, considering his lack of stuff and general pitch to contact. Anderson is quietly putting together a solid season, with a 2.88 ERA in 122 innings of work. Samardzija’s incredible strikeout and walk peripherals have been well documented this year.

2. Top Ten Two-Seam Fastballs (Min 300):

Player Sw+Whf% Sw+Whf% Z xwOBA xwOBA Z Z Total
Sonny Gray 72.12 2.18 0.30 1.39 3.57
Jaime Garcia 67.96 1.49 0.28 1.97 3.46
David Price 72.83 2.29 0.32 0.86 3.15
Lance Lynn 66.66 1.27 0.31 1.16 2.43
Matt Garza 65.31 1.05 0.30 1.34 2.39
Luis Castillo 64.66 0.94 0.30 1.44 2.38
Chris Sale 65.23 1.04 0.30 1.34 2.38
Jameson Taillon 69.98 1.82 0.34 0.40 2.23
J.A. Happ 63.82 0.80 0.30 1.29 2.09
Julio Teheran 69.27 1.71 0.35 0.20 1.91

The Stars: Sonny Gray, David Price, Chris Sale, Julio Teheran

Young and Coming: Jameson Taillon, Luis Castillo

Surprises: Jaime Garcia, Matt Garza

We see Sale again, which, considering what he has done this year, is not surprising. Garza has been generally terrible this year, so his inclusion in this list is unexpected. Castillo, a rookie for the Cincinnati Reds, has pieced together some quality starts out of the spotlight.

3. Top Five Cut Fastballs (Min 200):

Player Sw+Whf% Sw+Whf% Z xwOBA xwOBA Z Z Total
James Paxton 89.03 1.81 0.20 2.03 3.84
Corey Kluber 97.90 2.82 0.28 0.48 3.30
Tyler Chatwood 84.08 1.25 0.21 1.81 3.06
John Lackey 84.72 1.32 0.26 0.85 2.17
Zack Godley 78.94 0.66 0.24 1.39 2.05

(Only five because the small use of cutters)

The Stars: James Paxton, Corey Kluber

Young and Coming: Zach Godley

Surprises: Tyler Chatwood

We see Paxton again, who has established himself as a star this season. Godley has been great for the Arizona Diamondbacks, and Tyler Chatwood has been poor for the Colorado Rockies.

4. Top Five Sinker Fastball (Min 200):

Player Sw+Whf% Sw+Whf% Z xwOBA xwOBA Z Z Total
Trevor Williams 68.72 1.87 0.30 1.73 3.61
Jimmy Nelson 65.69 1.43 0.32 1.11 2.54
Jose Quintana 64.77 1.29 0.32 1.18 2.47
Jon Lester 61.89 0.87 0.31 1.29 2.17
Jake Arrieta 58.31 0.35 0.31 1.43 1.78

(Only five because the small use of sinkers)

The Stars: Jake Arrieta, Jon Lester, Jose Quintana

Young and Coming: Trevor Williams

Surprises: None

An emerging starter for the Pittsburgh Pirates, an emerging ace for the Milwaukee Brewers, and…three Chicago Cubs. I gave the Cubs pitchers the benefit of the doubt and put them under “The Stars” category, but they may have pitched their way out of there this season.

5. Top Two Splitter Fastball (Min 200):

Player Sw+Whf% Sw+Whf% Z xwOBA xwOBA Z Z Total
Kevin Gausman 94.79 0.96 0.21 1.61 2.57
Ricky Nolasco 95.42 1.02 0.22 1.35 2.37

The splitter leaderboard included only nine starters, so this one is short. Kevin Gausman has rebounded from a horrendous start to be solid, and Ricky Nolasco has continued to provide what he always has: mediocrity.

6. Top Ten Curveball (Min 300):

Player Sw+Whf% Sw+Whf% Z xwOBA xwOBA Z Z Total
Corey Kluber 109.61 3.16 0.12 2.26 5.42
Charlie Morton 88.69 1.30 0.17 1.44 2.74
James Paxton 84.54 0.93 0.16 1.49 2.42
Zack Godley 93.67 1.74 0.22 0.60 2.35
Aaron Nola 87.91 1.23 0.19 1.07 2.30
Carlos Carrasco 88.65 1.30 0.19 0.99 2.28
Ivan Nova 84.32 0.91 0.18 1.21 2.12
James Shields 91.18 1.52 0.22 0.50 2.02
Alex Meyer 82.68 0.76 0.19 1.07 1.84
Jon Lester 89.57 1.38 0.22 0.45 1.82

The Stars: Corey Kluber, James Paxton, Carlos Carrasco

Young and Coming: Zach Godley

Surprises: James Shields, Alex Meyer, John Lester, Charlie Morton

We see Kluber again, and Godley again, and Paxton for a third time. No surprise considering the seasons they have put up. Shields’ days as a front-of-the-rotation starter are far behind him. Meyer has quietly put together some solid starts for the Los Angeles Angels as a complete unknown. Lester is a surprise here because this is his second leaderboard appearance, and he has not pitched well. Morton is mostly known for his injury problems, but he has developed some of the best “stuff” in the game in his first year in Houston.

7. Top Ten Slider (Min 300):

Player Sw+Whf% Sw+Whf% Z xwOBA xwOBA Z Z Total
Carlos Carrasco 108.62 2.51 0.15 2.06 4.56
Max Scherzer 104.66 2.10 0.17 1.79 3.89
Sonny Gray 97.27 1.35 0.16 1.87 3.22
Dylan Bundy 99.46 1.58 0.19 1.28 2.85
Clayton Kershaw 101.38 1.77 0.22 0.82 2.59
Patrick Corbin 94.91 1.11 0.19 1.24 2.35
Marcus Stroman 96.92 1.32 0.21 1.03 2.34
Zack Greinke 104.05 2.04 0.24 0.30 2.34
Mike Clevinger 96.96 1.32 0.21 1.01 2.33
Mike Leake 96.40 1.27 0.21 0.93 2.20

The Stars: Carlos Carrasco, Max Scherzer, Sonny Gray, Clayton Kershaw, Marcus Stroman, Zach Greinke

Young and Coming: Dylan Bundy, Mike Clevinger

Surprises: Patrick Corbin

Finally! The man we have been waiting to see, Kershaw, makes his first appearance. As does Scherzer. The star power of this group is by far the strongest. Bundy has been “Young and Coming” for decades it seems now, and no one knows if the flashes will become consistency ever. Still just 24 years old, though, so I will keep my hopes up. Clevinger has been a nice surprise for the Cleveland Indians, and Corbin has bounced back from a miserable 2016 to be solid for the Arizona Diamondbacks.

8. Top Ten Changeup (Min 300):

Player Sw+Whf% Sw+Whf% Z xwOBA xwOBA Z Z Total
Stephen Strasburg 104.30 2.31 0.15 2.76 5.07
Luis Castillo 97.25 1.46 0.18 2.27 3.73
Danny Salazar 102.60 2.11 0.23 1.01 3.12
Kyle Hendricks 95.35 1.23 0.22 1.25 2.49
Max Scherzer 90.38 0.63 0.20 1.72 2.35
Edinson Volquez 91.28 0.74 0.21 1.54 2.28
Carlos Carrasco 86.47 0.16 0.19 1.90 2.06
Eduardo Rodriguez 95.70 1.28 0.26 0.48 1.76
Jason Vargas 91.99 0.83 0.26 0.46 1.29
Cole Hamels 93.09 0.96 0.27 0.24 1.20

The Stars: Stephen Strasburg, Kyle Hendricks, Max Scherzer, Carlos Carrasco, Cole Hamels

Young and Coming: Luis Castillo, Eduardo Rodriguez

Surprises: Edinson Volquez

Scherzer again, which makes me feel better about the validity of this work. Carrasco for the third time in a row. His breaking and offspeed stuff are killer. Very few people outside of Cincinnati know Castillo, but this is the rookie’s second leaderboard appearance. Rodriguez has continued to flash this year, but injuries and inconsistency continue for the young Red Sock. Volquez is still embracing his mediocrity.

Starters Top Fifteen Overall:

Pitch Player Sw+Whf% Sw+Whf% Z xwOBA xwOBA Z Z Total
4-Seam Chris Sale 85.89 3.08 0.24 2.86 5.94
Curveball Corey Kluber 109.61 3.16 0.12 2.26 5.42
Changeup Stephen Strasburg 104.30 2.31 0.15 2.76 5.07
4-Seam Jacob deGrom 83.06 2.68 0.27 2.13 4.81
Slider Carlos Carrasco 108.62 2.51 0.15 2.06 4.56
Slider Max Scherzer 104.66 2.10 0.17 1.79 3.89
Cutter James Paxton 89.03 1.81 0.20 2.03 3.84
Changeup Luis Castillo 97.25 1.46 0.18 2.27 3.73
Sinker Trevor Williams 68.72 1.87 0.30 1.73 3.61
2-Seam Sonny Gray 72.12 2.18 0.30 1.39 3.57
4-Seam Jose Berrios 74.74 1.51 0.27 1.97 3.48
2-Seam Jaime Garcia 67.96 1.49 0.28 1.97 3.46
Cutter Corey Kluber 97.90 2.82 0.28 0.48 3.30
Slider Sonny Gray 97.27 1.35 0.16 1.87 3.22
2-Seam David Price 72.83 2.29 0.32 0.86 3.15

Best Pitch: Chris Sale, Boston Red Sox, 4-Seam Fastball

Best Repertoire: Corey Kluber, Cleveland Indians

Biggest Surprise: Luis Castillo, Cincinnati Reds, Changeup

This list is almost all household names. In first and second, we have the AL Cy Young frontrunners. Jeff Sullivan recently wrote an article about Kluber’s curveball, and how it may be the best pitch in baseball. It isn’t number one here, but second place is not too shabby. His cutter also appears here, so his dominance is not hard to explain. Sonny Gray’s stuff is well known, and he shows up twice on this table, but his numbers are not spectacular this year. Lastly, watch out for Castillo. He’s a no-name rook, but he has been solid for the Reds, and the ranking of his changeup may be the evidence to support his success.

Next up is relievers.


Using Z-Scores to Evaluate Pitch Effectiveness

We are yet to establish a truly effective method of measuring the effectiveness of a pitch and comparing pitches. One of the main problems with attempting to evaluate a pitch on it’s own is nearly impossible. If a pitcher has an exceptional fastball, that is going to elevate his slider. Another pitcher may have a slider with more “stuff,” but it will not rank as well without the other effective pitches in his repertoire.

I will attempt to create a method here that will allow us to measure effectiveness in an improved way, although there is no guarantee here that I will succeed.

Let’s start with the main things a pitch has to be effective. In theory, a perfect pitch would be thrown in the zone and generate whiffs, while allowing weak contact when it is put in play. Obviously, it is unreasonable to expect a pitcher to generate lots of whiffs inside the zone against major-league hitters, so throwing outside the zone is a necessity in baseball to get swings and misses.

So, I used two evaluators for pitch effectiveness. I formed my own measurement, Swing%+Whiff% (Sw+Whf%). Since many pitches are meant not to be thrown in the strike zone, I did not include Zone% or Strike%. The Sw+Whf% should evaluate the ability of a pitch to get swings, and swings and misses. That evaluator covers the “stuff” component of the pitch. For the second evaluator, I used xwOBA (expected OBA), which gives a “true” wOBA based off exit velocity and launch angles. This covers the contact management component of the pitch. These are not all weighted for the part they play in run scoring, so it is not perfect, but they should give us a solid idea of what a pitch could do.

Obviously, different pitches will have different average values for these evaluators. A breaking ball is going to create more whiffs than a fastball. Fastballs are easier to hit, and thus will have a higher xwOBA. These evaluators themselves can not be used to compare different types of pitches. This is where the Z-Scores come in to play.

A Z-Score measure how much something deviates from average. First, we take the standard deviation and mean of a data sample. Then, for the Sw+Whf%, we subtract the mean from the individual’s Sw+Whf%, and divide that number by the standard deviation. We have our Z-Score! If the Sw+Whf% is higher than average, the Z-Score will be above zero, which means it is better than average. If the Sw+Whf% is lower than average, the Z-Score will be below zero, indicating the pitch is worse than average. It is the same thing for xwOBA, except for xwOBA lower is better. So instead of subtracting the mean from the individual’s xwOBA, we subtract the individual’s xwOBA from the mean. Add the two Z-Scores together, and we have our total Z.

Example:

The average Sw+Whf% on four-seam fastballs, for pitchers with a minimum of 500 four-seamers thrown, is 63.78. The average xwOBA allowed on these is .347. Chris Sale owns an 85.89 Sw+Whf% and .238 xwOBA on his four-seam fastball. The Sw+Whf% STD is 7.14 and the xwOBA STD is .038.

Sw+Whf% Z-Score: (85.89-63.78)/(7.14) = 3.08

xwOBA Z-Score: (.347-.238)/(.038) = 2.86

Total Z-Score: 3.08 + 2.86 = 5.94

Sale’s 5.94 is an incredible score, with second-place Jacob deGrom sitting at 4.81, over 1 below Sale. After that, no one else even reaches 3.5. The Z-Score has no unit, so it can be slightly confusing. It is a measurement of how many standard deviations above or below average something is.

A few things to be careful of here. These numbers are not predictive. They are simply meant to measure the effectiveness of a pitch and allow us to compare different types of pitch in a more simplified way than run values. It is just a fun statistic to look at, not something used to project the future. We also have the same problem as run values. It is impossible to look at a pitch by itself, as a good fastball will elevate a good slider. I am attempting to determine something that will allow us to better differentiate a player’s specific pitches from each other, but for now, we have this. I will be posting all the specific pitch data and tables for each pitch for starters and relievers and doing some analysis in the next few days. This is just the introduction.