Hack Wilson: The Most Interesting Player You’ve Sorta-Kinda Heard of Before

Lewis Robert “Hack” Wilson was an outfielder for the New York Giants, Chicago Cubs, Brooklyn Dodgers, and Philadelphia Phillies in the early 20th century. Wilson was a very good ballplayer, and was enshrined in Cooperstown in 1979.

As my title suggests, you have probably heard the name Hack Wilson before, but I’m guessing you probably don’t know much about him, because his most popular claim to fame is considered by many to be irrelevant today. This claim to fame is his record-setting 191 RBI in 1930. This remains the single-season record for the stat to this day, and it’s hard to believe that anyone will come along who can break it. In that 1930 campaign, Hack also slugged 56 home runs, walked 105 times, struck out 84 times, and slashed .356/.454/.723 with a 1.177 OPS and a 177 OPS+. These were all league highs, excluding average and OBP.

That’s a great season, but it gets a whole lot more interesting when you look a little closer. 56 home runs is a lot. That mark is tied with Ken Griffey Jr.’s pair of 56-home-run campaigns for 17th-most all-time in a single season, and was the best non-Ruth mark at the time (although this would last just two years, when Jimmie Foxx hit 58 home runs in 1932).

Just hitting home runs isn’t what makes Hack Wilson so interesting to me, though. It’s who he was. Hack Wilson stood at just 5’6. The same height as our favorite short player today, Jose Altuve. In fact, at 5’6, Altuve and Hack are both the shortest players to ever hit 20 or more home runs in a single season. Hack alone is the shortest player to ever slug 30, 40, or 50 in a single season. Hack also holds the single-season home-run record for anyone under 6’0. Hack, Mantle (5’11), Mays (5’10), and Prince Fielder (5’11) are the only men to hit 50 or more home runs while being less than 6’0.

However, with that enormous home-run total comes strikeouts. You may have noticed that he struck out just 84 times in that 56 home-run season, and he even walked more than he struck out. But 84 was a lot in 1930. In fact, Hack Wilson led the league in strikeouts.

In 2017, just 25 qualified hitters struck out 84 times or fewer. Of these 25, just one (Mookie Betts) matched or exceed Hack’s 709 plate appearances. This tidbit really speaks more to the two eras in discussion, but it’s interesting nonetheless.

Some other Hack Wilson fun facts:

Hack received MVP votes in five years. Amazingly, his monstrous 1930 season (undoubtedly his best) was not one of the five. However, this was due to the fact that the MVP was not awarded in 1930. Had it been, Wilson likely would have won in a landslide.

Despite having the single-season record for most RBI, he is tied for just the sixth-most seasons of 150 or more RBI with two, behind Lou Gehrig (7), Babe Ruth (6), Jimmie Foxx (4), Hank Greenberg (3), and Al Simmons (3), and tied with Sosa, DiMaggio, and Sam Thompson.

Despite the legendary 1930 season, Hack’s career was significantly below that of a typical Hall of Famer. His Gray Ink score is 110 (average HOF’s is 144), and his “Hall of Fame Standards” is 39 (average HOF’s is 50). His 38.8 career bWAR is nearly half of the average bWAR for center fielders, at 71.2.

That’s all I have on Lewis Wilson. He may still seem like a relatively mundane player, but imagine if Altuve came out in 2018 and kept up with Stanton and Judge in the home-run race. That is what Hack Wilson did in 1930, belting 56 homers as a man who stood 5’6″ tall (how can you not be romantic about baseball?).


Overcoming Imperfect Information

When a team trades a veteran for a package of prospects, only minor-league data and the keen eye of scouts can be used to assess the likely future major-league contributions from those particular players. Teams have accurately relied on the trained eyes of scouts for generations, but of course the analytics community wants its foot in the game too. Developments such as Chris Mitchell’s KATOH systems make some strides, as it is helpful to compare historical information. Does prospects rank on MLB.com’s or Baseball America’s top-prospect list really indicate how productive a player will be in the major leagues? Of course, baseball players are human, and production will always vary due to the result of numerous factors that could potentially change the course of someone’s career. Perhaps a player meets a coach that dramatically changes his game around, or a pitcher discovers a new-found talent for an impressive curveball that jumps him from low fringe prospect to MLB ready. The dilemma of imperfect information will always be present, so team must use the best resources available to them to tackle the problem.

To start my analysis of imperfect information, I look at the top 100 position prospects from 2009 using data from BaseballReference.com. I break up the prospects into three groups based on their prospect ranking, which are position players ranked 1-10, 11-20 and 21-100. I then look at the value that those prospects contributed in their first six seasons in the major leagues, as well as their to-date total contributions using fWAR. I choose to look at the first six seasons of a player’s career because that is how long a player is under team control before reaching free agency. This study does not take into account any contract extensions that may have been given before a player reached free agent-eligibility. For players who have not been in the MLB for six full seasons, I look at their total contributions so far. The general idea for this study was inspired by a 2008 article by Victor Wang that looked at imperfect prospect information.

I convert the prospects’ production into monetary value based on the relative WAR values that were commanded in the free-agent market that year. I use fWAR to encompass the best measure of total value. When teams trade for prospects, they understand that they are trading wins today for wins in the future. Since baseball is a business and teams care about their performance on the field each year, I need to account for that fact in my analysis. In order to do that, I assume all else equal, a win today is more valuable than a win in the future. I apply an 8% discount rate to each prospect’s WAR value and create a discounted WAR value (dWAR). The value of the discount rate can be debated, but the 8% rate seems appropriate for the time framed looked at.

From here, I break up the prospects into a few different subgroups based on their average WAR contributed over their first six seasons in the major leagues. I follow some of the guidelines laid out in other studies with some slight modifications. Players with 0 or negative WAR per year are labeled as busts. Players with slightly above 0-2 WAR are contributors. Players with 2-4 WAR are starters and players with 4+ WAR are stars. Like described previously, I estimate the players’ monetary savings to their team by taking their monetary value based on WAR performance and comparing it to what similar production would command in the free-agent market for that year. There seems to be some debate on the value of one WAR in the free-agent market, however my calculations show that about $7 million bought one WAR leading up to the 2009 season. Victor Wang suggests that the price for one WAR had about a 10% inflation rate from year to year. I find the present value of each player’s WAR, then divide it by the $7 million dollars per WAR that would have been commanded in the free-agent market in order to find a player’s effective savings to their team based on production.

Position Prospects Ranked 1-10

Bust Contributor Starters Star AVG WAR/Y
1 2 5 2 2.83
10.00% 20.00% 50.00% 20.00%


Bust Contributor Starters Star
WAR/Y 0.43 1.53 2.73 5.17
Probability 10.00% 20.00% 50.00% 20.00%
PV Savings/y (in millions) 1.88 8.46 10.91 27.98

Interestingly enough, this prospect class panned out quite well compared to some other recent draft classes. The only bust in terms of discounted WAR turned out to be Travis Snider of Toronto, who was ranked the sixth-best prospect in 2009 but only managed to accumulate a cumulative WAR slightly above 0 in his first six seasons. Though the top 10 position-player prospects from this class feature names such as Jason Heyward and Mike Moustakas, the player that contributed the greatest WAR over his first six seasons from the top 10 ranking was Buster Posey of San Francisco, who posted nearly 6 WAR a year. It is important to understand that the savings a player gives to his team based on his production does not indicate any “deserved” salary for that player. Instead, it merely indicates the amount of money the team would have had to spend in the free-agent market to acquire that exact same production. The top 10 position-player prospects from this prospect class turned very productive to their respective teams, having a 70% chance of being either a contributor or star.

Position Prospects Ranked 11-20

Bust Contributor Starters Star AVG WAR/Y
5 2 1 2 2.158950617
50.00% 20.00% 10.00% 20.00%


Bust Contributor Starters Star
WAR/Y 0.67 1.6 3.56 5.71
Probability 50.00% 20.00% 10.00% 20.00%
PV Savings/y (in millions) 3.21 8.36 19.10 30.90

The next group is the 11-20 ranked position players. As perhaps expected, there are more busts in this group of ranked prospects. The variation of the small is sample is spread through the rest of the categories. Giancarlo Stanton, the 16th ranked prospect, and Andrew McCutchen, the 33rd ranked prospect, turned out to the be the two stars from the list. As the chart shows, the probability of getting a bust at this ranking of prospects is much higher than the 1-10 rankings. The variance does show, however, that player outcomes expectancy can also be promising at this ranking level. There was an identical chance of player becoming a star in this group compared to the first group, and a 50% chance of them being at least a contributor. In total, four of the top 20 prospects from 2009 turned out to be stars to this point in their careers, though not all have reached six full service years in the majors.

Position Prospects Ranked 21-100

Bust Contributor Starters Star
12 7 3 1
38.71% 22.58% 9.68% 3.23%


Bust Contributor Starters Star
WAR/Y 0.35 1.46 3.22 3.87
Probability 38.71% 22.58% 9.68% 3.23%
PV Savings/y 1.48 7.52 17.18 20.80


The next group of charts shows the rest of the top 100 ranked position players. The chart shows there is much more potential for busts to be found in this ranking; however, we must keep in mind that the variance will be different in this group automatically because of the larger sample size than the first two groups. Nearly 40% of position players ranked 21-100 turned out to be busts. In addition, only Freddie Freeman of Atlanta managed to get above the 4+ dWAR/year threshold to qualify as a star. In fact, the most common category of these ranked position players is a bust. When drafting a player, a team never knows for certain the production that the pick will produce in the major leagues, no matter the pick number of the draft pick. In addition, prospect rankings based on minor-league performance is still not a completely accurate indicator of future MLB productivity. Higher-ranked prospects in 2009 did have higher probability of contributing more to their major-league club, though rankings are understandably volatile. A variety of factors play into the volatile nature of prospect outcomes and the prospect risk premium. Part of the reason I chose to only look at position players is because they are traditionally safer from injury than pitchers, and therefore carry slightly less of a risk premium.

Looking at the variance of dWAR for the prospect group, the distribution is skewed left, which is to be expected because not all prospects will turn out to be as equally strong, and most will not become stars. It also makes sense because in any given year, only a few top prospects will become very strong players, while most will hover around average. We also see that the inner quartile range is about from 0.5 dWAR per year to slightly above 2.5 dWAR per year. Therefore, it could be expected that a team get production in that range from a given prospect ranked 1-100, varying sightly in what rank group they are in. A useful analysis would be to make a distribution chart of each rank group, but in the interest of brevity, I do not do that here.

New ways of evaluating both minor league and amateur players to relieve some of the prospect-risk premium is useful, although risk will always be present. In the next part of this study, I will try to discover statistically significant correlations between college and major-league performance in order to try to reduce the noise of prospect-risk premium. One of the great things about the baseball player development structure is that it allows players with the right work ethic and dedication, as well as others who were overlooked in high rounds of the draft, to prove themselves in the minor leagues. That can seldom be said it other professional sports. The famous example of this was Mike Piazza, who was one of the last overall picks in his draft class and worked his way to a Hall of Fame career. With perfect information, the graph would be perfectly skewed left, with each ranked prospect achieving a higher dWAR than the next ranked prospect. Some may attribute the imperfect information dilemma to drafting or the evaluation of minor-league performance, and some may attribute it to differences in player-development systems. Some may also rationally say that both the players and the scouts are humans and will not be perfect. Prospects rankings for a given year are based on several factors, including a player’s proximity to contributing on the major-league level. The most talented minor-league players could be at a lower ranking in a given year because of their age or development level, which could cause some unwanted variance in the data. Looking at the just the 100 top prospects helps somewhat eliminate this problem, but will not make the problem completely disappear. It is difficult to know when teams plan on calling up prospects anyway, and it really depends on the needs of the team. Some make the jump at 20, while others make the jump at 25, or even later.

This type of analysis could be useful for things like estimating opportunity cost of a trade involving prospects for both financial trade-offs and present versus future on-field production. A lot of factors play into the success of a prospect. When evaluating any player, things such as makeup and work ethic are just as big of factors as measurable statistics. Evaluating college and high-school players for the annual Rule 4 draft can be especially difficult because of the limited statistical information that are accessible. Team scouts work very hard to accurately evaluate the top amateur players in the United States and around the world in order to put their team in a good position for the draft. Despite the immense baseball knowledge that scouts bring to player evaluation, statistical analysis on college players is still explored and used to complement traditional scouting reports. Prospect-risk premium will always be something teams must deal with, but efficiently allocating players into a major-league pipeline is essential for every front office.

There have been a few other articles on sites such as FanGraphs and The Hardball Times on statistical analysis of college players. Cubs president Theo Epstein told writer Tom Verducci that the Cubs analytics team has developed a specific algorithm for evaluating college players. The process involved sending interns to photocopy old stat sheets on college players from before the data was recorded electronically.

Though I do not doubt the Cubs have a very accurate and useful algorithm for such a goal, the algorithm is not publicly available for review, and understandably so. However, for the several articles which tackle this question on other baseball statistical websites, I think there is some room for improvement. First, the multiple of different complex statistical analysis techniques to compare college versus MLB statistics yield about the same disappointing results as the other, meaning that some of the models are probably unnecessarily complicated. Second, though the authors may imply it by default, statistical models in no way account for the character and makeup of a college player and prospect. Even in the age of advanced analytics, the human and leadership elements of the game still hold great value. Therefore, statistical rankings should not be taken as precise recommended draft order. In addition, they do not take into account injury history and risk of a player. Teams can increase their odds of adding a future starter or star over a player’s first six seasons by drafting position players, who have been historically shown to be safer bets than pitchers due to a lesser injury risk.

The model in this post attempts to find statistically significant correlations between players’ college stats and a player’s stats for his first six seasons in the MLB. Six seasons is the amount of time a team has a drafted player under control until they reach free agency and the player is granted negotiating powers with any team, like we’ve gone over. However, the relationship between college batting statistics and MLB fWAR can only go so far because of the lack of fielding and other data for college players.

The first thing I did was merge databases of Division I college players for years 2002-2007 with their statistics for their first six years in the MLB. There is some noise in the model since some payers in the MLB who were drafted in later years in my sample have not spent six years in the MLB, which is accounted for. I only look at the first 100 players drafted each year. I then calculate each player’s college career wOBA per the methods recommended by Victor Wang in his 2009 article on a similar topic. However, since wOBA weights are not recorded for college players, the statistic is more of an arbitrary wOBA that uses the weights from the 2013 MLB season. Since wOBA weights do not vary heavily from year to year, it will do the trick for the purpose of this analysis. For MLB players, wOBA compared to wRC and wRC+ have a 97% correlation (varying slightly on the size of the sample) so I did not feel it was necessary to calculate wRC in addition to wOBA. In fact, when using ordinary least squares and multiple least squares regression techniques, I would have experienced problems with pairwise collinearity, so calculating both statistics would have proved pointless. Along with an ordinary least squares regression technique, I also use multiple least squares and change the functional form to double logarithmic. (A future study I hope to tackle soon is to use logistic regression techniques to calculate the odds of a college player ending up each of the four WAR groups for their first six season in the majors.)

Due to the limitations in the data as well as the restrictions on the amount of top 100 picks that actually make it to the MLB, the analysis is somewhat limited, yet still produces some valuable results. Interestingly, though perhaps unsurprisingly, my calculated wOBA for each player’s college career showed a strong and statistically significantly relationship with wOBA produced in the MLB. To a lesser extent, college wOBA also indicates a statistically significant relationship with MLB-produced WAR, even though this study does not take into account defense, baserunning, etc. Looking at a collinearity matrix, I find that college wOBA and MLB wOBA have about a 25% pairwise collinearity. In addition, the matrix shows a similar pairwise collinearity of about 25% between college wOBA and MLB WAR, though at a lower level of confidence. Using an ordinary least squares regression, I use different functional forms to further evaluate the strength of the relationship between college and MLB statistics.

The first model confirms a fairly strong and statistically significant relationship at the 1% level between college and MLB wOBA with a correlation coefficient of about .25. College strikeout to walk ratio is also statistically significant at the 1% level albeit without a strong correlation coefficient. Even so, looking back at the matrix indicated that players who are less prone to the strikeout in college, on average, see better success in the MLB. Interestingly enough, college wOBA and strikeout to walk ratio are about the only two statistically significant statistics that I can find by running several models with different functional forms. Per the model, we can also say that it is likely that college hitters with extra-base-hit ability have better prospects in the majors. The R-square for model one is about .20, which is not terrible, but certainty not enough information to provide a set-in stone model. The constant in the regressions seem to capture noise that is difficult to replicate, lending insight to the extreme variance and unpredictability of the draft.

For model 2, I use a double logarithmic functional form with a multiple least squares linear regression in order to see the variance in MLB wOBA with college wOBA and strikeout to walk ratio. The results of this regression are slightly stronger and look a bit more promising to the conclusion that the calculated college wOBA is a strong predictor of MLB wOBA.

According to the results of the double log model, a one percent increase in MLB wOBA corresponds to about 36% increase in college wOBA, all else equal. (Since the model is in double log form, the interpretation is done by percent and percentage points.) We can more simply interpret this that a player, on average and all else equal, will have a one percent higher wOBA in MLB for every 36% increase to their college wOBA compared to other players. The coefficient is significant at the one percent level. In addition, a one percent increase in MLB wOBA corresponds to about a six percent decrease in college strikeout to walk ratio. Again, I get about a R-squared of about 0.20.

Perhaps the most interesting thing that these regressions have shown is that college batting average has almost no correlation with MLB success. This may be a little misleading because hitters who get drafted in high rounds and who do well in the MLB will likely have high college batting averages, but the regressions show that there are other things teams should look for in their draft picks besides a good batting average. Traits such as low amounts of strikeouts, especially relative to the number of walks, helping indicate a player’s pure ability to get on base. When evaluating college players, factors such as character build, work ethic and leadership abilities will be just as good as indicators for success for strong college ball players. Perhaps the linear weights measurements used in wOBA calculations are on to something. Accurate weights can obviously not be applied to college statistics without the proper data, but the comparisons using MLB weights for college players can still be useful. In addition, it is also well known that position players are traditionally safer higher-round picks than pitchers due to injury risk. I would argue that strong college hitters are often times the most productive top prospects, while younger pitchers who can develop in a team’s player-development system can be beneficial for a strong farm system and pipeline to the major leagues. Many high-upside arms can be found coming out of high school, rather than taking power college pitchers. In addition, arms from smaller schools often times are overlooked due to the competitive environment they player in. Nevertheless, hidden and undervalued talent exists that could result in high-upside rewards, both financially and productively for teams.


Let’s Find the Giants 88 Wins

We find ourselves in the midst of an exceptionally intriguing offseason. Rarely is there an opportunity to acquire a prior year’s MVP and remain in position to nab the number-two asset on the market: Shohei Ohtani. Given Ohtani’s decision to forego a contract that syncs up with his open-market value when he turns 25, he’ll hold a Black Friday-esque price-tag when posted. Virtually any team in baseball can make a play to acquire the former star from the Hokkaido Nippon-Ham Fighters, regardless of wallet size. That makes this particular campaign for a generational talent so intriguing.

Whether your team meets Ohtani’s duo of wants — independent of a passing grade on his questionnaire — is another story.

The San Francisco Giants are in a precarious position heading into 2018. Coming off a 64-win season, the lowest win total for their franchise since 1994, and the lowest of Bruce Bochy’s tenure by seven games, a rebound seems imminent. The current state of their roster, however, casts doubt on how relevant a rebound can make their team.

So, I sent out a tweet entertaining the possibility that one team lands the two biggest names of the offseason.

A little bit of mental math brought my over/under to 87.5 wins. Imprecise? Sure, but only three times since 2014 has one team improved on their prior year win total by more than 24 games: the Minnesota Twins (2016 to 2017, +26 wins), Arizona Diamondbacks (2016 to 2017, +24 wins), and Chicago Cubs (2014 to 2015, +25 wins). Whether a signal or mere noise, each of those improvements came without lavish acquisitions during winter (I used my subjective definition of “lavish”). Each was propelled to relevance by internal talent (Buxton/Sano, Ray/Godley, Arrieta/Bryant, etc.), superb management, and other favorable nods from the Baseball Gods. Each of the 29 responses to my poll came with three elements of consideration: Ohtani, Stanton, and everything else.

Ohtani

The pitching side of Ohtani’s value is interesting. ZiPS and Dan Szymborski were the first to throw their hat in the ring, giving Ohtani a 3.55 ERA over 139 innings of work, with 161 strikeouts, and a walk rate of 3.9 BB/9. It’s lukewarm, considering the hype around Ohtani and knowledge of his sub-1.1 WHIP over in the NPB. Do I agree with it? Not from a control standpoint, but we can work with it and my disagreement isn’t dismissal of a labor-intensive statistical model’s projection.

Taking the three essential components of FIP (walks, strikeouts, and homers), and our knowledge that pitcher fWAR is derived from FIP, we can backtrack from Ohtani’s ZiPS projection and in an anti-statistician kind of way. By comparing Ohtani’s per-nine peripherals to last year’s performers, we can infer his fWAR might be around 3.0 as a pitcher in 2018 (139 IP, 10.4 K/9, 3.9 BB/9, 1.0 HR/9). This ZiPS and fWAR magic says he’ll be slightly worse than 2017 Brad Peacock (that was a weird sentence to write).

Ohtani’s potential 3.0 fWAR is backed up when you look at his 2016 in the NPB. The righty posted 137 1/3 innings of work, with a 9.2 K/9, 2.9 BB/9, and a HR/9 just north of 1.0. This gives Ohtani something slightly better than Jose Berrios’ 2.8 fWAR 2017 campaign (an equally weird sentence to write).

Value for Ohtani with his bat on the Giants, a team obviously absent of a DH, is where confusion starts.

I want to keep this as simple as possible. It’s unlikely that he goes to the NL if contributing significantly on the mound and in the box are his main goals. The inherent risk for the lottery-winning club would be too high and uncertainty around whether Ohtani would prefer such a role plays an equally large factor. Travis Sawchik breaks Ohtani’s NL hitting value down better than I ever could, so I’ll only give you the product of his analysis.

Ohtani could have about 1.6 fWAR as a hitter. This is composed of 1.1 fWAR in his standard pitcher plate appearances, plus another .5 fWAR from regular pinch-hitting chances (emphasis on the word “regular”).

In total, we have a 4.6 fWAR player in Shohei Ohtani in the National League. Our 3.0 fWAR on the mound and an aggressive — but feasible — 1.6 fWAR in the box.

To find 88 wins for the Giants that my poll responders believe in, we need to start somewhere. It’s too easy to begin at a projection already circulating for the Giants’ 2018 win total, so I’ll make this hard for myself to execute, and likely, for you to rationalize. Let’s start with those 64 hard-fought wins Bochy’s squad scratched and clawed their way to. We’ll work backwards from there.

64 wins, plus roughly five we’re going attribute to Ohtani brings us to 69.

Stanton

Now onto Stanton.

Eno Sarris, a familiar name to many, looked through the surplus value on a trade that would send Stanton to the Bay Area. The names included in that analysis revolve around the following:

To SF: Stanton, Dee Gordon

To MIA: Joe Panik, Tyler Beede, Chris Shaw

We don’t have confirmation this would be the package, but I remain adamant Miami wants contract relief more than anything. Centering an offer around the eight FanGraphs wins above replacement (fWAR) Panik has accumulated in his career feels like a proper balancing of sides, given how much money the Giants would take on in a scenario like this. Whether Stanton opts out or stays through the length of his contract muddies just how much money the Giants, or any team, will tie up through 2027. Although it seems like a risk teams are willing to take, how that opt-out risk factors into offerings is another confounding input.

However, Stanton’s value to teams from a performance standpoint is less cloudy than his monetary value. He’s good. Very good. Completing two 6-fWAR seasons before turning 28 is desirable trait for any player. One of the first projections kicking around — FanGraphs’ Steamer — holds Stanton somewhat steady with his torrid 2017.  5.3 fWAR, buoyed by another 45+ homer season, and a wRC+ that holds up to his career standard. I have little objection to this, even if worry consumes you that a healthy season for Stanton was an anomaly.

Ohtani brought us to 69 wins and now Stanton will take us north of the only number above 15 anybody is ever excited to see. We’re at 74 for the Giants by taking WAR and interpreting them as literal wins, something I probably shouldn’t do given the debate the industry just had, but I’ll test my luck.

Everything else

This subheading encompasses a lot of assumptions. In my tweet asking my loyal followers to quickly gauge whether the Giants could get above the 87.5 wins, this considered everything from a (hopefully) full season of good Madison Bumgarner and paying a priest to rid the bad juju from the Giants’ clubhouse, to a minor investment in separate baseballs juiced specifically for AT&T Park.

We could venture another 1,000 words on the improvements of San Fran, but there are far more qualified Giants fans on this website and others (shoutout to Grant Brisbee at McCovey Chronicles) that have surely detailed this difference with more care and a deeper knowledge of the Giants’ issues and internal fixes.

Cutting to the chase, let’s make a simple push to the 88-win mark. FanGraphs’ depth-chart projections currently has the Giants as a 78-win team. That’s 14 wins better than 2017. It is also exactly what we need to go from 74 wins to 88.

Sometimes, things work out better than anybody could have ever planned.

We found our 88 wins.

The only thing I’m left wondering is whether my tweet and over/under projection at 87.5 inspired hopes of 90-plus-win seasons in voters’ minds. If Bochy & Co. can accomplish that feat without even one of Ohtani or Stanton, I commit to paying the shipping fee for Bochy’s Manager of the Year Award.

A version of this post can be found on my site, BigThreeSports.com, by following this link


Who Are the Top “Pound-for-Pound” Power Hitters?

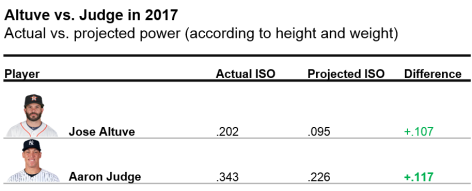
We all know that Aaron Judge hit for more power this year than Jose Altuve. But, whose power was more impressive? Aaron Judge, who is 6’7 and 282 pounds, has a considerable size advantage over Jose Altuve, at 5’6 and 164 pounds. Perhaps Altuve is actually a better power hitter for his size than is Judge. Let’s expand this idea to the entire league: who is the pound-for-pound top power hitter?

Role of Height and Weight in Batter Power

Using simultaneous linear regression, I estimated the effects of two physical characteristics — height and weight — on batter power. Measures of batter height and weight were taken from MLB.com. For batter power, I used Isolated Power.

As shown in the figures below, weight and height have positive relationships with power.

Height and Weight

Weight has a stronger relationship with power than height, though it is difficult to see in the figures alone. (It’s also not intuitively clear exactly how height affects power.) In subsequent analyses, I consider both weight and height.

Who are the top pound-for-pound power hitters?

Using the model, one can predict a batter’s expected power (based on height and weight) and compare it to their actual power.

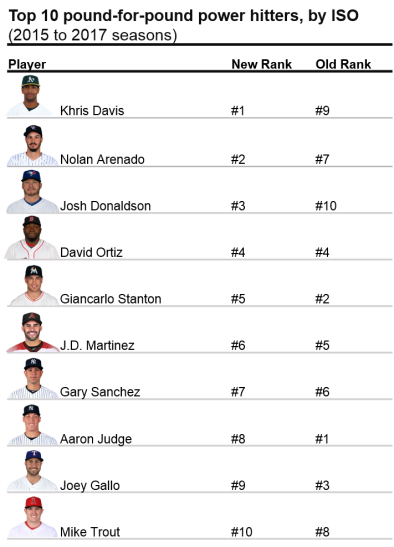
Who are the top pound-for-pound power hitters? See below for the results.

Top 10 hitters

Khris Davis, formerly the #9 top power hitter, emerges as the #1 pound-for-pound power hitter in baseball. In 2017, Davis, who is three inches and over 30 pounds below average for a Major League hitter, hit a remarkable 43 home runs in 2017, with an ISO of .281. Nolan Arenado and Josh Donaldson made similar jumps in the rankings, from #7 to #2, and #10 to #3, respectively.

Notable power hitters have fallen slightly on this list, though remain in the top 10. For example, Aaron Judge fell from the top spot to #8, while Giancarlo Stanton dropped three spots (#2 to #5). It is important to note here that these power hitters are still impressive – continuing to hold spots in the top 10, regardless of their size.

Biggest improvements in rankings

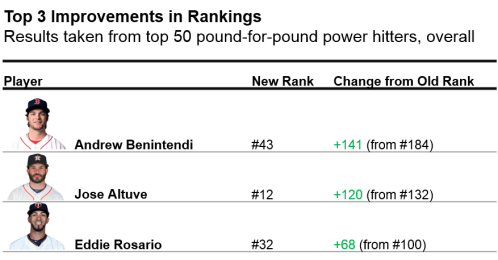
Which players showed the most improvement in the list? Below are results from the top 50 players on the list.

Top 3 improved rank players

Andrew Benintendi showed the largest increase in rankings (from 184 to 43). Jose Altuve nearly broke into the top 10, jumping from 132 to 12. Lastly, Eddie Rosario improved 68 spots (100 to 32). Altuve, in particular, has recently shown increases in power (from .146 to .194 to .202 in 2015-2017); as a result, his pound-for-pound status may continually increase in upcoming years.

Who was more impressive?

To reference the initial question in this article: was Jose Altuve’s or Aaron Judge’s power more impressive? Results from the above analyses were compiled from 2015 to 2017 seasons. To compare Altuve and Judge’s recent season, take a look below.

Altuve vs Judge

Aaron Judge tops Jose Altuve in the pound-for-pound hitter rankings – by a very thin margin – in 2017. Judge’s power performance exceeded expectations (as predicted by his height and weight) to a slightly higher degree than Altuve.

Full Rankings

If you want to see the full list of hitters for this dataset, including the worst pound-for-pound power hitters (poor Jason Heyward!), click here.

Analysis

Read the rest of this entry »


Alex Cobb Will Be One of the Gems of This Free Agent Class

Of the pitchers hitting the free-agent market this winter, Alex Cobb is not likely to receive the most fanfare.

Aces Yu Darvish and Jake Arrieta will command contracts north of $100 million. Closers Wade Davis and Greg Holland will do their best to secure four-year deals with big price tags. The whole world is watching every development in the Shohei Ohtani saga. Hell, among midmarket starting pitchers, MLB Trade Rumors predicts Lance Lynn to receive a more lucrative contract than Alex Cobb.

Cobb, who broke in as a full-time starter with Tampa Bay in 2012, has historically shown great promise and good-but-not-great results. He averaged 2.5 fWAR from 2012-2014, lost the next two seasons to Tommy John surgery, then came back with a 2.4 fWAR season in 2017. Cobb has never started 30 games in a season, nor has he ever thrown 200 innings. These facts are concerning to some, but I would argue that he is one of the wisest investments one can make this offseason.

Alex Cobb has evolved as a pitcher through pitch selection. Cobb has a great curveball. You either already know that, or you’re about to find out. He also mixes in a four-seam fastball, a splitter, and a sinker. Right now, curveballs are all the rage in baseball, resulting in tremendous success for pitchers like Rich Hill, Trevor Bauer, and Lance McCullers. They throw their curveballs so often that we can consider the breaking ball, not the fastball, to be their primary pitch. Like Hill, Bauer, and McCullers, Cobb has a quality breaking ball, so it stands to reason he should throw it more often and perhaps eschew his mediocre offerings. With Brooks Baseball, we can track the usage rate on each of his pitches throughout the season.

Look at the first couple data points for the usage rates on his pitches, and then compare them to his points at the end of the season. It’s clear that Cobb began to realize he works best by using the fastball and the curveball exclusively, so he increased his usage rate on those pitches and gradually phased out the splitter and sinker.

The question for Cobb is whether this was a good idea. In Cobb’s career, he’s only posted a strikeout-to-walk percentage (K-BB%) above 15% twice, and only ever so slightly so. He’s not bad in that regard, but it’s not where he makes his bread and butter. Fortunately for Cobb, he is one of the better pitchers in the league at inducing ground balls, which we know is favorable contact. The more grounders Cobb induces, the better he gets, and his curveball is a ground-ball machine. Consider the correlation between the rate at which Cobb increased his curveball usage and his ground-ball rate (GB%) throughout the season:

That’s a pretty strong correlation. It seems that Cobb is ready to join the Hills, Bauers, and McCullerses of the world and ride a high breaking-ball-usage rate to breakout success. Of course, it’s never going to be that easy for Cobb or anybody, but let’s go through one of his starts and parse what we can from the good and bad.

On September 4, Cobb pitched against a red-hot Minnesota Twins lineup and had one of his better starts of the season. His first batter of the game was second-half monster and fly-ball connoisseur Brian Dozier, and he managed to get him out on the first pitch.

It’s been proven that batters from the “fly-ball revolution” can be neutralized if you throw them high fastballs. These hitters are swinging up to lift the ball, but it’s difficult to put much lift on a high pitch coming in fast.

We’re going to focus on the curveball throughout this piece, but here is a fun fact about his fastball. Cobb’s heater sits at 92 MPH and had a spin rate of 2101 RPM this season, which seems pretty pedestrian. However, among starting pitchers with at least 100 batted-ball events involving fastballs, Alex Cobb’s has the 31st lowest exit velocity (87.1 MPH). To put this in perspective, that’s a better mark than James Paxton, Chris Sale, Max Scherzer, Jon Gray, Justin Verlander, and Luis Severino.

Cobb was smart to bait Dozier here, and he reaped the benefits with a first-pitch out to begin the ballgame.

In the second inning, we see Cobb pitching out of the stretch and unleashing a curveball that Ehire Adrianza buries into the ground. This will be the common theme today.

I mentioned earlier that Cobb doesn’t have the K-BB% of Chris Sale or Corey Kluber, so every once in awhile he walks batters. The common thought is that Cobb, who throws so many breaking balls, might end up behind in the count thanks to misplaced curves. Then, to get back in the count, he throws his 93 MPH fastball in the zone, which gets crushed by every hitter expecting it.

This would be a bad habit for Cobb to fall into, but he certainly didn’t in 2017. Consider the list of pitchers who threw the most curveballs while behind in the count this season (via Baseball Savant):There’s Cobb, in fifth place, not far behind Rich Hill himself. All five of these guys have great curveballs, so it makes sense for them to Trust the Process and continue dropping the hammer rather than submitting to doom and throwing a predictable fastball in the zone.

After walking the leadoff batter to start the third inning, Cobb knew Joe Mauer could make him pay. So rather than giving Mauer the fastball he wanted, Cobb began the at-bat by dropping a curveball for a strike that even froze the great Mauer.

This changed the whole at-bat, because now Mauer didn’t know whether Cobb would be coming at him with the curve or the fastball. Cobb took advantage of his opportunity, used the fastball to get him in an ideal 1-2 count, and then he went back the curveball and got Mauer to ground into a double play.

Cobb is comfortable throwing the curveball both behind in the count and with runners on base, so he can reap the rewards and induce quite a few double plays. That is an asset. Additionally, Cobb is comfortable throwing his curve from both the stretch (as we saw against Adrianza and Mauer) and from his big windup, as you can see here.

Eddie Rosario is a good hitter who made great strides late in the season, but even he found himself to be another ground-ball victim of Cobb’s curveball.

By the fifth inning, Cobb was almost through his second time against the Twins’ batting order. At this point, they weren’t sure whether to expect the curveball or the fastball, so Cobb was often ahead in the count. Here, he has Eduardo Escobar in a 1-2 count and throws a high fastball that Escobar swings right through.

Everyone in the park was expecting Cobb to throw the curveball to finish Escobar off. From a look at Escobar’s swing, it’s safe to say he was expecting a curveball himself. Cobb’s fastball isn’t necessarily anything special, but the way he uses it to pitch off the curveball can be.

With two outs in the inning, Cobb faced his 18th batter (which would complete his second time through against the opposing batting order). He quickly got Ehire Adrianza into an 0-2 count and then unleashed his best curveball of the night, which Adrianza pounded into the ground for another easy out.

At this point, Cobb had gone through the opposing order twice, pitched five innings, and only given up one run. Teams around the league are beginning to realize that most of their starters simply shouldn’t go out for the third time through the order, even if they are rolling. The Houston Astros just rode using Lance McCullers, Brad Peacock, and Charlie Morton in tandems all the way to the World Series. Those three guys are valuable pieces, and if Cobb is utilized liked this, so is he.

Unfortunately for Cobb, his pitch count was at 85, so his manager decided to bring him out for another inning. The Twins got their third look at Cobb, and I don’t need to cite the statistics to you about what happens at this point. Hitters are smart, so they can pick up on the tendencies of a pitcher if they see him so many times. Alex Cobb, as great at he was through five innings and two times through the order, is no exception to this rule.

Here is Joe Mauer taking an 0-2 curveball from Cobb and driving it into the gap in center for a double.

The important question here is, “was that Cobb’s fault or just a good piece of hitting from Joe Mauer?” Of course, the answer in baseball is always going to be both, but you can see in the embedded GIF that Cobb doesn’t necessarily leave the pitch up. In fact, if you compare it to the curveball that Cobb threw earlier in the game to get Mauer to ground into a double play, it doesn’t look much different — maybe an inch or two higher, at worst. The bigger change is Mauer, who swings like a guy fighting to stay alive in the first GIF, then like he knew exactly what was coming and how to handle it in the second.

This is the “third time through the order” effect in a microcosm. Pitches that fool batters earlier in the game become cookies, so the key is to relieve your pitcher while his pitches still fool the batters. Cobb should not be penalized by us for giving up a double to Mauer there; in 2018, analytical teams will be bringing in a new pitcher in these situations.

In this sense, Cobb is the first free-agent test case for the newest pitching trend in the industry — the tandem starter — one who pitches twice through the order, hopefully gets 15-18 outs, and then gives way to someone else. The Mets, who hired progressive Indians pitching coach Mickey Callaway to be their new manager, have made it clear that all starters not named deGrom or Syndergaard will be shielded from facing lineups more than twice in a game. Baseball has never experienced a shortage of five-inning pitchers in its history, but these changes in pitcher usage are leading to new premiums for these specialists.

It’s as simple as this: every team wants to stock their pitching staff with Alex Cobbs. To be clear, every team wants a Justin Verlander, but there is only one Justin Verlander; even horses Chris Sale and Corey Kluber showed significant wear and tear in October. To combat this dilemma, the Houston Astros deployed Lance McCullers, Brad Peacock, and Charlie Morton in five-inning tandems and rode them all the way to the last out of Game 7.

I expect Alex Cobb will fit into this role quite nicely for whichever team he signs with.


The Year of the Relief Cutter

Possibly the most infamous pitch from a single player in the history of the league is a cutter. Possibly the most infamous pitch from an active single player is a cutter. You can probably guess who those two players are, but, if not, they’re Mariano Rivera and Kenley Jansen. This is not a suggestion that these are the two best pitches of all time, as that is impossible to award. The combination of their extreme effectiveness and extreme usage has garnered the notoriety of the pitches. We are talking about inarguably the best closer of all time and arguably the best closer currently in the MLB, aside from maybe Craig Kimbrel.

Jansen’s and Rivera’s success derives almost wholly off one pitch. The pair rank 1st and 3rd in cutter usage in league history, respectively, although we only have pitch data on the latter half of Rivera’s career. Jansen has thrown it 81.3% of the time and Rivera 72.6% of the time, with Bryan Shaw sandwiched between the two at 73.5%. Of relievers who have thrown the pitch at least 20% of the time of their career, Rivera ranks 3rd and Jansen ranks 4th in standardized pitch value. Again, this does not include Rivera numbers until post-2006. When players as good as these two both thrive off the same singular pitch, it may suggest something about the pitch. In 2017, relief pitchers decided to embrace the cutter.

Now, not everyone went full Jansen and Rivera. But here are some cutter usage numbers from the five years prior to 2017, with the number of relievers who threw at least 100 cutters and the rate of cutters per fastball:

Year # of 100
Thrown
Cutter/FB
2016 34 7.54%
2015 33 7.00%
2014 31 7.55%
2013 30 7.01%
2012 27 6.14%
Average 31 7.05%

This past season, those numbers exploded to 47 relievers and an 8.58% rate of cutters for every fastball. Where is this cutter revolution coming from?

First, the uniqueness of cutters needs to be established. They are classified as “cut fastballs,” but they are not necessarily always fastballs. They can be fastballs, but they can also be a sort of harder half-slider, and most pitchers have a few ticks off their cutter in comparison to their four-seam. Here is a fastball cutter, thrown by Jansen:

And here is the half-slider cutter, thrown by Wade Davis:

It can be difficult to compare cutters because there are so many variations of the pitch, but cut fastball or half-slider, there are some clear advantages to the pitch.

Sinkers are dying in the fly-ball-revolution climate. It’s a low-spin-rate pitch sinking right into the upward barrels of hitters, and the pitch is suffering. Cutters have the highest spin rate of any fastball, rivaling the rate of breaking balls. Spin causes the ball to stay up and resist its natural movement. You can see it in Jansen’s cutter. There is no exaggerated movement, but the ball seems to have an unnatural path. The pitch appears to “cut” through the air, as the name suggests, staying on one path from release to the plate. It’s difficult to judge the pitch, as it moves unlike a fastball but does not break, all while maintaining the velocity of a fastball. The unique path of the cut fastball allows it to be thrown in the strike zone while also generating whiffs.

The advantages of the half-slider cutter are more obvious. The cutter we see with Davis holds near typical fastball velocity, but also has tight and late movement. With lesser break than the typical slider, the pitch can be established in the strike zone, but the combination of velocity and break makes it difficult to contact. The velocity and subtle movement make it harder to recognize than a slider.

The nature of the cutter’s movement combats the upswinging of the current MLB. The pitch has such a unique combination of in-between velocity and movement that makes it difficult to read and just as hard to contact. It dominates other fastball types in spin, whiffs, and damage on contact, but still can be thrown in the strike zone just the same. Hitters cannot lay off the pitch but also cannot make consistent contact because of its uniqueness.

There was not the same explosion in usage with starting pitchers, though. I’m not sure of the reasoning, but possibly because relievers are generally more whiff-seeking and we are living in a whiffing environment. Whatever explanations there are, it’s obvious that relievers loved the cutter in 2017.


The Nationals Could Use Zack Cozart

The Nationals again failed to win a round in the playoffs this year. Now, playoff success is pretty random and the Nats lost some series in Game 5, and they outscored the opponent in some of those series. However, we are in an era of super-teams in the NL with the Cubs, Dodgers and Nats all being loaded.

Also, the Nats’ window might be closing soon with Harper heading to free agency and several key players getting old. However, for next year they definitely should push all in since the division is ready for the taking, with the Phillies and Braves nearing the end of their rebuild but not winning yet in 2018, the Mets having lots of question marks regarding health (pitchers and also Conforto), and the Marlins tearing it down once again.

The Nats do have a really good team, but it is rather top-heavy. I wouldn’t call it stars and scrubs, because that would imply they have only 3-4 really good players when they have like 10 really good players, but the bottom of their roster is still weaker than the Cubs or Dodgers, who are using the more modern way of trying to bolster the bottom roster spots with 1 to 1.5 win players instead of zero or negative WAR players.

Here are the 10 players with the most PAs per team:

The Nats are right up there in wRC+ and WAR with the other big guys, and that was actually including the bad luck of losing Eaton for the year. The Nats clearly dominated the other two in top-six WAR and wRC+, but were quite bad with the bottom four. Now they will get Eaton back, which makes it a little better, but the top six actually included a 105 wRC+ for Michael Taylor, who is projected for just an 84 RC+ and was sporting some BABIP luck (.363 BABIP and .345 wOBA vs .294 xwOBA).

So the Nats could use some help with their lineup. However, their payroll is already pretty high, and the owners were not willing to spend much above that.

One solution would be getting Zack Cozart. Surprisingly, he was neither traded nor giving a QO by the Reds (I don’t understand why; the front office of the Reds at least should have tried to get a marginal return for him when they didn’t give him the QO), so he probably won’t be too expensive. Now Cozart was overperforming a lot himself and isn’t expected to get anywhere near his 5 wins of 2017 (.399 wOBA vs .332 xwOBA), and he also is 32 and had some injuries in the past, but he still is projected for 2.8 wins and a 98 wRC+, which is pretty good for a shortstop — where he is also good defensively.

That would allow the Nats to put Trea Turner back in center, where he can probably use his speed even better than at short (although he isn’t bad there), and more importantly it moves Eaton to a corner, where he is elite. So getting Cozart would improve the team both defensively and offensively and makes their lineup a little deeper with one fewer almost automatic out.

You don’t want to give him a long-term contract, but if you get him for two or even three years and around $15M per year, that wouldn’t be a bad value. Using the minus 0.5 WAR per year formula for aging past 30, you get 2.8 WAR in 2018, 2.2 in 2019 and 1.7 in 2020. That would be 6.7 WAR in three years, which is worth roughly $60M at $9M per win. I do think that he can be had cheaper, and even if the Nats decide to rebuild after 2019, having him on the hook for one more year won’t cripple them.

The Nats need to do everything to win in 2018; they can worry about the future later. And getting Cozart is a good little short-term upgrade who won’t demand a long-term commitment that might interfere with a potential rebuild in the post-Harper era.


Second Half Fly Ball Escalators – Part 1

The fly-ball revolution is upon us.  We all know this; it’s been happening since the second half of 2015 and has continued through 2017.  This doesn’t seem to be a fluke or blip on the radar.  Until MLB changes the ball or does something to shift favor to the pitchers, fly balls aren’t going away.  The ratings are up and there’s a great young crop of major league players who play with a ton of passion and they are embracing this revolution.

First, let’s start with the parameters I set for this statistical analysis.  It’s easier to see which hitters change their approach year to year but I wanted to focus on players who have increased their fly balls in the 2nd half of 2017.  I split the data between the 1st half and the 2nd half of 2017 with a minimum of 200 PA in each half.  I was only going to include hitters who increased their fly-ball rates by 4% of more between the 1st half and 2nd half but it would have excluded Byron Buxton (2.4% increase) and Giancarlo Stanton (3.4%).  I want to talk about both of them, so I went a little lenient to include those two.

Now that I have my crop of fly-ball escalators, I also included Infield Fly%, BABIP, HR/FB, and Hard Hit%.  I wanted to see the increase in fly balls affected these statistics and see whether of not they make sense or if luck played a role (I mean, it’s baseball, luck is always involved).  Keep in mind, not everyone is benefiting from hitting more fly balls.  Here’s the table of players I believe should benefit in 2018 with the increase fly balls if their approach remains the same, via Google Docs.

Eugenio Suarez

Suarez had a nice little breakout year in 2017 with a wRC+ of 117.  In the 2nd half of 2017 he significantly increased his FB% while decreasing his IFFB%.  That’s huge because of course infield fly balls are essentially an automatic out.  He did all that while increasing his LD% and hard hit%!  This to me looks like a conscious change for Suarez coming into 2018.  His overall numbers look pretty good in 2017 with a triple slash of .260/.367/.434 with 26 HRs (career high), and he’ll be entering his age-26 season.  All that being said, I think there’s still upside there.  Here is his slash for the 2nd half of 2017: .268/.378/.490 with a wRC+ of 126!  For reference, here are few players with similar wRC+ in 2017: Gary Sanchez (130), Nolan Arenado (129), Domingo Santana (126), and Chris Taylor! (126) (more on him later), and Brian Dozier (124).  You get the idea.  But can Suarez do it for a full season?  If he does, we are looking at a 30-100 player in 2018 hitting 4th or 5th behind Joey Votto and Adam Duvall.  In my opinion, he’s a better hitter than Duvall and should be slotted behind Votto.

Of this group of 2nd half fly-ball surgers, Suarez is one of the more intriguing for fantasy purposes.  Suarez is and has been the starting 3rd baseman for the Reds, but he’s also one of only two players on the roster who have logged significant time at SS within the last three seasons (the other being Jose Peraza) now that Zack Cozart is gone.  Nick Senzel, who finished the season in AAA, is knocking on the door and 3rd base is his main position, but they are giving him reps at 2nd (which should tell you they like Suarez at 3rd).  This creates a logjam at 2nd with Scooter Gennett but still doesn’t solve the shallow SS position.  Maybe the Reds address it or maybe Suarez plays some shortstop and on those days, Senzel moves to 3rd.  If this happens and Suarez gains SS eligibility, he could be at top 8-10 shortstop right behind Corey Seager.

Manuel Margot

Coming into 2017, Margot was a consensus top 50 prospect and was ranked 24th overall by Baseball America.  Eric Longenhagen of FanGraphs graded him at a 70 speed score out of a possible 80. So far, it checks out per Baseball Savant, as he ranks 8th in average sprint speed in all of baseball.  Something else you may notice on Margot’s FanGraphs page is the potential for a 55 raw power grade.  You can’t totally ignore the 40 game power grade, but these are the types of guys who have proved to benefit the most from the “juiced ball.”  Keep in mind that Margot played all of 2017 at age 22.  This kid is still learning the game and developing power.

That being said, his batted-ball profile leaves a lot to be desired.  He made a lot of soft contact and, of course, not a whole lot of hard contact.  However, based on the 1st half / 2nd half splits, he made adjustments with not only more fly balls and line drives but harder contact.  That’s a good sign, but yet his BABIP dropped in the 2nd half.  Sure, a speedster like Margot can benefit from weakly-hit ground balls (part of the reason Billy Hamilton doesn’t hit below the Mendoza line), but the increase in line drives should have certainly increased his BABIP.  The point is, even with the slight improvement in wRC+ between the 1st and 2nd halves, he was still unlucky.

I expect Margot to continue to make improvements with the bat in 2018.  I don’t expect him to reach the 55 raw power grade, but he’s moving in the right direction.  I also expect him to improve on the bases and utilize his speed a little more while he’s still at his peak (as far as speed in concerned).  There’s an intriguing window with young players who possess speed and untapped raw power where the speed is still at (or near) its peak and the raw power begins to materialize.  Margot will be approaching that window in 2018 at age 23, so you need to jump in now before he’s fully reached that window and becomes a premier power/speed threat that is so rare in fantasy baseball these days.  Jump in now while his ADP is around 200 and you could be rewarded with around 15-18 HRs and 20+ steals in 2018.  His upside could be somewhere around Mookie Betts’ 2017 without the runs and RBI numbers.  Will he ever reach those heights?  I can’t say for sure, but it’s intriguing.  In keeper/dynasty leagues, he’s a great asset to have at his current value.

Logan Forsythe

Forsythe was hampered by injuries in 2017; he broke his toe in April of 2017 and only appeared in 119 games.  In those games he had 439 PA, and hit .224 with six HRs and three steals.  Woof.  Why is he a thing for fantasy baseball in 2018 at age 31?  Well, first the Dodgers traded Jose De Leon to the Rays for him last off-season and exercised his option for 2018. With Utley now gone, second base is his to keep or lose.  So playing time is there unless they sign another 2nd baseman this off-season.  On the plus side, he walked at a career high 15.7% clip and had some big at-bats in the post-season, carrying at least some momentum into 2018.

You would expect Forsythe’s numbers to improve in the second half due to the toe injury in April, and the numbers in the 2nd half look awfully good.  Yes, his line drive rate did drop by 2.8%, but the net positive on FB% + LD% is 12.6% and his hard-hit rate increased by 10.9% in the 2nd half!  That massive BABIP drop of 0.082 seems way out of whack to me.  That’s the reason he hit .201 in the 2nd half.  Now, I’m not saying he’s going to go nuts, but he also cut his SwStr% to 6.6% and his O-Swing% to a career-low 18.7%.  So there are a lot of potential positives with Forsythe in both the average and power departments, based on my research.  I expect the K% to go back down to about 20%, the BABIP to go up about .020 points, and the HR/FB% to be back in the double digits.  His value is going to depend on playing time.  If he platoons, he’s an NL-only bat.  If he doesn’t and gets, say, 550 PA, he could go something like .258/.339 with 14 HRs and seven steals, becoming a solid deep-league MI.

Jacoby Ellsbury

Over the last year or so I had left Jacoby Ellsbury for dead until this research piece.  All of his batted-ball data in the second half of 2017 point to improved results. While his 2nd half 107 wRC+ was an improvement on his 95 wRC+ in the 1st half, I’d argue he was extremely unlucky and it should have been much higher.

Let’s look at the positives: his K% dropped, BB% went up, FB% went up, IFFB% went down, and hard hit% went up.  So then why did his BABIP, HR/FB, and BA (albeit minimally) all go down?  I don’t know.  How’s that for an answer?  In my opinion, it can be chalked up to straight-up bad luck.

Since the Yankees are clearly moving in another direction, Ellsbury may not have a starting spot with Judge, Gardner, and now Hicks listed as starters, with Clint Frazier ready to be a full-time major-league starter when healthy.  The best chance for Ellsbury is to be traded where he can start.  Of course with his huge contract, that could prove to be difficult.  Hypothetically, though, if it happens, he’s good for 20+ steals; he was 22-for-25 last year so his speed is still there, and steals are becoming more and more infrequent.  For fantasy in 2018, he could be a solid 4th or 5th outfielder, going .270 and 10-20 next year.


The 2018 Hall of Fame Pity Vote Candidates

Oh look people, it’s Hall of Fame season, which means it’s time for tired articles about Pete Rose and Barry Bonds, impassioned pleas for Mike Mussina and Larry Walker, glowing remembrances of Jim Thome and Chipper Jones, and the hottest takes about Curt Schilling’s Twitter account. But there is one annual piece that dares to break the trope and remember the lesser players on the ballot and decide who among them is worthy of receiving a single vote for the Hall of Fame. No rehashing Trevor Hoffman vs. Billy Wagner here, just looking at the best candidates to receive a pity vote. In previous years I have endorsed Jason Kendall, Edgar Renteria, and Mike Cameron as players worthy of a pity vote. Let’s see who meets the mark this year.

First we need to eliminate reasonable candidates. My standard has been likelihood of receiving three or more votes. Now this isn’t a perfect standard — I don’t think anyone would consider Mike Sweeney or Magglio Ordonez real candidates, but they have both gotten three votes in recent years — but it’s a good estimate of where the line between guys getting pity votes and guys who might be getting real votes lies. Of this year’s candidates, there are a number we can easily eliminate. Chipper Jones will likely get 95% or higher, and Jim Thome seems likely to get over the 75% mark this year as well. Omar Vizquel will more than likely at least hit double digits in percent, even if he was probably a worse player than Mike Cameron, who got completely shut out last year. It’s a little harder to gauge Scott Rolen, Johan Santana, and Andruw Jones. Their cases require some level of nuance, so there’s a wide range where they could end up. I’d say all three certainly deserve to stick around for at least a second ballot (personally, I’d vote for Rolen with no hesitation), and I feel pretty confidently they’ll each manage to reach double digits in total vote count.

The difficult choices for me are Johnny Damon and Jamie Moyer. Neither will stick on this ballot because neither has much of a case at all. But they might have enough of one to net more than two votes. Johnny Damon had a reputation as a great player, and he played in a lot of playoff series for high-profile teams and stuck around long enough to get some gaudy counting stats. There was even some brief talk about him possibly pushing to 3,000 hits. There hasn’t been a candidate with a super similar profile in a few years, but going back to 2014, we had Moises Alou receive six votes and Luis Gonzalez garner five. Now, I think both those players were better than Damon, but I think he’s perceived to be about the same level. While there’s a chance he doesn’t get more than two votes, he could definitely push into the 5-6 range. So I’m going to group him in with the non-pity vote guys. That being said, there’s a solid chance he only gets one or two votes.

Even more difficult to judge is Jaime Moyer. There haven’t been many pitchers hitting the ballot who had long, nice careers that weren’t real Hall of Fame candidates to compare to him. Moyer was better than Kenny Rogers, who got one vote in 2014, but he was definitely worse than David Wells, who managed five a year earlier. My made-up estimate is that Moyer will receive ~2.1 votes on average, so I’ll lean on the side of caution and not consider him for the honor of a pity vote.

Finally, let’s pour one out for Ben Sheets, who is, by a not insignificant margin, the best eligible player not to appear on this ballot. While he’s not quite the omission that Javier Vazquez was last year, Sheets was quite a good pitcher. He pitched like a Hall of Famer for one season (2004) and started the All-Star Game in another (2008). He has more WAR as a Brewer than any other pitcher, and ranks fourth overall in franchise history.


Carlos Zambrano (30.6 WAR) finished fifth in the Cy Young voting three separate times and was a fringe top-10 pitcher for three or four years, although he did walk a lot of dudes. Along with Mike Hampton and Dontrelle Willis, he was one of the good-hitting pitchers of his era. While his wRC+ was a pretty mediocre 57, his 24 career home runs (in 774 PA) are impressive for a pitcher. From 2001-2012, the length of his career, Zambrano hit 50% more home runs than any other pitcher. Yovani Gallardo and the aforementioned Mike Hampton are the only other guys in double digits. Zambrano was also known for wearing his heart on his sleeve, which just serves to make him a bit more memorable. Overall, Zambrano was a pretty good player, and a reasonably interesting one as well, but his career was rather short — he’s only 36. That being said, it’s not like an extra five years of quality pitching would turn him into a Hall of Fame candidate, or even a Jaime Moyer-level candidate.

Chris Carpenter (39.1 WAR) won a Cy Young award in 2005 and finished in the top three in the voting in 2006 and 2009. In between, he had two years lost to injury, which was a recurring theme with Carpenter. For a guy who didn’t become an above-average pitcher until he was 29, and missed quite a bit of time for injury, he had himself a nice career. In fact, if he had been able to stay healthy, he likely would have avoided eligibility for a pity vote, but alas, he’s stuck competing with these guys.

You probably remember Livan Hernandez (34.5 WAR) pitching a boring game for or against your favorite team. I’m not sure how, but I’m pretty sure Livan Hernandez pitched every inning for both the Padres and the Pirates in their July 29-31 series in 2004. Yeah, Baseball-Reference might say that Josh Fogg and Kip Wells and the other Adam Eaton and Brian Lawrence pitched those games, but those players all had the spirit of Livan Hernandez in them. In his career (1996-2012) Livan Hernandez officially pitched 3189 innings, which is 200 more innings than second place (Jaime Moyer!). Unofficially, I’m pretty sure he pitched about 55,000 innings and counting.

I mostly remember Carlos Lee (27.5 WAR) for signing a big contract with the Astros that just never seemed to end. Lee could rake with anyone, hitting both for power and for average, and he was generally pretty durable, but his poor defense kept him from being very valuable. There are two things in his favor as a pity vote candidate. For one thing, his top Similarity Score from B-R is Hall of Famer Orlando Cepeda. Yes, Cepeda is an iffier Hall of Famer, and yes, Andres “The Big Cat” Galarraga is third on that list, but that’s something. Carlos Lee also ranks seventh all-time in career grand slams. Well, he’s tied for seventh, with Jimmie Foxx and Ted Williams. Of the players ahead of him, three (Lou Gehrig, Eddie Murray, and Willie McCovey) are Hall of Famers, two (Alex Rodriguez and Manny Ramirez) would be if not for steroid drama, and one (Robin Ventura) is Robin Ventura. That’s some pretty good company, The Big Cat included.

Kevin Millwood (46.2 WAR) was almost certainly better than you remember him being. He ranks 22nd in WAR among starting pitchers since 1995, which places him immediately ahead of Johan Santana and Cole Hamels. Of course, Millwood first achieved success as the Braves’ fourth starter behind Greg Maddux, John Smoltz, and Tom Glavine, so it’s not hard to look bland compared to those guys. But Millwood garnered some legitimate accolades in his career. He threw a no-hitter, he led the AL in ERA in 2005 despite having a losing record, and he finished third in Cy Young voting in 1999. Even with that, I must say he had one of the more boring careers of a pitcher of his caliber.

Aubrey Huff (17.1 WAR), amazingly, is still one of the Rays’ franchise leaders in WAR among position players. He ranks tenth with a staggering 9.9 WAR, placing him among other Rays legends like Matt Joyce and Jason Bartlett. All joking aside, Huff was a fine, well-rounded hitter who couldn’t field a lick. Possibly the strangest aspect of his career, though, was his 2010 campaign for the Giants. He had a truly moribund season in 2009, and I mean it in the literal ‘about to die’ sense. But in 2010, at age 33, he decided to be good at everything baseball-related he possibly could be. His walk rate skyrocketed to 12.4%, well above his typical 8-9% range, and he hit 26 dingers, which is really like 47 when you account for the fact that he was hitting left-handed in AT&T Park. Even his defense, not traditionally one of Huff’s strong suits, was pretty solid, both at first base and in corner-outfield positions. Overall, he was good for 5.8 WAR and finished seventh in NL MVP voting. If this had been the start of some sort of late-career resurgence, Huff would have been an excellent pity vote candidate, but it turned out to just be a last gasp in a dead career, as he only survived for two more godawful seasons.

Orlando Hudson (21.1 WAR) was a solid all-around player — good defense, average offense. The type of guy who bats seventh on a pennant winner. He won four Gold Gloves and made a couple of All-Star games, but really, he wasn’t a particularly special player in any way. Cool guy, but really, a boring player.

It’s incredible to think that Kerry Wood (23.7 WAR) was in the majors as recently as 2012. I mean, he was basically broken by 2004, but still managed to limp along for nearly a decade. Well, I shouldn’t really say limp, because he did have a solid year in relief in 2008, but for the most part it was limping. To be honest, looking back on Wood’s career, it wasn’t exactly incredible in terms of value. While he did strike out anything that moved, he was also rather walk-prone — 4.34 per nine innings for his career. He never again matched his 4.4 WAR as a rookie and only crossed the 200 inning mark twice, and only one of those was during Dusty Baker’s tenure, so don’t blame him. Of course, I can’t continue without mentioning the 20 strikeout game, because, well, he struck out 20 guys in nine innings.

Brad Lidge (11.6 WAR), like Kerry Wood, struck out a lot of guys. In 2004, with the Astros, he struck out 42.6% of batters he faced. At the time, this was the third-most strike-out-iest season by a reliever ever, behind only Billy Wagner‘s 1999 season and Eric Gagne’s 2003 season. Now it’s been passed by some Craig Kimbrel and Aroldis Chapman nonsense, bu that shouldn’t diminish from Lidge’s dominance. Lidge was also fantastic with the Phillies in 2008. They won the pennant and he came in fourth in Cy Young voting and eighth in MVP voting. Of course, it wasn’t all sunshine and roses. Lidge gave up a whole lot of walks. And he was hilariously awful in 2009. I mean, pitcher wins and ERA are pretty blunt tools for a reliever, but they tell a story here — Lidge went 0-8 with 7.21 ERA. What’s particularly impressive is that he actually sustained that ERA for months. Despite consistent usage, he never dropped below a 6.75 ERA for a day after April. Still got those 31 saves though.

I’m not actually going to do all the legwork, but I can say with some degree of certainty that Jason Isringhausen (11.2 WAR) is the best player ever drafted and signed in the 44th round. He was a good closer for the Cardinals for a few years. Made a pair of All-Star Games. He’s in a three-way tie for 26th in all time saves, which doesn’t sound that impressive. But one of those guys he’s tied with is Hall of Famer Bruce Sutter! And the other one is…Fernando Rodney.

Hideki Matsui (12.9 WAR) is probably the best non-Ichiro position player to come out of Japan. He won the MVP for the 2009 World Series, and he made a pair of All-Star Games, and he was remarkably durable, not missing a game for his first three years in MLB. That being said, Matsui’s bat was just good and not great, and his lack of quality glovework made him just a nice player. He only once reached 3 WAR in a season, which is less than even Orlando Hudson. Notable player, but not a particularly good one.


Now we come to the hard part. Who deserves a pity vote? Well, I can quickly eliminate Hudson, Huff, Matsui, Lidge, and Isringhausen. No offense to any of those guys. All were quality players. But if one of them were missing from the ballot and say…Adam Kennedy were in their place, I don’t think I would have gone through the effort to mention them as a snub. Sorry y’all. I think I’m going to eliminate Kerry Wood from consideration as well. While one particularly good game may be enough to get Jack Morris into the Hall of Fame, I don’t think it’s enough to earn a pity vote. And Carlos Lee, while a better player than any of the above group, isn’t exactly screaming out for further recognition.

That leaves us with four pitchers. Of them, I’d say Carpenter has the most impressive peak, Millwood has the most impressive full career, and Zambrano has the most impressive bat. But my choice has to be the one and only Livan Hernandez.

The way I see it, a pity vote is supposed to do one of two things. You should either shine a light on a good player, who is clearly not a Hall of Famer, but shouldn’t be forgotten. Or it should be to remember and acknowledge a guy who represented something to a generation of fans. Livan Hernandez definitely falls into the latter of these two. Livan Hernandez represents every Livan Hernandez-type pitcher who has ever done Livan Hernandez-type things. Joe Blanton. Carl PavanoJason VargasBronson Arroyo. Gil Meche. Freddy GarciaKevin Correa. Kyle Lohse. Brad PennyJason Marquis. Sidney PonsonAaron Harang. Jeremy Guthrie. Ian Kennedy. Jon GarlandMatt MorrisErvin Santana. Jeff Suppan. Mike Leake. Randy Wolf. Jake Westbrook. Livan HernandezLivan Hernandez.


In Defense of Secret Hall of Fame Ballots

As a baseball nerd, I enjoy reading Ryan Thibodaux’s (Thibodaux’?) yearly tally of Baseball Hall of Fame ballots. I participate in the yearly gnashing of teeth at Murray Chass’s intentionally blank Hall of Fame ballot.

But one thing I’m not behind is the push for mandatory public Hall of Fame ballots. (The Hall rejected the BBWAA’s vote to make every ballot public.) Secrecy in balloting among private citizens is a value worth defending, even if the votes themselves are based on malice or stupidity.

A brief history:

The English tradition was to vote with one’s voice, as evidenced by Virginia’s early voting methods:

As each freeholder came before the sheriff, his name was called out in a loud voice, and the sheriff inquired how he would vote. The freeholder replied by giving the name of his preference. The appropriate clerk then wrote down the voter’s name, the sheriff announced it as enrolled, and often the candidate for whom he had voted arose, bowed, and publicly thanked him.

Even as ballots shifted to paper ballots, the votes themselves were publicly displayed, often counted in plain sight of the public. But as should be unsurprising, the public ballot meant that public pressure could be exerted on any person’s vote. Bribes and threats were frequent.

Eventually ballots were printed by local party bosses. The secret ballot soon began to gain steam as a potential innovation in England and Australia. In England, intimidation was pervasive:

He referred the intimidation exercised by landlords on tenants . . . , by employers on the employed, by customers on shopkeeper. . . .  He had known half a congregation leave their parson and set up another place of worship on account of his vote, thus depriving him of a considerable part of his income.

(Boycott by Hall of Fame ballot would admittedly be fun.) Brazen vote purchasing was common in American politics, with the 1880s producing multiple tainted national elections.

By the 1950s, the secrecy of the ballot was a core American value, as seen in Twelve Angry Men:

JUROR SEVEN: Who was it? I think we have a right to know.

JUROR ELEVEN: Excuse me. This was a secret ballot. We agreed on this point, no? If the gentleman wants it to remain secret…

JUROR THREE: What do you mean? There are no secrets in here! . . .

. . . .

JUROR ELEVEN [omitted in film version]: Please. I would like to say something here. I have always thought that a man was entitled to have unpopular opinions in this country. This is the reason I came here. I wanted to have the right to disagree. In my own country, I am ashamed to say that.

Why have a secret ballot? The primary goal is that a voter is protected from public pressures. As a party boss, I wouldn’t know if you voted for my candidate or another one, so threats and bribes have no guarantee of success. And as a sports fan, I wouldn’t know if you voted for Roger Clemens or not, regardless of what your public posturing on steroids may have been.

(There were plenty of reasons why the printed secret ballot had negative consequences on turnout, namely imposing a quasi-requirement of literacy, but the secrecy of the ballot was not the problem there.)

So where does this leave us with the Hall of Fame ballot? Do these reasons of secrecy apply to the BBWAA? I don’t think we have to worry about vote buying (Deadspin notwithstanding), but I guess my position relates to first principles of the Hall of Fame ballot. With this vote, we want an honest accounting of whether a supermajority of voters believes said player belongs in the Hall. We may have problems with the percentage necessary, or the number of votes on the ballot or the composition of the electorate itself, but the purpose of the Hall is to see who the electorate believes is a Hall of Famer in their hearts, not in the face of public scrutiny. Unless we just want to have a JAWS cut-off and eliminate the electorate entirely, there must be something ineffable about the Hall of Fame, something that comes from a private evaluation of one’s emotions. The sportswriters are not elected by us, nor are they supposed to be “accountable to the public.”

There are of course strong arguments against anonymity in voting. Yoav Fromer argues that the secret ballot allows people the luxury of voting for positions that are publicly unpalatable. Without needing to defend their choices, voters can simply hide behind the secret ballot and avoid public accountability. Similarly, John Stuart Mill worried that in private people would be more prone to bias or dishonesty: “People will give dishonest or mean votes from lucre, from malice, from pique, from personal rivalry, even from the interests or prejudices of class or sect, more readily in secret than in public.”

But part of the reason the Hall is built around these secret ballots is the belief that we do want the raw honest truth from the voters. We don’t want their public opinions; we want to know what they believe in their dark hearts. And if they really can’t quite stomach voting for a “steroid guy” or they think Jack Morris just feels like a Hall of Famer, we want those flawed, messy and private emotions packed into their vote.

Furthermore, it’s not clear that Fromer and Mill are correct in practice when it comes to the BBWAA ballot. As it turns out, many people are quite willing to hold unpopular public opinions, and the publicity of ballots has not made Murray Chass or Dan Shaughnessy behave like any less of a dolt. In 2017, only five ballots were anonymous anyways.

If people want to reveal their ballots, more power to them. And kudos to Thibodaux for asking for ballots and to those voters who disclose their reasons for voting. These efforts undoubtedly add to our public discourse on what the Hall is and means.

I understand that I’m probably standing against the tide of history on this one. But we should not be quite so quick to force the disclosure of private votes simply because they may be unpopular positions.