Johan Camargo Deserves your Attention
If you’re following the Atlanta Braves this season — and it would be hard not to, as they’ve lead the NL East for a large portion of the first hal — there’s a lot that may draw your eye. Ozzie Albies, Ronald Acuña have provided anticipation. Nick Markakis has surprised. Freddie Freeman has been himself. A host of pitchers, like Mike Foltynewicz, Sean Newcomb, Mike Soroka, Shane Carle, AJ Minter, and Dan Winkler, have all emerged as more than expected in some respect. But another name should also grab your attention: 24-year-old, switch-hitting Johan Camargo.
The Atlanta system has been among the best in baseball the last couple years, boasting both depth and top end talent. The litany of players above largely verifies that. Two years ago, the last time Camargo was eligible to be on a prospect list, he was effectively ranked as the 52nd-best prospect in the team’s system by FanGraphs. He was said to be “a plus defender at third” but also that “his feel for hitting and lack of balance at the plate are both non-starters.” He was ultimately compared to Abraham Nunez.
While Nunez enjoyed a long professional career, he also retired being worse than a replacement level player. His career fWAR was -1.4. Upon arriving in the Majors last year, Camargo seemed to immediately dispel any such comparison. His defense between shortstop and third base was passable, but his bat was more than anyone ever seemed to imagine. He mustered a 102 wRC+ in 82 games, which was 14% better than Nunez ever achieved.
Camargo performed that way largely on the tails of a .368 average on balls in play. Sustainable? Probably not, but it was something, and way more than what was ever expected of him. That’s already a win for a team’s 52nd-best prospect. But this year he’s gone from something to something to write home about.

All of his numbers so far jump off the chart. Last season he whiffed five times more than he walked. This year he’s walking an additional 8% and striking out less. He’s driving the ball at a clip that’s 33% higher than last year. He’s been 15% better than the average Major League hitter, and that’s with his average on balls in play dropping more than 80 points! That’s fantastic! So for the second time in as many years, Johan Camargo is forcing us to beg the question: is he for real?

Well, dang. His walk rate skyrocketing seems legitimate with how much less he’s swinging at balls out of the zone. Spitting on offerings that are inherently less hittable will influence the rest of his batted ball profile, too. He’s traded in weaker contact for harder contact. Hard contact throughout the league is up by nearly 4% from last year. That’s substantial because the amount of balls in play is in the thousands — think of it like getting a 4% raise in a single year, compared to, say, 1.5% for cost of living. Alex Chamberlain recently examined how it’s meant less overall, but this much is clear: Camargo is still knocking the crap out of the ball.
This authority has lead to improved exit velocity on line drives and fly balls. Last year, on average, Camargo hit balls in the air at 91.4 mph. This year he’s doing it at 93.8 mph. The tick and a half might not seem like much but it moves him from the 23rd percentile in all the Majors to the 76th. And considering his average launch angle on those balls in play — 25.4 degrees — it’s significant. Rob Arthur has found that “the very best hitters in MLB tend to smack lots of balls with launch angles around 25 degrees and exit velocities above 90 miles per hour,” and so far Camargo is only trending upward.
We might be able to contribute this next gear at the plate from Camargo to a more exaggerated leg kick. See below for yourself.
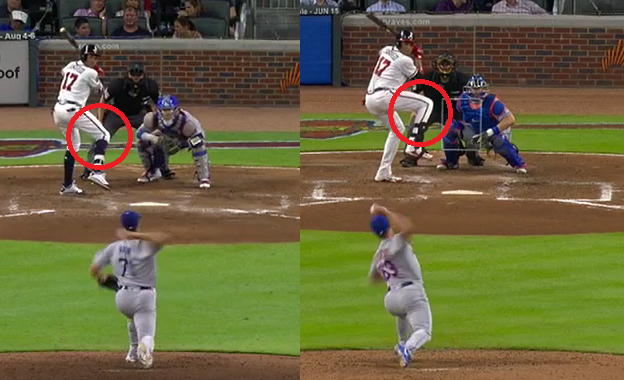
On the left is Camargo in 2017 when he first showed us he might be more than we thought. On the right is him in 2018, as he insists that he is. Leg kicks like this are timing mechanisms players use to establish rhythm at the dish. His teammate Ozzie Albies, who is also a switch hitter blasting by his projections, employs a similarly pronounced leg kick. Camargo seems to have found one that does the job for him, providing him the balance and feel at the plate he lacked as a minor leaguer.
Maybe we’d have heard more about Camargo by now if he was on a different team, or if Atlanta hadn’t surged to contention so quickly. Maybe it’s tougher to see how far he’s come given that he started so far off everyone’s radar, or that he’s supposed to be a utility man and placeholder for prospect Austin Riley. But Johan Camargo is more than any of that, and he’s showing us how.
—
Exit velocity, launch angles, and stills from Baseball Savant. All other data from FanGraphs.