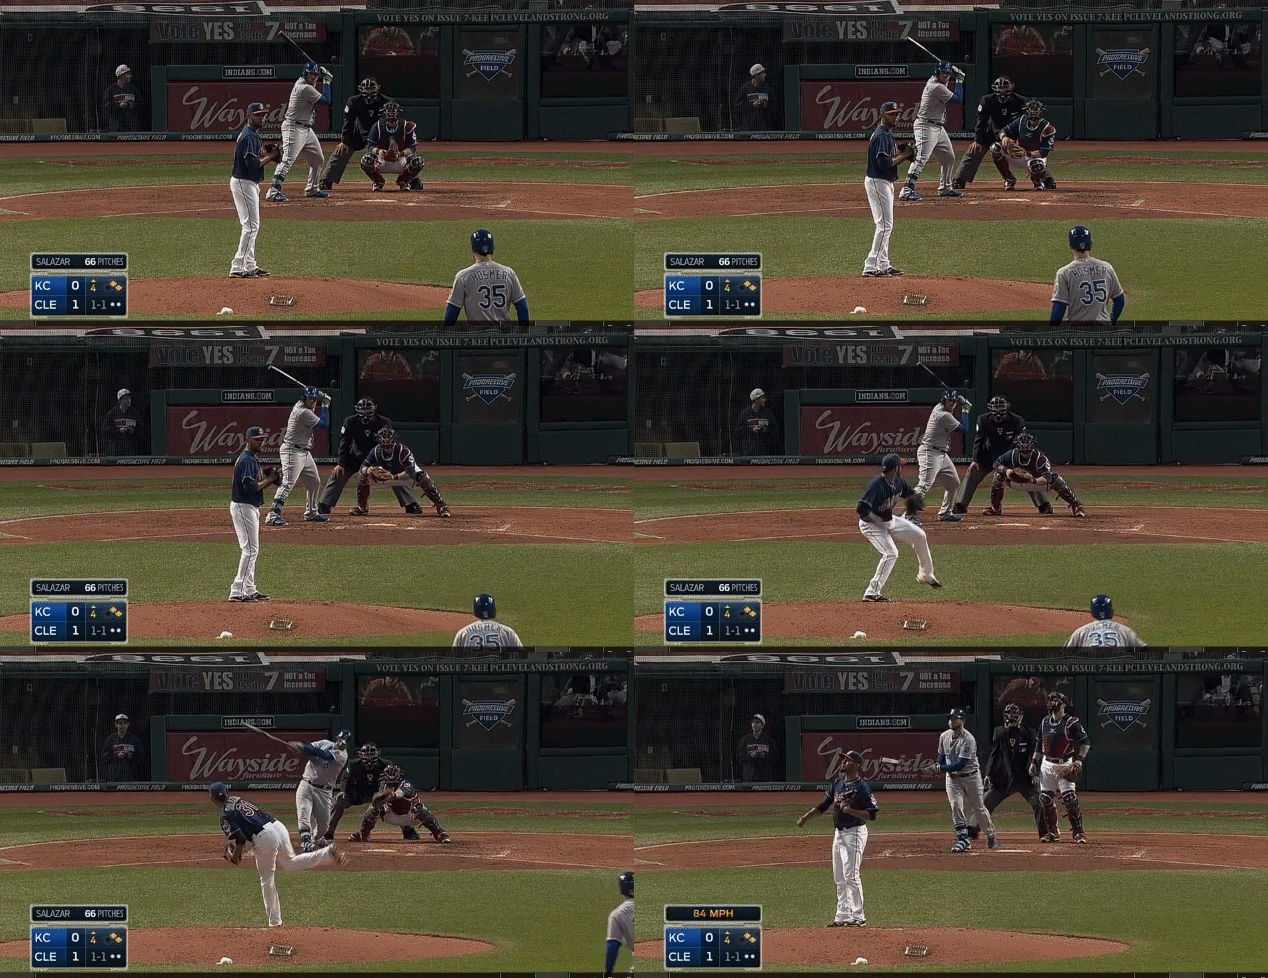
Danny Salazar, Not According to Plan

Last season, Danny Salazar was among a wave of hard-throwing young pitchers that made electrifying debuts down the stretch, falling upon the national eye during the postseason.

Salazar threw 52 regular season innings over 10 starts in 2013, posting a 3.12 ERA and 3.16 FIP while striking out more than 11 batters per nine innings. His 30.8 K% was second of all starting pitchers who threw at least 50 innings, putting him behind only Yu Darvish and right ahead of Max Scherzer. His 2.75 xFIP was third in that same pool of pitchers, trailing only Matt Harvey and Felix Hernandez. His 14.6% swinging-strike percentage was tops in baseball, beating Francisco Liriano’s second-place rate by more than a full percentage point.

For 1/3 of the 2013 MLB season, 23-year-old Danny Salazar was among the most dominant starting pitchers in baseball. But with that kind of performance comes high expectations, and thus far, unlike young peers Sonny Gray, Michael Wacha and Alex Wood, Salazar is not living up to expectations.

Through his first four starts, Salazar sports a 7.85 ERA and a 5.70 FIP. Strikeouts are down, walks are up, and he has allowed five home runs in 18 innings.

Despite how good Salazar was in 2013, those who follow him and/or the Indians will likely remember his season by two big swings from two big men in two big games.

To wit:

Miggy

Miguel Cabrera hit that on the first pitch with two outs in the eighth inning of a late season game between two divisional rivals battling for first place. It gave the Tigers a one-run lead, they went on to win and it was a key momentum shift in the American League Central race. Salazar had been dynamite that evening, striking out 10 Tigers and fanning Cabrera in his first three trips to the plate, until the best hitter in the MLB ultimately came out on top. It was a “welcome to the big leagues” moment right out of a screenplay.

Delmon

Here, Delmon Young got a first pitch fastball in the third inning of an AL Wild Card play-in game and hit a no-doubter as no-doubty as any no-doubter could be. The Rays went on to win and Cleveland’s first playoff appearance in six years was gone as quickly as it came.

These two blemishes on an otherwise stellar 2013 campaign foreshadowed what Danny Salazar would struggle with early in the 2014 season.

Both these pitches were left up in the zone and Salazar paid for them. Elevated pitches are nothing out of the ordinary for Salazar. He works up in the zone often, as pitchers who can throw 100 miles per hour tend to and should do.

salazarzone

It contributed to some of his success last year, but it’s also contributing to his failures this year. There were two red flags in Salazar’s 2013 numbers that were concerning to begin with and are now trending in the wrong direction. The first was his inability to generate ground balls. Salazar’s ground ball rate of 34.4% would have ranked in the bottom 10 of qualified starting pitchers last season. To make matters worse, 13.7% of Salazar’s fly balls left the yard, also a bottom-10 figure. It’s tough for any pitcher to sustain success without generating ground balls or while giving up a lot of home runs. Combine the two and you’ve got a problem on your hands.

Danny Salazar knows he needs to get more ground balls. In spring training he was working on “being a little more consistent with keeping the ball down.”

That’s not exactly happening. Salazar’s ground ball rate has plummeted to 25.9%. His HR/FB is up to 18.5%. Let’s take a look at the home runs that Salazar has conceded through his first four starts of 2014.

No. 1 – Chris Colabello

hr1

86 mph slider, elevated and left over the heart of the plate.

No. 2 – Alexei Ramirez

hr2

85 mph split finger changeup that was thrown right down the middle of the plate and stayed up for too long.

No. 3 – Jose Abreu

hr3

88 mph slider, left way up in the zone and over the heart of the plate. Can’t hang a slider much worse than that and Salazar knew it immediately.

No. 4 – Ian Kinsler

hr4

This one was a fastball. Flat and elevated. It was a 3-1 count and Kinsler knew the fastball was coming. 18 times in Danny Salazar’s young career has he found himself in a 3-1 count. All 18 times he has come back with a fastball. Kinsler knew Salazar couldn’t trust his offspeed stuff, sat on the fastball and put it in the left field seats to give the Tigers a 4-3 lead.

No. 5 – Mike Moustakas

hr5

84 mph slider elevated and left over the middle to an opposite-handed hitter. Might be even worse than the pitch to Abreu.

The slider clearly is an issue. Every time a batter has got a hit off Danny Salazar’s slider this season, that hit has been a home run. Consider this simple scatter chart of Salazar’s sliders in 2014:
slider
What you’ve got down at the bottom there is six sliders in the dirt, five of which went for balls. Of the remaining 20 sliders that weren’t in the dirt, only six were below the waist, where you want a good slider to wind up. That’s a lot of elevated, hittable sliders, as evidenced by the three in the middle there that went out of the park.

Then there’s the split change. This is Salazar’s out pitch. Its elite 22% whiff rate last year was the best in his arsenal and a result it accounted for nearly half of his strikeouts. However, it also needs to serve as his ground ball pitch, seeing his slider doesn’t generate any grounders, his fastball lives up in the zone and he doesn’t really throw a sinker or two seamer. Last season the split change had a 10.7% ground ball rate. This year, he has gotten only two ground balls with it and his rate is down to 2.99%. This could have something to do with the fact that, after watching video of his last start, Salazar believes he may be tipping the pitch. “With my changeup sometimes, I open up my glove too much,” Salazar said.

So, the split change isn’t getting any ground balls and he may be letting the batter know it’s coming. The sliders are all up in the zone and every time someone hits one it goes out of the park. Factor into the equation that his fastball velocity has dropped two miles per hour and its whiff rate has gone from 14% to 9% and its not hard to see why Salazar has struggled early on. All three of his pitches have had something wrong with them.

The Indians shouldn’t be so quick to pull the trigger on demoting him as some have suggested just yet, as this four game sample shouldn’t make us forget the elite production Salazar proved he was capable of last season. But that’s not to ignore that four games and 18 innings already make up nearly 30% of his major league body of work and his career ERA and FIP have already jumped to 4.35 and 3.83. With Trevor Bauer seemingly finding new life in Triple-A, if Danny Salazar doesn’t begin to correct these trends over his next several starts, you’ll have to wonder how long the Indians can let him work on trying to fix all three of his pitches.


Why is Bronson Arroyo Still Throwing a Changeup?

I respect the change-up. As a pitcher myself, I know how difficult it is to throw a good one (thus I don’t). It’s not the most glamorous pitch in baseball, but certainly an effective one if executed correctly. Plus, what constitutes a good off-speed offering reads like a laundry list of mechanical and ball path attributes that have to be repeated over and over again. Proper grip on the baseball. Delivery and arm speed must be identical to the fastball. Velocity needs to be lower than the fastball. The ball should move (ideally both horizontally and vertically) and spotted in a good location. And lastly, there’s the intangible pitching IQ of understanding when to throw it.

The Diamondbacks Bronson Arroyo and his change-up seem to be missing a majority of these qualities… but for some reason he continues to throw the darned thing. 16% of the time in 2013, in fact, and already almost 18% of the time this season. I’m baffled.

Now, of course I can’t know what’s going on in his head (although if someone can point me to an all-encompassing Pitching IQ metric I would be more than happy to apply it). And I also can’t measure his arm velocity at release. So I can’t quantify all of his deficiencies. But there is, fortunately, hard numerical and visual data showing he’s lacking the necessary skills to throw a change-up well.

Let’s look at Arroyo compared to pitchers who threw more than 200 change-ups between 2011 and 2013:

Movement:

Since change-ups (especially the circle change) tend to move down and to the right for right-handed pitchers versus down and to the left for southpaws, absolute value of x-Mov and z-Mov is used to standardize axis movement for both.

2011-2013 Abs(x-Mov) Abs(z-Mov)
League Average 7.17 4.30
Arroyo 6.00 3.60

I’ll give him a C- for movement. F’s are left for the likes of a Samuel Dedunowho posted a whopping 0.3″ of lateral and 1.6″ vertical (ignoring the natural pull of gravity) movement in 2013.

Velocity:

Again, keep in mind this does not include all pitchers, just ones who have thrown 200 or more change-ups between 2011 and 2013.

2011-2013 vFA (pfx) vCH (pfx)
League Average 90.9 82.9
Arroyo 86.6 78.2

When batters are already sitting on a below average fastball, it’s fair to say it won’t take much of an adjustment to catch up to the change. Below average may even be an understatement. There are only 12 guys in this data set of 275 with a lower average vFA. Jamie Moyer is one of them.

D+.

Location:

There are very few pitchers that can have success locating the change-up for called strikes.  Fernando Rodney being the freak off-speed guru who fools batters looking with a career 46.2 Swing%, 48.8 Zone% and 1.51 Val/C on the change. Typically the best change hurlers induce swings. And those swings either result in bad contact or a flat out whiff. But location of the pitch is still overwhelmingly crucial to achieve either.

I’ll use 2013 poor contact master Hyun-Jin Ryu and Braves injured whiff king Kris Medlen for illustration.

Ryu, with his 56.2 Swing% and 70.9 Contact% is looking to get bat on ball with the change. Ending 2013 with a .187 BABIP, the pitch worked beautifully to induce dribbling grounders (54.7 GB%) to an already above average Dodgers defense (3.1 UZR/150). How did he do it? Pin-perfect location (courtesy of Brooks Baseball).

 photo 74025e6d-0ca0-4068-802d-d2575977591e_zps07ccd3d1.png

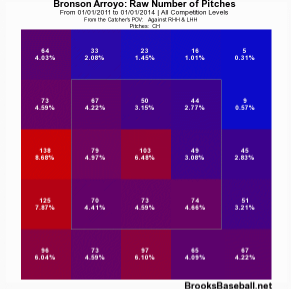
Arroyo also induces hitters to get the bat on the ball with the change… at a whopping 85.5 Contact% rate. But is he getting poor contact with the pitch? I somehow don’t think .600+ SLG and 23 HR  over the past three full seasons would constitute bad contact. Let’s compare his zone chart with that of Ryu.

 photo 53238386-6da5-4f8b-9c21-44707dbd34a3_zpsc37ace95.png


Not quite, Bronson.

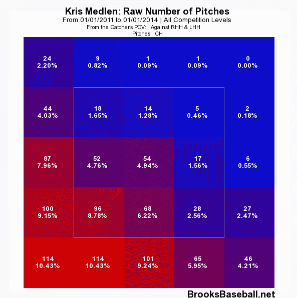
“But what about whiffs?” you ask. With a 6.8 career SwStr%, batters aren’t swinging and missing Arroyo’s meatballs either.

Let’s look at Medlen who owns a 27.5 career SwStr% on the pitch for comparison.
 photo 312d97a3-59b7-474d-8d46-43e4196b2988_zps9c5924cd.png

Pretty, no?

I’ll give Arroyo a D- for location. At least he’s not hanging them up and in on lefties.

So overall grade: barely passing.

I really don’t know what to say at this point. I’m miffed. Confounded. And who is the culprit to blame in the grand mystery of why he continues to throw this sub-par pitch? Batters have already gone deep on it twice in 2014. Is it the catchers? Do we point the finger at Devin MesoracoRyan Hanigan, and now Miguel Montero for keeping blind faith and confidence? Are these guys cursed with chronic short-term memory loss? Or do we blame Arroyo for stubbornly going out there outing after outing and continuing to shove that ball in the back of his palm and firing away? If that’s the case, I get it. I’m a pitcher. I’ve stood there on the mound and though, “This next one will be better, guys. I swear!”

So, please, Bronson. In the end, there is really nothing good that has come from you throwing the thing so often. I like you. I really do. I will forever be indebted to you for giving my beloved 2004 Red Sox their first World Series since “tarnation” was a common curse word. But please. Enough change-ups already.


Alden Carrithers and Being Good Enough

Alden Carrithers is twenty-nine years old, has zero major league at-bats, and has never hit more than three home runs in any minor league season.

Which is kind of why he’s so amazing, because he just might be relevant. Perhaps Carrithers won’t be relevant to the all-star game, or perhaps he’ll never even be relevant to major league baseball. What that doesn’t mean, however, is that he shouldn’t be. Carrithers is never going to play in the midsummer classic — that’s an assumption that can be made with a high degree of certainty — but there is a good case to be made that he belongs in Major League Baseball.

Carrithers has only one really plus tool, but that tool is pretty fantastic. This is Carrithers’ seventh season in the minor leagues, and in every single one of them he has more walks than strikeouts. That likely won’t hold up in the major leagues, but it will continue to at least some extent. Reaching base often for free while rarely taking the automatic trip back to the dugout is the kind of thing that generates value, and it’s the kind of thing that Alden Carrithers is. This isn’t a novel, new concept. But it is something that’s hard to always remember and realize, and really factor in to a player that would otherwise be labeled as Quad-A at best.

Because as much as this is, this really isn’t an article about Alden Carrithers. It could be about Mike O’Neill who had a ridiculous 91 walks with only 37 strikeouts last season, or it could be about Jamie Johnson of the Tigers, who’s had many more walks than strikeouts in his past two seasons. But those guys have flaws in their games that are pretty obvious, and they’re all further away from proving themselves ready for the show than Alden. This is really an article about something-for-nothing guys, and how available they are.

A naïve argument against the necessity for an article that points out the possible worth of a player of Alden Carrithers’ type is that these guys exist in bulk. That argument is more arguing against the very premise of WAR itself, however, since replacement level is very intentionally set to where it represents just that — replacement level players. There aren’t an abundance of one WAR guys hanging around. If there were, WAR would simply be wrong. There are, however, an abundance of zero WAR guys hanging around, which is kind of the idea.

Back to Alden, and why he’s probably not just another one of the zero WAR guys. The bane, of course, is his power. He’s never hit more than three dingers, as mentioned earlier, and his ISO has fluttered in the range of .066 without ever reaching higher than his rookie-ball .114. The literally outstanding plate discipline makes up for a lot of that, but in and of itself the plate discipline isn’t enough to make him a major league player.

His defense projects to be solid without being fantastic. There’s a lack of data on defense in the minor leagues, but the majority of scouting reports on him have been generally agreeable without being glowing. He can play second base, which gives him a little immediate boost in value, while also being able to pitch in at third base as well as left field. He’s only really projectable defensively at second base for any long-term stint, but that’s not a terrible thing. Second base is currently the third-weakest position in baseball from a hitting perspective — only catcher and shortstop are worse. And while shortstops and catchers are often able to add value simply by being capable of playing catcher and/or shortstop, the same often isn’t true with second basemen. The basic point is that second base is probably currently the worst position in baseball. It’s really hard to be good enough to play major league baseball, but if one is inclined to do so then second base is probably a good choice.

His speed is of the same ilk as his defense, in the sense that it is solidly useful as well as unspectacular. He’s stolen bases at a 77% clip throughout his minor league career, but he’s only stolen 89 bases total, suggesting that while his baserunning isn’t prolific it is in fact solid. This is further backed up by his Bill James speed score that has hovered just north of 5 throughout his career (suggesting just north of average). Oliver projects Carrithers to have a WAR/600 of 1.8, which is a reasonable projection although it probably slightly over-rates his defense (6.3 runs above average) while under-rating his running (-1.6 runs above average). The wOBA projection is at .297, which is roughly in line with Steamer and ZiPS.

All that said, if a starter goes down and Carrithers has to play for a quarter of the season or so he will likely contribute about half a win. A second baseman will probably go down this season, and he will probably be replaced with a zero WAR level player. Ryan Goins is currently the starting second baseman for the Blue Jays, and he’s a zero WAR player. Last year Dan Uggla became terrible and the Braves replaced him with Eliot Johnson who ended the season as–wait for it–a zero WAR player. Meanwhile Carrithers was available via a phone call, forty miles down the road at Triple-A Gwinnett.

This past winter, Carrithers was basically available for anyone who wanted him as a minor league free agent. The Oakland Athletics picked him up, and he’s currently at their triple-A affiliate Sacramento in the PCL. The A’s already have Callaspo, Sogard, and Punto playing second base at the major league level, all of whom are probably a little better than Carrithers. But Carrithers also isn’t that much worse than those guys, from a total value perspective. If any or all of those guys go down the A’s won’t be hurt that much, and it cost them nothing. It’s this sort of thing that (along with a lot of other sorts of things) gets a team ahead in a game where everything can feel random. The A’s, after all, are still moneyballing. That hasn’t stopped yet.

Carrithers will probably never wear a uniform in a major league stadium. But if he does, it will probably be the kind of uniform-wearing that will help the team he’s playing for win baseball games. Something for nothing, is a pretty good way to win.


Modeling Future Contract Extensions

Last month, Dave Cameron published a brilliant yet simple free-agent pricing model.  Using only projected 2014 WAR (ZiPS and Steamer projections are averaged) and the assumption that one incremental win is worth $5 million, it accurately projects the contract length and cost of last offseason’s free agents.  Cameron also made some minor tweaks to his model to project 2015 free agent contracts.  Both articles are absolutely worth checking out in full.

It’d be fun and easy to extend Cameron’s model to predict what David Price (2016), Chris Davis (2016), and Giancarlo Stanton (2017) would make on the free agent market.  (If you’re curious, Price would get 6/$136, Crush would get 6/$112, and Stanton would get 9/$260, assuming that the value of an incremental win increases annually by $500,000.)

But the recent slate of massive contract extensions illustrates the folly of this exercise.  Savvy front offices lock up top talent before it hits free agency, usually at a discount relative to the free agent market.  Young players often prefer an immediate certain payday rather than rolling the dice in free agency, when their future value will be far more unpredictable.  A model that predicts the value of contract extensions would thus be a useful counterpart to the free agent pricing model.  You’re in luck, because I just built one.

I kept the basic contours of Cameron’s model in place; as before, the only inputs are projected 2014 WAR and an estimated value of an incremental win.  This gives us the contract length (projected 2014 WAR times a multiplier that scales up depending on the WAR projection) and average annual value (projected 2014 WAR times $5 million).

To test the accuracy of this approach, I compared the extension model’s output to 32 contract extensions that have been signed since July 1, 2013.  I excluded players projected to produce less than 1 WAR this season.  I estimated the value of an incremental win produced by a closer as $10 million, which lines up with what closers earned in free agency last offseason.  If a player’s extension kicks in after the 2014 season, I counted the remainder of his current contract as part of the extension.

Free Agent Model vs. Actual Contracts

Player Team 2014 WAR Proj Yrs Proj Amount Proj AAV Act Yrs Act Amount Act AAV $/WAR
Mike Trout Angels 8.6 17 $731 $43 7 $146 $21 $2.4
Miguel Cabrera Tigers 6.0 12 $357 $30 10 $292 $29 $4.9
Clayton Kershaw Dodgers 4.7 8 $186 $23 7 $215 $31 $6.6
Dustin Pedroia Red Sox 4.6 9 $207 $23 8 $110 $14 $3.0
Andrelton Simmons Braves 4.5 9 $200 $22 7 $58 $8 $1.9
Jason Heyward Braves 4.1 8 $164 $21 2 $13 $7 $1.6
Matt Carpenter Cardinals 3.6 7 $126 $18 6 $52 $9 $2.4
Freddie Freeman Braves 3.5 7 $121 $17 8 $135 $17 $4.9
Jason Kipnis Indians 3.5 7 $121 $17 6 $53 $9 $2.5
Ian Desmond Nationals 3.2 6 $95 $16 2 $18 $9 $2.9
Jose Quintana White Sox 3.1 5 $78 $16 5 $27 $5 $1.7
Starling Marte Pirates 3.1 6 $92 $15 6 $31 $5 $1.7
Chase Utley Phillies 3.0 4 $59 $15 2 $25 $13 $4.2
Coco Crisp A’s 3.0 4 $59 $15 3 $30 $10 $3.4
Yan Gomes Indians 3.0 4 $59 $15 6 $23 $4 $1.3
Brett Gardner Yankees 2.8 4 $55 $14 5 $58 $12 $4.2
David Ortiz Red Sox 2.7 2 $27 $14 2 $31 $16 $5.7
Jordan Zimmermann Nationals 2.7 4 $54 $14 2 $24 $12 $4.4
Jedd Gyorko Padres 2.7 4 $54 $14 6 $35 $6 $2.2
Homer Bailey Reds 2.6 4 $51 $13 6 $105 $18 $6.9
Hunter Pence Giants 2.4 4 $48 $12 5 $90 $18 $7.5
Julio Teheran Braves 2.3 3 $34 $11 6 $32 $5 $2.4
Tim Lincecum Giants 2.0 2 $20 $10 2 $35 $18 $9.0
Will Venable Padres 1.9 2 $19 $9 2 $9 $4 $2.3
Jose Altuve Astros 1.9 2 $19 $9 4 $13 $3 $1.7
Craig Kimbrel Braves 1.8 7 $123 $18 4 $42 $11 $6.0
Ryan Hanigan Rays 1.6 2 $16 $8 3 $11 $4 $2.3
Michael Brantley Indians 1.6 2 $16 $8 4 $25 $6 $4.0
Chris Archer Rays 1.5 2 $15 $8 6 $26 $4 $2.9
Martin Perez Rangers 1.5 2 $15 $8 4 $13 $3 $2.2
Charlie Morton Pirates 1.4 1 $7 $7 3 $21 $7 $5.2
Glen Perkins Twins 1.0 4 $40 $10 4 $22 $6 $5.5

The initial results are mixed.  The model comes very close to the actual average extension contract length (prediction of 5.1 years vs. actual of 4.8 years), but badly overshoots the actual AAV.  Again, this is because GMs pay more for a win on the free agent market than for a win produced by a player already on their roster.  To account for this, I set the value of an incremental win at $3.7 million, the average WAR / $ of the 30 non-closers’ contract extensions.  (For closers, I used $7.4 million.)

Extension Model vs. Actual Contracts

Player Team 2014 WAR Ext Yrs Ext Amount Ext AAV Act Yrs Act Amount Act AAV $/WAR
Mike Trout Angels 8.6 17 $541 $32 7 $146 $21 $2.4
Miguel Cabrera Tigers 6.0 12 $264 $22 10 $292 $29 $4.9
Clayton Kershaw Dodgers 4.7 8 $138 $17 7 $215 $31 $6.6
Dustin Pedroia Red Sox 4.6 9 $153 $17 8 $110 $14 $3.0
Andrelton Simmons Braves 4.5 9 $148 $16 7 $58 $8 $1.9
Jason Heyward Braves 4.1 8 $121 $15 2 $13 $7 $1.6
Matt Carpenter Cardinals 3.6 7 $93 $13 6 $52 $9 $2.4
Freddie Freeman Braves 3.5 7 $89 $13 8 $135 $17 $4.9
Jason Kipnis Indians 3.5 7 $89 $13 6 $53 $9 $2.5
Ian Desmond Nationals 3.2 6 $70 $12 2 $18 $9 $2.9
Jose Quintana White Sox 3.1 5 $57 $11 5 $27 $5 $1.7
Starling Marte Pirates 3.1 6 $68 $11 6 $31 $5 $1.7
Chase Utley Phillies 3.0 4 $44 $11 2 $25 $13 $4.2
Coco Crisp A’s 3.0 4 $44 $11 3 $30 $10 $3.4
Yan Gomes Indians 3.0 4 $44 $11 6 $23 $4 $1.3
Brett Gardner Yankees 2.8 4 $41 $10 5 $58 $12 $4.2
David Ortiz Red Sox 2.7 2 $20 $10 2 $31 $16 $5.7
Jordan Zimmermann Nationals 2.7 4 $40 $10 2 $24 $12 $4.4
Jedd Gyorko Padres 2.7 4 $40 $10 6 $35 $6 $2.2
Homer Bailey Reds 2.6 4 $38 $9 6 $105 $18 $6.9
Hunter Pence Giants 2.4 4 $36 $9 5 $90 $18 $7.5
Julio Teheran Braves 2.3 3 $25 $8 6 $32 $5 $2.4
Tim Lincecum Giants 2.0 2 $14 $7 2 $35 $18 $9.0
Will Venable Padres 1.9 2 $14 $7 2 $9 $4 $2.3
Jose Altuve Astros 1.9 2 $14 $7 4 $13 $3 $1.7
Craig Kimbrel Braves 1.8 7 $91 $13 4 $42 $11 $6.0
Ryan Hanigan Rays 1.6 2 $12 $6 3 $11 $4 $2.3
Michael Brantley Indians 1.6 2 $11 $6 4 $25 $6 $4.0
Chris Archer Rays 1.5 2 $11 $6 6 $26 $4 $2.9
Martin Perez Rangers 1.5 2 $11 $6 4 $13 $3 $2.2
Charlie Morton Pirates 1.4 1 $5 $5 3 $21 $7 $5.2
Glen Perkins Twins 1.0 4 $30 $7 4 $22 $6 $5.5

With the adjustment to $/WAR, the results look much better.  The predicted average AAV ($11.3 million) is now only 6% higher than the actual average ($10.6 million.)  For the 31 players on the list (excluding Mike Trout, an outlier if there ever was one), the model projects a total of 147 years and $1.87 billion in contracts; the actual sums are 146 years and $1.67 billion.  Not perfect, but decent.

The model misses very badly for unusual situations.  Jason Heyward and Ian Desmond are projected as 8/$121 and 6/$70 respectively, but they both signed 2 year contracts worth less than $20 million last offseason.  Both players were unable to come to terms with their teams on longer deals.  This is probably because they are the odd men out on teams that have either just made it rain on prodigious young talent (Kimbrel, Freeman, Simmons) or will do so in the near future (Strasburg, Harper).  Instead, Heyward and Desmond opted for shorter contracts in order to avoid arbitration and set themselves up for 2016 free agency.

Mike Trout is a unique case.  The fishy outfielder signed a 7 year, $146 million extension last month, which looks like a massive underpay compared to the 17 years, $541 million (!!!) the model says he is worth.  Don’t get me wrong: for the Angels, the Trout signing is still the best deal since the Louisiana Purchase.  But it’s unrealistic to conclude that the Angels saved $395 million, since nobody would wait until Chelsea Clinton’s second term to test free agency, least of all someone who is currently breaking baseball.

Despite these shortcomings, the model can still evaluate the wisdom of recent extensions.  Plotting the 32 players on a 2×2 matrix (the x-axis is the difference between actual and projected AAV, and the y-axis is the difference between actual and projected contract length) shows which front offices overpaid and which got steals.

Scatterplot of Contract Extensions

Slide1

The extensions fall into four groups: locked-in bargains, short-term bargains, “win now” splurges, and albatrosses.

  • Locked-in bargains are the best kind of extension: these contracts are cheap and relatively long.  Yan Gomes is a good example; the model thinks he’s worth $11 million a year for 4 years, but the Indians locked him down for $4 million a year for 6 years.  Initially, I felt bad that Yan missed out on an extra $20 million, but then I remembered that he’s a millionaire in his mid-20s who probably sleeps well at night, whereas I am a non-millionaire in his mid-20s who does not play a sport for a living.
  • Short-term bargains are contracts that are cheap but shorter than projected.  According to the model, Andrelton Simmons is worth $13 million a year for 9 years; the Braves signed him for $16 million a year for 7 years.  So the Braves paid a below-market AAV for Simmons, but deprived themselves of controlling him for two more years (at least in theory).  One caveat here: as explained earlier, Heyward and Desmond fit into this quadrant because their teams were unwilling to pay out for longer contracts, and Trout is simply a freak show.
  • Win now splurges are contracts that are expensive but relatively short.  Clayton Kershaw fits here because he makes $14 million more per year than the model thinks he deserves, but has a 7 year contract rather than the 8 years the model would give him.  One could argue that Kershaw is a potential albatross, but if he leads the Dodgers to a World Series this year, their fans, like the Honey Badger, won’t care.
  • Albatrosses are exactly what they sound like: excessively long, pricey contracts that make fan bases cry.  Hunter Pence and Homer Bailey are the biggest albatrosses on the list; they were paid an extra $42 million (Pence) and $67 million (Bailey) than the model says they’re worth.  Miguel Cabrera really belongs in this quadrant as well.  The model considers Miggy a win now splurge, but only because it thinks he deserves 12 years rather than 10.  No, Tigers fans, Mike Ilitch did not help me build this model.

Finally, the model can estimate how much your team should pay to extend your favorite young star.

Extension Model for 2015-18 FAs under 30 with WAR > 2

Player FA Year Age in 2014 2014 WAR Ext Years Ext Amount Ext AAV
Yu Darvish 2018 27 5.1 9 $168 $19
Giancarlo Stanton 2017 24 4.5 9 $148 $16
Max Scherzer 2015 29 4.6 8 $136 $17
Jason Heyward 2016 24 4.1 8 $121 $15
Carlos Gomez 2017 28 4.0 8 $117 $15
David Price 2016 28 4.2 7 $109 $16
Pablo Sandoval 2015 27 3.7 7 $95 $14
Chase Headley 2015 29 3.6 7 $92 $13
Carlos Gonzalez 2018 28 3.5 7 $91 $13
Chris Davis 2016 28 3.5 7 $89 $13
Brett Lawrie 2018 24 3.4 7 $88 $13
Stephen Strasburg 2017 25 3.5 6 $78 $13
Carlos Santana 2018 27 4.0 5 $73 $15
Jay Bruce 2018 27 3.2 6 $70 $12
Ian Desmond 2016 28 3.2 6 $70 $12
Matt Wieters 2016 27 3.6 5 $67 $13
Justin Masterson 2015 29 3.1 5 $56 $11
George Springer 2019 24 3.0 5 $56 $11
Jason Castro 2017 26 3.2 4 $47 $12
Jonathan Lucroy 2018 27 3.2 4 $47 $12
Brandon Belt 2018 25 2.8 4 $41 $10
Desmond Jennings 2018 27 2.8 4 $41 $10
Jordan Zimmermann 2016 27 2.7 4 $40 $10
Colby Rasmus 2015 27 2.7 4 $40 $10
Yoenis Cespedes 2018 28 2.7 4 $39 $10
Pedro Alvarez 2017 27 2.7 4 $39 $10
Eric Hosmer 2018 24 2.6 4 $38 $10
Johnny Cueto 2016 28 2.2 3 $24 $8
Yovani Gallardo 2016 28 2.1 3 $23 $8
Billy Butler 2016 27 2.1 3 $23 $8
Jed Lowrie 2015 29 2.1 3 $23 $8
Brandon Morrow 2016 29 2.1 3 $23 $8
Asdrubal Cabrera 2015 28 2.1 3 $23 $8

To return to our earlier examples, Chris Davis would get 7 years and $89 million, David Price would get 7 years and $109 million, and Giancarlo Stanton would get 9 years and $148 million if they signed extensions this season.  Of course, it’s tough to predict who will sign an extension and who will try their luck in free agency.  Build me a model that can do that, and I’ll eat my Mets hat.


Battle of the Ks: K/9, K/BB and K%

The great debate has been raging for years: which strikeout-related metric is a better predictor of actual pitching success? Some would say there is no right or wrong answer — that each metric has it’s own unique merit and value. That one must look at certain strikeout-related metrics in combination with others. Unfortunately, as tragic as it may seem, statistical evidence begs to differ. Statistics tell us there is in fact a right answer, and it’s a whopper.

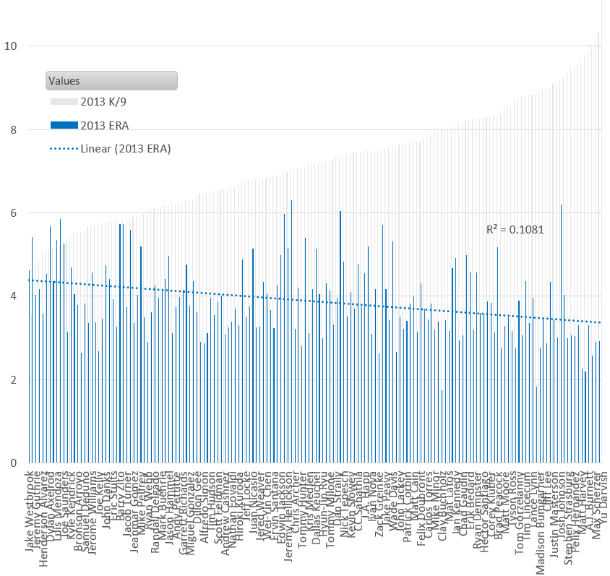
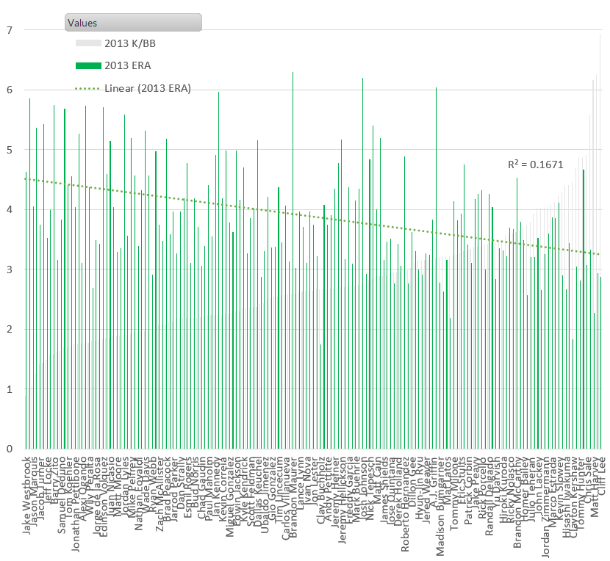
Let’s start with K/9. Looking at all 2013 pitchers with 80+ innings, the correlation (R2) between strikeouts per 9 and ERA is a solid  .1081. This correlation has been consistent, plus or minus a few hundredths, for the past five years. So nothing exciting or anomalous can be found in looking at other seasons. Yu Darvish leads the category with Tony Cingrani, Max Scherzer, Anibal Sanchez, and A.J. Burnett rounding out the top five. Additionally, eight of the top ten K/9 leaders ended up with sub 3.10 ERAs. So a decent indicator all-around.

 photo 53a65e17-24d6-482d-b2de-766753f09051_zps2940fbe7.png

K/BB get’s a bit more interesting. We see a jump in linear correlation to .1671 — more than a 50% increase over K/9. Clayton Kershaw, Cliff Lee, and Adam Wainwright  all leap into the top ten of this metric, with Hisashi Iwakuma climbing into the top fifteen — four elite hurlers in 2013 left out of the K/9 leaderboard.

 photo 98225caf-a307-44c3-850b-d610a9444d32_zps70ee67d9.png

But the real gem is K%. It shows double the correlation versus K/9. Plus, the top fifteen in this category ended the year with sub 3.30 ERA — whereas Scott Kazmir (4.04) and Josh Johnson (6.20) smeared the good name of the K/9 leaderboard; with Kevin Slowey (4.11) and Dan Haren (4.67) unpleasantly loitering on the K/BB board.

The reason K% is so powerful is that it simplifies how effective a pitcher is at simply striking out each batter he faces. When BABIP gets involved — as it does for K/9 (high BABIP pitchers are rewarded on K/9 since the number of outs remains the same even if they’re giving up, say, 10+ hits per game) — the value of each strikeout is severely reduced.

 photo 17feabf1-8665-45c5-af39-48d69923e54a_zpsf45972cf.png


To recap:

2013 R2 (correlation to ERA)
K/9 .1081
K/BB .1671
K% .2089

So should we end the debate completely? No. But if you asked me to put money on Tim Lincecum, a career 25.8 K% pitcher with no decline in the stat over the past 2 years, over Tyler Chatwood, a career 13.0 K% who had a breakout year in 2013 with his freakish 76.3% LOB, I would bet on Lincecum every doggone time.


Brandon Belt Fooling Around with His Identity

We know not to read too much into statistics at the beginning of the season. As of right now, Allen Craig is hitting a line of .154/.211/.231. Sure, it’s ugly — but then it’s only been 14 games. A year ago, Michael Morse hit six homers in his first 14 games, and then only hit seven more for the rest of the season. The small-sample-size game can work so many different ways. A hot start could indicate a breakout season, but then again it could not. A cold start could indicate a clunker, then again it could not. One interesting story in the first 14 games of the season is Brandon Belt.

Belt is off to a hot start this season, and is tied — with notable power hitters Jose Bautista and Pedro Alvarez — for second in the league in homers, with five. There is reason to think that this is Belt’s year to become a legitimate power threat. Belt’s power did increase from an ISO of .146 in 2012 to .193 in 2013. For context, Adrian Beltre had an ISO of .193 in 2013 and hit 30 home runs.

Given this evidence, and the hot start, it could be that Belt is developing into a first baseman’s mold. A first baseman who can hit for power, hit fourth in the lineup, and drive in RBIs, excites baseball fans.  However, Belt hasn’t been a conventional first baseman. In fact, he goes against the positional identity.

Belt has been well known for his passivity. In his first two full seasons, he had a walk rate of at least 9.1% and a .360 OBP in both of those seasons. Belt has always shown tremendous knowledge of the strike zone. As a 21-year-old, he took a page out of Nick Johnson’s book and posted a walk rate of 17.4% in 77 games at High-A Ball.  Although Minor League stats should be taken with a grain of salt, Belt’s high walk-rate definitely means that he’s no free swinger. Belt is a similar first baseman to Freddie Freeman and Joey Votto. Belt might not be as good as those guys, but the profile remains the same: first basemen who walk a lot and hit well, but don’t hit an outrageous number of homers.

Oddly enough, the passivity for which Belt has been known hasn’t shown up in his hot start. Through his first 14 games this season, Belt has had a walk rate of 4.8%. Again, this is based on only 14 games and therefore there is a lot of time for Belt to show his patience, however the trend is interesting: Belt is known for drawing a lot of walks and not hitting home runs, begins the season by hitting a lot of homers and not drawing a lot of walks.

Belt’s walks are definitely going to go up; he’s too much of a passive hitter to not walk a lot, and you can’t be a viable major leaguer walking only 1.9% of the time. However, the main question is whether or not the power is sustainable. The updated ZiPs and Steamer projections estimate that Belt finishes the season with between 21-22 homers this year. Both systems don’t see Belt having a significant power jump.

However, it is worth noting that most of the dingers Belt has hit have come on pitches that were low and inside.

Belt was able to turn on a loopy off-speed pitch from Zack Greinke that was low and inside, and take it to right-field. Most of Belt’s other home runs have come off of low inside pitches. This is where Belt’s power is coming from.

While the early power surge is promising, Belt may not make a gigantic leap as a power hitter. Neither projection system sees this kind of leap, and pitchers are probably going to learn to avoid throwing inside to Belt. Belt may be a little more aggressive this year, his OBP and SLG may trade some points, however he’s still going to get a good number of walks. It’s too early to tell whether Belt has turned into the power hitting first baseman that most people want him to be. For now, Belt is still Belt — a first baseman with moderate power and a lot of patience.


What Would it Take for Andrelton Simmons to Be the MVP?

Andrelton Simmons is awesome.

If you are reading this article on FanGraphs.com right now, this comes as no surprise to you. And I’m not using “awesome” in the way people use it to describe the latest episode of Pretty Little Liars or whatever vanilla bullshit thing they’re drinking from Starbucks. I’m using it in its literal definition of being awe-inspiring:

awe·some, adjective. inspiring an overwhelming feeling of reverence, admiration, or fear; causing or inducing awe: an awesome sight.

The reason you know Andrelton Simmons to be awesome is because of the things he does in the field while playing shortstop. Here, be inspired by awe:

Awesome.

But he’s not a bad hitter, either. In fact, right now, in 2014, he has been a pretty great hitter. His 146 wRC+ is sixth among shortstops and he has a higher wOBA than Hanley Ramirez. His .268 isolated slugging percentage exceeds Edwin Encarnacion’s mark from 2013, and Edwin Encarnacion slugged 36 dingers that year. In 45 plate appearances, Simmons hasn’t struck out one time. Andrelton Simmons, thus far, appears to be making strides at the plate.

When you’re the best defensive player in the major leagues, you don’t need to do much with the bat to be a pretty great player. Last season, you may be surprised to find out that Simmons, despite not even being a league-average hitter, racked up 4.6 WAR. That total was good for 13th in the National League, right next to teammate Freddie Freeman who finished fifth in the MVP voting and also made a really great stretch in that .gif up there.

Anyway, I’m really starting to bury the lede, although I guess really the lede is right there in the title, which I have to assume you read considering you clicked on it and are now here.

Simmons received a couple of 8th and 9th place MVP votes last season while being a below-average hitter. Simmons, thus far, appears to be getting better as a hitter. Just how much better would Andrelton Simmons need to be at the plate to be the best player in the National League?

Let’s begin:

Intro

First, we need to figure out what our endgame here is. We want Simmons to be the most valuable player in the National League. The average WAR of National League MVP winners over the last four seasons is 7.4. We’re going to see what improvements, in areas other than the field, we can make to Simmons’ game in an attempt to get him to at least 7.0 WAR to get him in the discussion. In order to accumulate the most WAR possible, we’re going to assume that Simmons plays all 162 games and racks up 679 plate appearances for the Braves in this hypothetical MVP season. He played in 157 in his first full-length season last year and figures to play pretty much everyday until something goes wrong. The 679 PA is simply an extrapolation of his 2012 plate appearances.

Batting average

Last season, Simmons batted just .248. Not many people win MVP awards with batting averages under .250. Lucky for Simmons, he appeared to be unlucky. His .247 batting average on balls in play was fifth-lowest of all qualified batters in 2013, and was 50 points less than the league average. We know he isn’t going to sustain a BABIP 50 points less than the league average. However, Simmons does have a flaw in his batting profile that makes him especially susceptible to a low BABIP. He led the MLB with 38 infield pop-ups last season. Infield pop-ups literally never go for hits, so it’s not as easy as just regressing his BABIP back to the league average. His career BABIP is .262 and the league average is .297. Let’s say he cuts into his infield pop-ups a bit and gets a little lucky on grounders finding holes over the course of the season. We’ll meet in the middle and call it .280.

Plate discipline

Simmons’ plate discipline was already the strong suit of his offensive profile and it appears to only be getting better. Last year, Simmons’ contact rate was 87.5%, a top-10 mark in the National League. As I mentioned earlier, he has yet to strike out one time this season, the only starter in the MLB who can still make that claim. Last year, Simmons’ strikeout percentage was 8.4%. Considering his strikeout-less streak to begin the season, we can expect improvement on that number. I’ll side with Steamer on this one, whose updated 2014 projection has him finishing with a strikeout percentage of 7.5%.

As is typical with a player that has such high contact rates, Simmons doesn’t walk much. Why take pitches when you’re one of the best in the league at putting the bat on the ball? Last year, Simmons had a walk percentage of 6.1%. With his improved strikeout rate, we can assume a little bit of improvement in the walk department as well, but not much. We’ll bump it up to 6.5%.

Power

This is the part of Andrelton Simmons’ game that surprised people last season. First, he’s a shortstop, and most shortstops don’t hit for power. Second, he didn’t hit for power in the minor leagues. In 1,042 minor league plate appearances — a little less than two full seasons — Simmons only hit six home runs and never posted an isolated slugging percentage higher than .126. Simmons burst onto the scene last year by hitting 17 home runs and posting an ISO of .149. This year, through 11 games, Simmons has already hit two home runs and his ISO sits at a ridiculous .268.

The power appears to be real and is a result of his approach at the plate, which is unique. Most players with contact rates as high as Simmons — guys like Alexei Ramirez, Erick Aybar or Jose Altuve — make their mark by hitting line drives or hard ground balls that find holes. You usually either sell out for contact by using this approach, or sell out for power by trying to elevate the ball. But not Simmons. Despite having the highest contact rate of any qualified shortstop last season, Simmons also hit fly balls more than almost any other shortstop, giving him the batted ball profile of sluggers like Jay Bruce or Giancarlo Stanton. This allowed Simmons to rack up 17 dingers with a HR/FB% of just 7.9% last year.

His career HR/FB percentage is 8.1%. As he is still in his age-24 season, let’s say he bulks up a bit and is able to muster out 9.0% of his fly balls for home runs in our hypothetical MVP season. With his batted ball profile and improved plate discipline, this gives us 21 HR for Simmons.

Base running

This was also a weird part of Simmons’ game last year, but in the opposite way than the power. In the minor leagues, he stole 54 bases in a little less than two full seasons of service time. He didn’t have an elite success rate (69%), but he clearly has some speed. In 2013, Simmons stole just six bases and was thrown out five times. That is terrible. He only ran 11 times, which certainly has something to do with his poor success rate, but he also wasn’t getting on base at a very good clip last year. With his improved on-base skills in this exercise, he would have more opportunities to run. Let’s say he improves his success rate a bit, too, and racks up about 15 SB.

Last year, Simmons’ baserunning was estimated to have cost the Braves about -1.6 runs. This includes not only steal attempts, but taking extra bases and being thrown out trying to take extra bases on balls in play. If we assume Simmons is a little more efficient at taking the extra base and steals 15 bags while only being thrown out six or seven times, it’s not hard to imagine Simmons’ baserunning score (BsR) going from -1.6 to +1.5. In other words, from very slightly below average to very slightly above average.

Results

Simmons AVG OBP ISO K% BB% BABIP HR/FB%
MVP Simmons .286 .331 .173 7.5% 6.5% .280 9.0%
Career Simmons .261 .307 .150 8.6% 6.1% .262 8.1%

That’s about all it would take. Really, not that drastic of a difference. It’s improvement in every category across the board, yes, but I don’t think there’s a single one of these that couldn’t happen or appears unrealistic for a really good baseball player in his second season in the MLB at age 24.

Convert his offensive numbers into run values and you get a wRAA of 15.2, a BsR of 1.5 (as we stated earlier) and on defense a UZR of 24.6 (his career average). Yes, this assumes that he repeats his ridiculous defensive numbers from last season which likely aren’t sustainable, but he is Andrelton Simmons, after all, and is kind of in unprecedented territory. If he’s done it once before, he can probably do it again. Adjust all of that for position and park and this gives us our magic number of 7.0 WAR.

With the defensive ability that Andrelton Simmons has showcased thus far in his career, he would just need to hit about .285 with a .330 OBP, 20 homers and 15 steals to be in serious consideration for the NL MVP. Consider, say, Andrew McCutchen and Buster Posey have slight off-years where they fail to accumulate at least 7 WAR and see both of their teams miss the playoffs. As long as the Braves make the postseason, Andrelton Simmons could bring home more hardware than just a Gold Glove in 2014.

Top 10 Picks in the ’90s: Irrational Trends

The annual MLB Draft is an exciting time for baseball. Dozens of high school and college players convince fans that they have the potential to be future All-Stars, and teams make selections to stock their farm systems with talent to win in the future. But obviously, not every pick can be savvy, and the majority of these selections turn out to be regrettable. The best a team can do is make rational choices to put themselves in a position to succeed. I decided to take a look at the draft classes in the 1990s to see if teams were making these rational decisions. I chose this decade because it’s the most recent one that is almost exclusively filled with players who have finished their careers.

In the 1990s, there was a fairly even distribution of pitchers and hitters selected with early draft picks. Since roster makeup isn’t skewed much in favor of either group, this seems to make sense. Teams are just as eager to get elite pitching as they are to acquire top-tier hitters. This year, 6 of baseball’s 12 highest paid players are pitchers, 6 are hitters.

It’s not surprising that during the ’90s, 45 of the 100 Top 10 picks were pitchers. In hindsight, this seems like it was probably the result of some pretty big mistakes. There are certainly some successful examples. In 1999, Josh Beckett was selected 2nd overall, Barry Zito was 9th, and Ben Sheets was picked 10th. The hope that a pick can turn into a future ace is enough to tempt any GM to take a pitcher. But that usually didn’t go well.

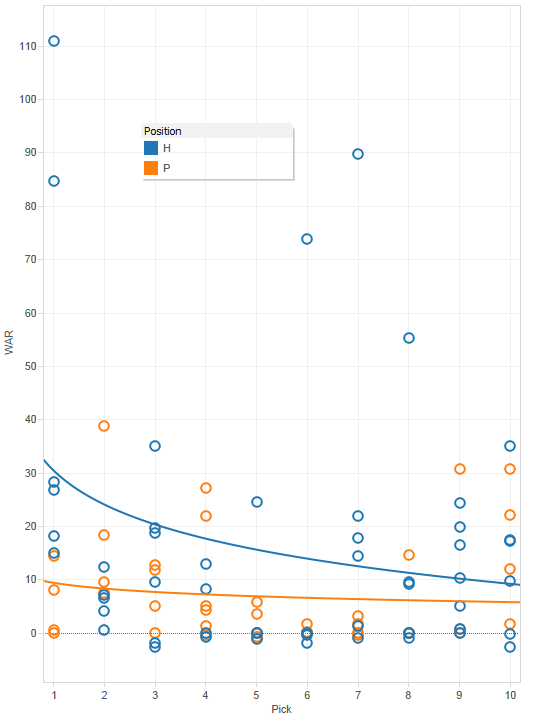
I gathered the career WAR for every draft pick, and here is the expected output for each Top 10 selection.

Draft Curve

This does not paint a pretty picture for teams who decided to go with pitchers. No matter where on the chart you look, picking a hitter gives a team a better expected outcome than a pitcher, and it’s not particularly close. The average hitter taken in the Top 10 achieved a career WAR of 16.0. The average pitcher reached 7.0. That’s a big gap, and the disparity was made on a large scale.

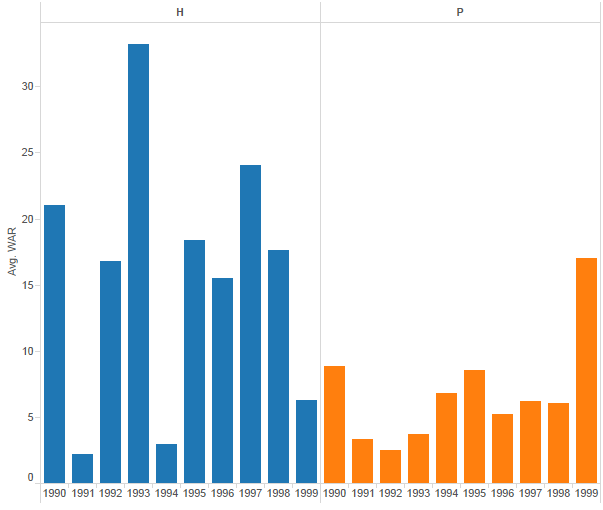
Here’s a year-by-year average for draft picks at each position:

Draft Bars

1999 was an excellent year for pitchers, as I already mentioned. In fact, it was the best year for pitchers. But if you add it to the list of years for hitters, it would rank 6th out of 11.

Clearly, picking hitters seems like the preferable strategy of the ’90s. But teams opted not to do so roughly half the time.

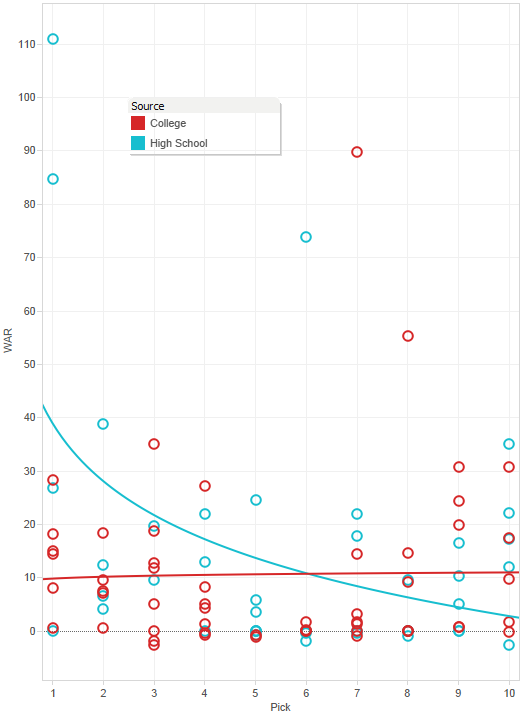
Similar to what position someone plays, there’s another core attribute about a player outside of his scouting reports: whether or not he went to college. College players will be more developed and will have less room to grow. High school picks are considered riskier with higher upside. The data seem to support that. Unlike the difference between hitters and pitchers, the age of a draft pick had a more nuanced effect.

Draft Source

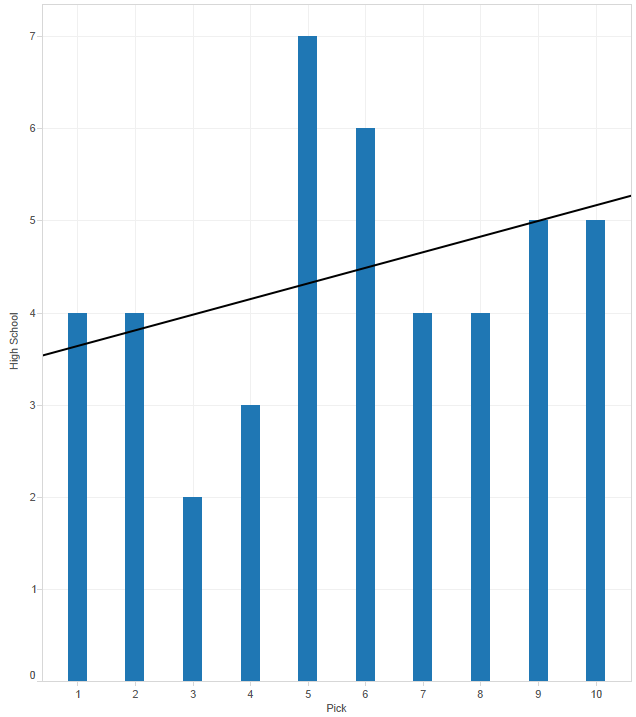
High school players taken at the top (of the top) of the first round are more promising than college players. This is because elite players like A-Rod, Chipper Jones, and Josh Hamilton don’t often slip under the radar when they’re 17 or 18. But what’s interesting is when you make your way to the bottom of the Top 10, college players have a better expected career WAR. I don’t want to make too many guesses why, because honestly I’m not sure. But it’s a very noticeable trend. No matter the reason, it’s clear that teams should be more eager to draft high schoolers with picks 1-5, and college players with picks 6-10. But look at the frequency of high school draft picks by selection.

Draft Source Pick

Teams do the exact opposite of what they should. The earlier in the draft, the more likely a college player is to be selected. 32.5% of Top-4 picks are drafted out of high school, while 68.3% of picks 5-10 are.

To a strong extent, this analysis is not fair to these teams. I’m looking at these numbers in 2014, and it’s easy to go back in time and point out what mistakes teams made in drafts. But these aren’t scouting report mistakes, isolated misjudgments, or bad luck decisions. Teams in the 1990s made consistent poor strategic decisions on a large scale in the draft that were often indefensible.


Sabathia’s Decline = Lincecum’s Decline? Specific Patterns for Velocity Loss?

CC Sabathia‘s recent decline is looking more and more like Tim Lincecum’s also-much-scrutinized decline.  To make the point, here are some key year-by-year stats for each.

Lincecum
ERA FIP FBv K/9 BB/9 BABIP LD% LOB% HR/FB%
2009 2.48 2.34 92.4 10.42 2.72 0.282 19.2 75.9 5.5
2010 3.43 3.15 91.3 9.79 3.22 0.310 19.5 76.5 9.9
2011 2.74 3.17 92.3 9.12 3.57 0.281 19.1 78.5 8.0
2012 5.18 4.18 90.4 9.19 4.35 0.309 23.8 67.8 14.6
2013 4.37 3.74 90.2 8.79 3.46 0.300 23.1 69.4 12.1
2014* 9.90 6.24 89.9 10.80 0.90 0.393 37.5 48.1 40.0
Sabathia
ERA FIP FBv K/9 BB/9 BABIP LD% LOB% HR/FB%
2009 3.37 3.39 94.2 7.71 2.62 0.277 19.8 71.4 7.4
2010 3.18 3.54 93.5 7.46 2.80 0.281 15.1 75.6 8.6
2011 3.00 2.88 93.8 8.72 2.31 0.318 23.1 77.0 8.4
2012 3.38 3.33 92.3 8.87 1.98 0.288 21.1 71.6 12.5
2013 4.78 4.10 91.1 7.46 2.77 0.308 22.3 67.4 13.0
2014* 6.63 4.82 89.1 9.95 1.42 0.308 21.1 58.8 38.5
* – as of 4/14/14

The velocity loss is perhaps the most publicized common aspect.  Yet, while acknowledging that year 2 of Sabathia’s decline is only about 10% (19 innings) in, it’s shaping up as though there may be many other commonalities:

  • ERA above FIP when it wasn’t the case before
  • Sudden (and permanent?) spikes in HR/FB%
  • An apparent loss in ability to strand runners
  • (BABIP might also be trending up for each, but this is harder to tell, due to the regular noisiness of year-to-year BABIP.  Lincecum also saw his LD% spike, which might not be true for Sabathia.)

Having also been thinking about Nathan Eovaldi lately — who has both elite fastball velocity and an apparent ability to suppress HR/FB (7.0% in 279.2 IP) — I couldn’t help but wonder if these things are systematically related.

I remember there was some attention paid to these things when SIERA was being introduced.  But it turns out most of the attention there was on strikeouts, rather than velocity.  Obviously velocity and strikeouts are positively related.  But (1) Lincecum and Sabathia are actually still pretty good/decent at strikeouts, and this hasn’t prevented their recent struggles; (2) Eovaldi has only elite velocity, and pretty pedestrian strikeouts.  So the real question is: Does velocity itself matter, in addition to strikeouts?

(In the subsequent analysis, I’ll be looking primarily at effects on HR/FB%, LOB%, and ERA-FIP, since those seem to be problems plaguing both of the high-profile cases that prompted this line of thinking.  But there’s otherwise no reason to think those are the only intermediate outcomes where velocity may matter directly.

Also, it turns out that great velocity isn’t required for HR/FB suppression, as a look at the leaderboard in recent years includes some notable non-flamethrowers like Stults, Weaver, and Fister.  Obviously the ballpark matters a lot, too.  But there are also hard throwers near the top, and overall I remained intrigued enough to keep digging.)

Realistically, if there is something there, Sabathia and Lincecum are probably on the more extreme end of the spectrum.  Probably there have been other guys who lost similar velocity but that we didn’t hear as much about because they were better able to adapt or otherwise did not see their overall results decline so dramatically.

What do the results indicate?  By and large, it does appear that velocity matters directly, in addition to strikeouts.  (Regression results below)

HR/FB% LOB% ERA-FIP
OLS FE FD OLS FE FD OLS FE FD
K/9 -.122** .533*** .189 1.118*** .445** .509* .037*** .132*** .151
FBv -.124*** -.841*** -.656*** .140* .953*** 1.155*** -.022** -.155*** -.155***
N 1677 1677 1085 1677 1677 1085 1677 1677 1085
R2 0.015 0.511 0.009 0.125 0.575 0.0265 0.008 0.53 0.029

* = significant at 10%; ** = significant at 5%; *** = significant at 1%

I use 3 different estimation techniques for each outcome:

  • Plain-old OLS
  • Fixed effects (“FE”): estimates results within player, essentially comparing each pitcher’s own years of higher velocity/strikeouts against his years of lower velocity/strikeouts
  • First difference (“FD”): the outcome is now the one-year change in HR/FB% (etc.) for Pitcher A, while the explanatory variables are the one-year change in K/9 and FBv for Pitcher A

Of these, methods 2 and 3 are probably more convincing, since they give results for the same player, where anything else that’s distinct to the player (but invariant over time) gets washed out.  OLS doesn’t do this, and instead mostly compares across players, who may have many differences besides strikeouts and velocity.  In an exaggerated illustration, if our full sample consisted only of Tim Hudson and Felix Doubront, the fact that Hudson is altogether a better pitcher, but sort of a “pitch-to-contact soft tosser,” can make it look like strikeouts/velocity are bad, using OLS, even if having more strikeouts/more velocity is actually good for either player.

Some technical notes:

  • Sample includes player-seasons between 2010 and 2013 with at least 30 innings pitched
  • Standard errors (not displayed) are clustered by player
  • Don’t look too much into the fact that “FE” always gives the highest R2.  Most of this is from all the “specific player indicators” that are now present, rather than the “within-player” aspect, which is the actual point of using FE
  • Starters and relievers are both included.  Part of me prefers to look at just starters, but this allows for much more observations and statistical power.  I’m also not controlling for starter/reliever status, so you’d need to believe that that only matters through its effects on strikeouts and velocity.

You can maybe argue that there are other explanatory variables that should have been included, or perhaps that one needs to be more judicious about the sample to consider.   (I must admit that I threw this together fairly quickly.)  But even if the current analysis is somewhat imperfect, it appears at least plausible that velocity matters directly (for various outcomes), in addition to the rate of strikeouts.

It’s a little too bad, because coming into this season I’d thought there was a decent chance of a Sabathia bounceback, given his partial velocity rebound as 2013 went along.  But that seems to have been only temporary.  While he still may wind up bouncing back when all is said and done, I’m definitely less optimistic than I was a week ago.  Will CC be this year’s version of 2013 Lincecum, who might even tease by FIP/xFIP but continue to underwhelm?


Baseball America Top 10 Prospects Retrospective: Part 1

Part of being a Cubs fan these days is obsessing over prospects. When your product on the field is substandard you have to find something positive to look at and the Cubs farm system is a definite positive. With 2 prospects ranked in Baseball America’s Top 10 (Javier Baez and Kris Bryant) and 7 prospects in their Top 100 there is a lot to be excited about. The primary question that I have then is how successful has Baseball America been at predicting performance? I am going to analyze this over a series of posts that will examine the statistical outcomes of these top prospects while also giving some historical insight on why these players succeeded or failed. So to start off we will go through every Top 10 prospect list that Baseball America has created. Let’s begin with  the 1990 edition which is the first one listed on their website.


1990

Name

Position

Team

Career WAR

1

Steve Avery

LHP

ATL

20.3

2

Ben McDonald

RHP

BAL

20.7

3

John Olerud

1B/LHP

TOR

57.7

4

Juan Gonzalez

OF

TEX

36

5

Sandy Alomar

C

CLE

13.6

6

Kiki Jones

RHP

LAD

N/A

7

Todd Zeile

C

STL

22.4

8

Eric Anthony

OF

HOU

0.3

9

Greg Vaughn

OF

MIL

25.4

10

Jose Offerman

SS

LAD

13.7

  What are your initial reactions to this list? I was surprised there was only one player that didn’t make the majors on it. There are also a number of notable players that despite only being 22 years old I still remember playing. I think I had a lot of these guys’ baseball cards growing up. Now that you have had a chance to contemplate that list, let’s dig a little bit deeper into each player.

 Steve Avery-LHP- BRAVES

 Avery was drafted with the third overall pick by the Braves in the 1988 draft behind pitcher Andy Benes and shortstop Mark Lewis. He was a 6’4 lefty that moved through the Braves farm system rather quickly. In his first full professional season (1989) he made it up to AA putting up stellar numbers. Across both A and AA levels he posted a 2.11 ERA in 26 starts with an 8.7 K/9 and 2.8 BB/9 rate. So as a high draft pick that rocketed through the minors with great success it made sense that he ranked as the number one prospect in baseball. After 13 starts in AAA in 1990 he got the call to the Major Leagues. He made his debut against the Cincinnati Reds at Riverfront Stadium and was not very good, giving up 8 ER in just 2.1 IP. His first season in the Big Leagues did not go well as he posted a 5.64 ERA in 99 IP. There were some underlying numbers that indicated some bad luck though and in the next season he proved that he was much better than his debut indicated. Avery went on to become a very good pitcher over the next 3 years.

Year

IP

ERA

FIP

K/9

BB/9

WAR

1991

210.1

3.38

3.82

5.86

2.78

2.7

1992

233.2

3.20

3.37

4.97

2.73

3.6

1993

223.1

2.94

3.26

5.04

1.73

5.2

As he posted these increasingly good season at such a young age (21-23) and on some pretty good Braves teams, he looked to be one of the next great pitchers. Sadly this would be the peak of Avery’s career. At the end of the 1993 season Avery sustained an injury, straining a muscle below the armpit of his pitching arm. While the injury did not require surgery he never seemed to be the same pitcher and some have speculated that it forced him to change his mechanics. Many people have blamed the heavy workload that he had early in his career and the high pressure of a consistently playoff bound Atlanta Braves team. His next three seasons on the Braves while productive where a significant step down for Avery.

Year

IP

ERA

FIP

K/9

BB/9

WAR

1994

151.2

4.04

3.97

7.24

3.26

2.3

1995

173.1

4.67

4.13

7.32

2.7

2.4

1996

131

4.47

3.86

5.91

2.75

2.3

 Following the 1996 season he signed as a Free Agent with the Boston Red Sox. At this point his career was essentially over as he never would pitch more than 130 innings in a season or have an ERA below 5.00 in season again. He hung around the Red Sox for two years and one more season with the Cincinnati Reds in 1999. He was out of the big leagues for several years until he made a brief comeback in 2003 with the Tigers. So was Steve Avery deserving of being ranked as the number one prospect in baseball? Well from a talent perspective certainly, Avery is a perfect example of the volatility of pitching in baseball. That being said he was extremely effective early on in his career for the Braves so I would still consider him a success.

 Ben McDonald- RHP- ORIOLES

 McDonald was drafted first overall in the 1989 draft out of the LSU baseball program. He was a star at both basketball and baseball at LSU. He helped lead the 1988 Mens Olympic Baseball Team to a Gold Medal and also helped lead his LSU team to the College World Series twice. The 6’7 right-hander was one of the greatest College Pitching prospects of all time and had quite a resume coming into professional baseball. The same year he was drafted he made his major league debut against the Cleveland Indians pitching 2.2 innings in relief of Curt Schilling and allowing 1 ER. He would join the Orioles starting rotation in 1990 and performed quite well, finishing 8th in Rookie of the Year voting. He was very mediocre the next 2 seasons before putting up a 4.3 WAR season in 1993.

Year

IP

ERA

FIP

K/9

BB/9

WAR

1990

118.2

2.42

3.58

4.93

2.65

1.6

1991

126.1

4.84

4.20

6.06

3.06

1.3

1992

227

4.24

4.32

6.26

2.93

1.9

1993

220.1

3.39

3.68

6.98

3.51

4.3

It seems like he was rushed to the majors rather quickly and had a bit of an adjustment period. Sure the numbers are not as dazzling as the extreme hype that was on this kid but by 1993 he was becoming an effective pitcher. He would go on to pitch another 2 seasons with the Orioles before signing with the Milwaukee Brewers as a Free Agent.

Year

IP

ERA

FIP

K/9

BB/9

WAR

1994

157.1

4.06

4.16

5.38

3.09

3.1

1995

80

4.16

4.72

6.98

4.28

0.9

In 1995 McDonald had some tendinitis issues in his shoulder. He went on the DL multiple times that season which may have been a warning sign for things to come as his career would soon be derailed by shoulder injuries. He pitched 2 seasons with Milwaukee and then his career abruptly ended as he had a surgery to repair his rotator cuff which failed. He was traded to Cleveland in a deal that brought Jeff Juden and Marquis Grissom to Milwaukee but ended up being returned to the Brewers due to the unsuccessful surgery. His final two seasons looked like this.

Year

IP

ERA

FIP

K/9

BB/9

WAR

1996

221.1

3.90

4.31

5.94

2.72

4.6

1997

133

4.06

3.65

7.44

2.44

3.1

  Ben McDonald is yet another example of the volatility of pitching prospects. A lot of people have likened Stephen Strasburg to McDonald in terms of the hype and the potential injury risks. It is a valid concern and teams should try to learn from players like McDonald in order to figure out how to limit the risks of injury. That being said there is certain inevitability to pitchers getting injured that should be factored into expectations for top prospects.  

John Olerud- 1B- BLUE JAYS

 Olerud was drafted in the 3rd Round of the 1989 Draft out of Washington State University. He was a standout player at WSU as he was effective both as a hitter and pitcher. In 1988 he was a consensus All-American as both a 1B and Pitcher and was named Baseball America College Player of the Year. He was known for wearing his batting helmet while playing 1B. This was a precaution after having an operation to remove a brain hemorrhage (it was discovered after he collapsed during a workout). He was one of only a few players to jump immediately to the Big Leagues and skip the Minors. He quickly established himself as a quality Major League hitter and posted an 8 WAR campaign in just his 4th season.

Year

Slash Line

BB%

K%

HR

ISO

wRC+

WAR

1990

.265/.364/.430

13.5

17.8

14

.165

122

1.4

1991

.256/353/.438

12.6

15.5

17

.183

115

2.5

1992

.284/.375/.450

13.0

11.4

16

.166

127

3.1

1993

.363/.473/.599

16.8

9.6

24

.236

179

8.1

He played with the Blue Jays another 3 seasons and put up solid but unspectacular numbers. He would then be traded to the Mets in 1996 for right-hander Robert Person. He was very good during his 3 seasons with the Mets. He maintained a batting average over .290 and OBP over .400 and was worth no less than 4 WAR in any season over that stretch. This included another spectacular 8 WAR season in 1998.

Year

Slash Line

BB%

K%

HR

ISO

wRC+

WAR

1998

.354/.447/.551

14.4

11.0

22

.197

167

8.1

During the offseason before the 2000 season Olerud signed as a Free Agent with the Seattle Mariners. He would become a part of one of the best regular season teams in baseball history as the 2001 Mariners went on to win 116 games. He was a very effective player the first 3 seasons of his deal with the Mariners and had another decent season in his fourth year. He was released by the Mariners in 2004 and hung around on with the Yankees and finally the Red Sox before his career was over. His final career numbers are pretty impressive.

Year

Slash Line

BB%

K%

HR

ISO

wRC+

WAR

Career

.295/.398/.465

14.1

11.2

255

.170

130

57.7

 Olerud was a sweet swinging left handed hitter with a great eye at the plate (look at that walk to strike out rate). He was also considered a pretty good defensive first baseman and he collected 3 Gold Gloves for his work (if that really means anything). While he may not have been a Hall of Famer he was definitely a great player. He is an example of an elite collegiate hitter that makes a tremendous impact in the Major Leagues. Also a random bit of information, according to Baseball Reference he is the cousin of Dale Sveum.    


 Juan Gonzalez- OF- RANGERS

 Gonzalez was signed as an amateur free agent out of the Puerto Rico in 1986 as a 16 year old.  As one would expect it took him a few years in the minors to develop. He progressively moved up a level each year and by 1989 he was hitting very well and even got a September call-up. The 1990 season was a success for him as well as he managed to hit 29 HR HRHR at the AAA level and got another late season call-up. The 1991 season is where he firmly established himself as a big leaguer. He would continue to progress until he peaked in 1993.

Year

Slash Line

BB%

K%

HR

ISO

wRC+

WAR

1991

.264/.321/.479

7.1

19.8

27

.215

118

1.9

1992

.260/.304/.529

5.5

22.6

43

.269

131

3.0

1993

.310/.368/.632

6.3

16.9

46

.323

164

5.7

He quickly established himself as one of the premier power hitters in the game as he led the league in 92’ and 93’ in HR. This garnered him a significant amount of attention and he was elected into the All-Star game and finished 4th in MVP voting in 1993. He would go on to play with the Rangers through the 1999 season before leaving for the Tigers in 2000. Throughout that time he put up three more 40 HR seasons while also knocking in a lot of runs (157 RBI in 98’). He also garnered even more accolades as he brought home MVP Awards in 96’ and 98’. Just take a look at his peak seasons (age 26 to 29).

Year

Slash Line

BB%

K%

HR

ISO

wRC+

WAR

1996

.314/.368/.643

7.6

13.9

47

.329

141

3.5

1997

.296/.335/.589

5.7

18.5

42

.293

127

2.2

1998

.318/.366/.630

6.9

18.8

45

.312

145

4.9

1999

.326/.378/.601

8.1

16.7

39

.276

139

3.6

His bat was tremendously valuable during that stretch for the Rangers which helped propel them to the playoffs. His value takes a bit of hit due to his lack of defense but even as a bat only player he was pretty good. He is ranks very highly on the Rangers career offensive stats. Here are some of his ranks on the all-time Rangers leaderboard according to Baseball-Reference.

Category

His Numbers

Rank

Slugging %

.565

2nd

OPS

.907

3rd

Runs

878

3rd

Hits

1595

4th

Doubles

320

4th

HR

372

1st

RBI

1180

1st

So the team that signed him as a 16 year old kid out of Puerto Rico benefited greatly from their investment. I think that’s one very important point to think about when looking at these rankings. How did that player do with the team that developed them and that they were with at the time of their ranking by Baseball America? So far when looking through this list the players did have most of their success with the team they were on at the time of the ranking. While Gonzalez eventually left the Rangers in 2000 he was only gone for two years (with the Tigers and Indians) and accumulated 6 WAR. He returned to the Rangers for another 2 seasons accumulating another 2.6 WAR before briefly playing for the Royals and Indians. He played a season of Independent Minor League Baseball in 2006 and that was it. His overall career line looked like this.

Year

Slash Line

BB%

K%

HR

ISO

wRC+

WAR

Career

.295/.343/.561

6.4

17.8

434

.265

129

36.0

 Juan Gonzalez is still considered one of the best players to come out of Puerto Rico. The numbers may not seem quite as impressive as he played in the steroid era and he may have a bit of a cloud looming over him because of that. Still I think anytime that your top prospect goes on to become your all-time leader in HR that is a success.

Sandy Alomar-C- INDIANS

 Alomar came from a baseball family. His father was a moderately successful middle infielder in the 60’s and 70’s and his brother had a very successful career as a 2B that got him inducted into the Hall of Fame. Sandy Alomar Jr. was signed as an Amateur Free Agent out of Puerto Rico in 1983. He played his first professional season in 1984 as an 18 year old kid in the short season Northwest League. He slowly worked his way up through the minors and made his debut 1988 with 1 PA. In 1989 he put up some terrific numbers at AAA and got another brief call up to the majors. He really didn’t have much of an opportunity in San Diego as he was stuck behind Benito Santiago, so during the 1989 off-season he was involved in a big trade that sent him as well as Carlos Baerga and Chris James to the Indians for Joe Carter. The following season Alomar solidified himself at the major league level and would stay there for 18 seasons. He was quite effective in his first season which helped him bring home the Rookie of the Year Award and a Gold Glove. He was also elected to the All-Star team his first 3 seasons in the majors.

Year

Slash Line

BB%

K%

HR

ISO

wRC+

WAR

1990

.290/.326/.418

5.2

9.5

9

.128

105

2.4

1991

.217/.264/.266

4.0

12.1

0

.049

47

-0.6

1992

.251/.293/.324

4.1

10.0

2

.074

72

1.3

Well I guess that is another example of why looking at All-Star Game appearances as a measure of success is stupid. While he was solid defensively in those first 3 seasons he only had one above average offensive campaign. That being said much of the lack of production was a result of a rash of injuries. In 1991 he struggled with various hip and shoulder problems and in 1992 he tore cartilage in his knee. In 1993 he suffered a back injury that eventually led to surgery. Then of course the strike prevented everyone from playing. In 1996 he finally got healthy and for the next few seasons was able to be moderately productive, including an exceptional season in 1997.

Year

Slash Line

BB%

K%

HR

ISO

wRC+

WAR

1996

.263/.299/.397

4.3

9.5

11

.134

73

1.0

1997

.324/.354/.545

4.0

10.0

21

.222

131

4.2

1998

.235/.270/.352

4.1

10.3

6

.117

56

0.0

He made the All-Star team all three of these seasons as well. He definitely seemed to have a reputation as a good catcher and he certainly had the ability to be. The injuries he had struggled through prior to these three seasons would return and he would never again make more than 400 Plate Appearances in a season. He hung around with the Indians through the 2000 season before heading to the White Sox as a Free Agent. He would spend several years with the White Sox while also bouncing around to Colorado, Texas, Los Angeles (NL) and New York (NL). When you look back at Sandy Alomar Jr.’s career it can be a bit frustrating. He was obviously talented and had good bloodlines but suffered through a ridiculous amount of injuries. As a kid I always had a very positive opinion of him but looking at the numbers I am a bit disappointed.

Year

Slash Line

BB%

K%

HR

ISO

wRC+

WAR

Career

.273/.309/.406

4.4

10.3

112

.134

84

13.6

 Alomar appears to be the position player equivalent of Ben McDonald on this list. He had tremendous upside and did put together a few good seasons but his overall career was hampered by injuries. It makes sense as Catcher is arguably the most physically demanding position outside of being a pitcher. When thinking about him in the context of this list I would not consider him a bust but simply as a disappointment.

Kiki Jones- RHP- DODGERS

 Jones was drafted 15th overall in the 1989 draft out of Hillsborough High School. He had a very impressive professional debut in 1989 in Rookie Ball posting a 1.58 ERA in 62.2 IP while striking out 63 and walking 21. He pitched decently in 1990 but only appeared in 9 games which may have been an indication of injuries. 1991 was similar as he reached A+ but only appeared in 10 games. Sadly Kiki would never make it above AA and flamed out in 1993. He did pitch in the minors again in 1998-1999 and again in 2001 but never getting above A+. This is the first player who was a complete bust on the list.


Todd Zeile- C- CARDINALS

 Zeile was drafted in the 2nd Round of the 1986 draft out of UCLA. He hit well at every level of the minors and after 3 seasons, made his debut in 1989. When he was called up he was the Cardinals most anticipated prospect of the year. He had played Catcher both  at the collegiate and minor league level but was soon moved to third base to make room for Tom Pagnozzi. In 1990 he played a full season in the majors and would go on to play 5 solid seasons before being traded to the Cubs in 1995 for Francisco Morales, Paul Torres and Mike Morgan.

Year

Slash Line

BB%

K%

HR

ISO

wRC+

WAR

1990

.244/.333/.398

11.8

13.5

15

.154

102

2.5

1991

.280/.353/.412

9.7

14.7

11

.133

118

2.6

1992

.257/.352/.364

13.2

13.6

7

.107

108

1.9

1993

.277/.352/.433

10.8

11.7

17

.156

112

1.6

1994

.267/.348/.470

10.9

11.7

19

.202

113

2.0

What is interesting is that during Zeile’s time with the Cardinals they were in the midst of an 8 year stretch without making the playoffs. So he played in a rather forgettable era of Cardinals baseball. He was moderately productive during this stretch but certainly not what you would hope to get out of a Top 10 Prospect. After those initial years with the Cardinals he didn’t stick with one team for very long. He played the rest of the 1995 season with the Cubs and was pretty bad (-1.3 WAR) and then became a Free Agent. He signed with the Phillies in the off-season but was traded in August of 1996 to the Orioles. He was fairly productive that season posting a career high in HR (25). The next season he continued to improve and began a stretch of 4 seasons in which he was worth 2 or more WAR while playing for 4 different teams.

Year

Slash Line

BB%

K%

HR

ISO

wRC+

WAR

1997

.268/.348/.436

12.6

16.7

31

.191

122

2.5

1998

.271/.350/.437

10.6

13.8

19

.166

108

2.3

1999

.293/.354/.488

8.5

14.3

24

.196

109

2.5

2000

.268/.356/.467

11.9

13.6

22

.199

111

2.7

His ages 31 to 34 seasons seem to be his best and most consistent. While he may not have been a star level player, he was a useful major league hitter who posted solid walk rates and above average power. He became the epitome of a journey man as he played for 11 teams over the course of his career and has the distinction of hitting a HR with each one. That is probably his single greatest claim to fame as he is the only MLB player in history to have hit a HR with over 10 teams. He retired at the age of 38 in 2004 after playing his final season with the New York Mets. His final career line looked like this.

Year

Slash Line

BB%

K%

HR

ISO

wRC+

WAR

Career

.265/.346/.423

10.9

14.8

253

.159

104

22.4

  Are these the kind of numbers you would expect from a Top 10 Prospect? Probably not, but overall he still put up solid offensive numbers and managed to hang around the league for a while. After retiring Zeile began working in the Film Industry. He has his own film production company called Green Diamond Entertainment and has appeared in a few movies and TV shows. He is also married to former Olympic Gymnast Julianne McNamara, so he has done pretty well for himself.


Eric Anthony- OF- ASTROS-

 How Anthony got drafted is a truly fascinating story. According to a Sports Illustrated article from 1999, Anthony was a High School dropout working on an assembly line in Houston. Apparently he talked his way into a tryout with the Astros in 1986 and showed off amazing power. His tryout led to the Astros drafting him in the 34th round of the 1986 draft. He quickly showed off that excellent power in the minor leagues. After a 1989 season in which he hit .292/.353/.550 with 31 HR between AA and AAA he landed himself on the Baseball America Top 10 Prospects List. He was briefly called up in 1989 and would go back and forth between the minors and major leagues until 1992. He struggled to keep strikeouts in check and make contact. He did manage to play almost 2 full seasons for the Astros in 1992 and 1993.

Year

Slash Line

BB%

K%

HR

ISO

wRC+

WAR

1992

.239/.298/.407

7.9

20.3

19

.168

102

1.0

1993

.249/.319/.397

9.1

16.3

15

.148

97

2.1

During the off-season before the 1994 season he was traded to the Seattle Mariners for Mike Felder and Mike Hampton. That trade worked out pretty well for the Astros as Mike Hampton turned out to be a pretty good pitcher for them and Anthony never really panned out. He would never put up a season over 1 WAR again and only lasted another 4 seasons in the major leagues. After the 1997 season he went to Japan to play for the Yakult Swallows for a little bit before returning to the United States. He hung around in the minors until the 2001 season but never again got called up to the majors.

Year

Slash Line

BB%

K%

HR

ISO

wRC+

WAR

Career

.231/.305/.397

9.7

21.9

78

.166

90

0.3

 In terms of being ranked a Top 10 prospect, Anthony should be considered a bust. He only managed 2 full seasons and struggled to make enough contact for his power to be useful. That being said if you consider where he could be had he not gotten that tryout then it’s hard not to consider him a success. He went from working on an assembly line to be one of the top prospects in the game. Anthony is definitely a classic feel good story that deserves to have a movie made about it.

Greg Vaughn- OF- BREWERS-

 Vaughn was drafted 4th overall in the 1986 draft out of the University of Miami. He had some baseball bloodlines as he was cousin of both Jerry Royster (Middle Infielder in the 70’s and 80’s) and Mo Vaughn. He raked at every level of the minors and by the 1989 season he was hitting well at AAA and got a call up to the majors. He immediately hit for power and put together a 30 HR season in 1993. Here is a look at his numbers while with the Brewers.

Year

Slash Line

BB%

K%

HR

ISO

wRC+

WAR

1990

.220/.280/.432

7.7

21.2

17

.212

96

0.1

1991

.244/.319/.456

10.1

20.4

27

.212

114

2.4

1992

.228/.313/.409

10.5

21.5

23

.182

104

1.6

1993

.267/.369/.482

13.3

17.7

30

.214

124

5.0

1994

.254/.345/.478

12.1

22.0

19

.224

108

1.5

1995

.224/.317/.408

12.2

19.7

17

.184

84

-0.5

1996

.280/.378/.571

13.1

22.4

31

.291

130

2.3

Vaughn essentially was your prototypical power hitting corner outfielder who didn’t play defensive particularly well. His walk rates and power numbers where pretty good but he definitely had issues making contact. His power hitting prowess did garner enough attention to get him elected to two All-Star Games during his time with the Brewers. During the 1996 season he was traded to the San Diego Padres for Bryce Florie, Marc Newfield and Ron Villone. He finished the 1996 season setting (then) career highs in HR (41) and RBI (117). Vaughn struggled in the 1997 season but broke out big time in the 1998 season.

Year

Slash Line

BB%

K%

HR

ISO

wRC+

WAR

1998

.272/.363/.597

12.0

18.3

50

.325

151

5.8

His 1998 season secured him another All-Star appearance and also helped him bring home a Silver Slugger Award. Vaughn also finished 4th in MVP voting behind Sosa, McGwire and Moises Alou. His 50 HR’s were overshadowed by record setting seasons from Sosa and McGwire but he was still very impressive. Interestingly enough the Padres decided to trade him in the offseason after this impressive season to the Cincinnati Reds. He was sent with Mark Sweeney for Josh Harris, Damian Jackson and Reggie Sanders. There was initially some tension with Vaughn’s arrival to Cincinnati as the Reds had a no facial hair policy at the time and he had a goatee. According to a Cincinnati Enquirer article from Feb. 3rd 1999 he publicly pleaded for ownership to make an exception to this policy stating that “My two kids have never seen me without it. You guys (the media) gotta lobby for that (a relaxation of the Reds’ no-facial hair policy).” Owner Marge Schott eventually relented and Vaughn went on to post another strong power hitting season (45 HR). The Reds won 96 games that season but just missed making the postseason.

Year

Slash Line

BB%

K%

HR

ISO

wRC+

WAR

1999

.245/.347/.535

13.2

21.3

45

.289

116

3.5

He finished 4th in the MVP voting yet again behind Chipper Jones, Jeff Bagwell and Matt Williams. He only spent one season with the Reds and signed with Tampa Bay as a Free Agent. He put together two productive seasons for Tampa Bay before falling off the cliff and out of baseball after 2003. Like any power hitter of this era the cloud of steroids hangs over his numbers. There is no clear evidence that he used them as he does not appear on the Mitchell Report or any other report about steroids. Still many see the sudden increase in power in his 30’s and become suspicious. We likely will never know but what we do know is that he did put up some impressive numbers. Take a look at his career numbers.

Year

Slash Line

BB%

K%

HR

ISO

wRC+

WAR

Career

.242/.337/.470

12.2

21.4

355

.229

111

25.4

The combination of playing in the steroid era and playing in very few postseasons probably leads most people to forget about this guy. If you simply look at his numbers though, you realize as far as power hitters go he was pretty good. He had an above average BB% and ISO and stole some bases as well (121 career SB). While not a HOF talent he put together a pretty good career.


Jose Offerman- SS- DODGERS-

 Offerman was signed as an Amateur Free Agent out of the Dominican Republic in 1986. He tore up the minor leagues starting in 1988 and had made it up to the AA level by 1989. He would play a full season at AAA in 1990 before getting a brief call-up that year. Prior to the 1991 season Baseball America would once again rank him in the Top 10 and he would actually move up to the #4 Ranked Prospect. He split time between AAA and MLB in 1991 before establishing himself as the Dodgers starting Shortstop in 1992. He would receive significant playing time with the Dodgers from 1992-1995 before being traded to the Royals for LHP Billy Brewer.

Year

Slash Line

BB%

K%

HR

ISO

wRC+

WAR

1992

.260/.331/.333

9.5

16.4

1

.073

94

0.6

1993

.269/.346/.331

10.2

10.8

1

.061

89

1.4

1994

.210/.314/.288

13.1

13.1

1

.078

67

-1.3

1995

.287/.389/.375

13.5

15.2

4

.089

118

1.8

His final season with the Dodgers saw him get elected to his first All-Star game. He was considered pretty poor defensively at Shortstop which was part of the reason he was traded to the Royals in 1995. When you look at Offerman’s numbers he appears to be your typical no power, speedy middle infielder. He did have one season with the Dodgers in which he stole 30 bases although his success rate was only 69.7 percent. In Offerman’s first season with the Royals he moved around the diamond quite a bit, he saw time at SS, 2B and 1B. The following two seasons he settled in at 2B as he started 100 games there in 97’ and 152 in 98’. In 1998 Offerman would put together the finest season of his career.

Year

Slash Line

BB%

K%

HR

SB

ISO

wRC+

WAR

1998

.315/.403/.438

12.6

13.5

7

45

.124

121

4.6

His peak seasons where pretty good as he took lots of walks, hit for a high average and stole a lot of bases. From 1995-1999 Offerman posted his best offensive seasons at ages 26-30. After his strong 1998 season Offerman signed with the Boston Red Sox as a Free Agent. He would post another strong season in 1999 but would see his numbers start to decline after that. He would bounce around with a number of teams (Mariners, Expos, Twins, Phillies and Mets) until 2005. He would hang around the minor leagues until 2009 at the age of 40. His final career numbers look like this. 

Year

Slash Line

BB%

K%

HR

SB

ISO

wRC+

WAR

Career

.273/.360/.373

11.7

13.9

57

172

.100

97

13.7

  Overall Offerman was an above average middle infielder. He certainly was not someone to build around but more of a complementary piece. In my opinion for a Top 10 Prospect to be considered a success they need to become a player you build around. So from that perspective I consider Offerman a failure but he was still a pretty good ballplayer.

 Final Thoughts-

 Looking at these players in depth can be fascinating and filled with compelling stories. I can’t make a judgment on the effectiveness of Baseball America’s rankings yet as I have only looked at one year but I can give my initial reactions to this information. So far this has only further reinforced my beliefs about prospects. That would consist of one thing.

 1.      Pitching is extremely volatile so keep your expectations for elite pitching prospects in check.

 That is why I really respect the way the Cubs Front office has gone about building the farm system. Spending that first draft pick on an elite position prospect and attacking pitching in volume. I am sure I will develop more opinions as I continue analyzing these top lists but that’s all I can think of right now. I hope you enjoyed this expedition into the careers of Top Prospects and I look forward to posting the next edition of this series later in the week.