Hardball Retrospective – The “Original” 1999 Texas Rangers

In “Hardball Retrospective: Evaluating Scouting and Development Outcomes for the Modern-Era Franchises”, I placed every ballplayer in the modern era (from 1901-present) on their original team. Therefore, Fergie Jenkins is listed on the Phillies roster for the duration of his career while the Pirates claim Barry Bonds and the Rays declare Carl Crawford. I calculated revised standings for every season based entirely on the performance of each team’s “original” players. I discuss every team’s “original” players and seasons at length along with organizational performance with respect to the Amateur Draft (or First-Year Player Draft), amateur free agent signings and other methods of player acquisition.  Season standings, WAR and Win Shares totals for the “original” teams are compared against the “actual” team results to assess each franchise’s scouting, development and general management skills.

Expanding on my research for the book, the following series of articles will reveal the finest single-season rosters for every Major League organization based on overall rankings in OWAR and OWS along with the general managers and scouting directors that constructed the teams. “Hardball Retrospective” is available in digital format on Amazon, Barnes and Noble, GooglePlay, iTunes and KoboBooks. The print edition is coming soon. Additional information and a discussion forum are available at TuataraSoftware.com.

Terminology

OWAR – Wins Above Replacement for players on “original” teams

OWS – Win Shares for players on “original” teams

OPW% – Pythagorean Won-Loss record for the “original” teams

Assessment

The 1999 Texas Rangers         OWAR: 50.4     OWS: 284     OPW%: .512

GM Tom Grieve acquired 79% (38 of 48) of the ballplayers on the 1999 Rangers roster. 38 of the 48 team members were selected through the Amateur Draft process. Based on the revised standings the “Original” 1999 Rangers placed six games behind the Mariners in the American League Western Division race. Texas (83-79) claimed the Wild Card by a one-game margin over Chicago and Kansas City.

Perennial All-Star backstop Ivan Rodriguez enhanced his trophy case with the 1999 A.L. MVP award. “Pudge” produced a .332 BA while notching career-bests in home runs (35), RBI (113), runs scored (116), base hits (199) and stolen bases (25). Rodriguez collected 13 Gold Glove Awards including 10 in consecutive seasons (1992-2001). “Slammin’” Sammy Sosa launched 63 moon-shots, drove in 141 baserunners and registered 114 tallies. Juan “Igor” Gonzalez belted 39 round-trippers, knocked in 128 runs and delivered a .328 BA after an MVP season in the previous campaign.

Fernando Tatis (.298/34/107) enjoyed a career year over at the hot corner, scoring 104 runs and swiping 21 bags. Rusty Greer clubbed 41 doubles, 20 big-flies and plated 101 baserunners while eclipsing the .300 mark for the fourth successive season. Rich Aurilia (.281/22/80) and Mike Stanley (.281/19/72) supplied additional thump towards the bottom of the lineup. Warren Morris parlayed a .288 BA and 15 long balls into a third-place finish in the Rookie of the Year balloting.

Rodriguez slots into 13th place in “The New Bill James Historical Baseball Abstract” among backstops. He certainly elevated his ranking after playing ten additional years following the publication of NBJHBA in 2001. Right fielders Sosa and Gonzalez are listed in 45th and 52th place, respectively.

LINEUP POS WAR WS
Warren Morris 2B 1.71 15.4
Ivan Rodriguez C 5.22 28.63
Fernando Tatis 3B 5.05 23.74
Sammy Sosa RF 4.98 26.64
Juan Gonzalez DH/RF 2.88 24.42
Rich Aurilia SS 3.06 18.11
Rusty Greer LF 2.32 21.03
Mike Stanley 1B 1.82 13.67
Terrell Lowery CF -0.17 3.21
BENCH POS WAR WS
Rey Sanchez SS 2.59 11.29
Jose Hernandez SS 2.3 16.33
Dean Palmer 3B 1.04 16.71
Hanley Frias SS 0.22 4.42
Edwin Diaz 2B 0.17 0.62
Kevin L. Brown C 0.12 0.58
Jon Shave SS 0.09 1.98
Bill Haselman C -0.04 3.84
Jeff Frye 2B -0.13 2.35
Ruben Mateo CF -0.26 1.9
Kelly Dransfeldt SS -0.26 0.8
Chad Kreuter C -0.58 3.51

Kevin J. Brown, the undisputed ace of the Texas rotation, compiled a record of 18-9 with a 3.00 ERA, 1.066 WHIP and 221 strikeouts. The balance of the starting staff submitted sub-par efforts in contrast to their career norms. Jeff Zimmerman (9-3, 2.36) fashioned a 0.833 WHIP and received an invitation to the Mid-Summer Classic during his rookie campaign.

ROTATION POS WAR WS
Kevin J. Brown SP 5.54 19.92
Darren Oliver SP 3.94 12.45
Rick Helling SP 3.78 12.52
Kenny Rogers SP 2.97 11.57
Wilson Alvarez SP 1.89 9.95
BULLPEN POS WAR WS
Jeff Zimmerman RP 3.67 14.64
Mike Venafro RP 1.19 7.36
Mark Petkovsek RP 0.84 9.49
Terry Mathews RP 0.31 2.54
Danny Kolb RP 0.13 1.9
Brian Bohanon SP 1.63 9.68
Ryan Dempster SP 1.45 6.98
Jim Brower SP 0.42 1.87
Robb Nen RP 0.07 7.89
Danny Patterson RP -0.08 2.64
Mike Cather RP -0.17 0
Corey Lee RP -0.2 0
Jonathan Johnson RP -0.26 0
Bobby Witt SP -0.28 4.52
Billy Taylor RP -0.3 5.54
Dan Smith SP -0.34 1.73
Tony Fossas RP -0.39 0
Ryan Glynn SP -0.42 0
Scott Eyre RP -0.66 0
Doug Davis RP -0.66 0
Julio Santana SP -1 0.17
Matt Whiteside RP -1.1 0

The “Original” 1999 Texas Rangers roster

NAME POS WAR WS General Manager Scouting Director
Kevin Brown SP 5.54 19.92 Tom Grieve Sandy Johnson
Ivan Rodriguez C 5.22 28.63 Tom Grieve Sandy Johnson
Fernando Tatis 3B 5.05 23.74 Tom Grieve Sandy Johnson
Sammy Sosa RF 4.98 26.64 Tom Grieve Sandy Johnson
Darren Oliver SP 3.94 12.45 Tom Grieve Sandy Johnson
Rick Helling SP 3.78 12.52 Tom Grieve Sandy Johnson
Jeff Zimmerman RP 3.67 14.64 Doug Melvin Chuck McMichael
Rich Aurilia SS 3.06 18.11 Tom Grieve Sandy Johnson
Kenny Rogers SP 2.97 11.57 Eddie Robinson Joe Klein
Juan Gonzalez RF 2.88 24.42 Tom Grieve Sandy Johnson
Rey Sanchez SS 2.59 11.29 Tom Grieve Sandy Johnson
Rusty Greer LF 2.32 21.03 Tom Grieve Sandy Johnson
Jose Hernandez SS 2.3 16.33 Tom Grieve Sandy Johnson
Wilson Alvarez SP 1.89 9.95 Tom Grieve Sandy Johnson
Mike Stanley 1B 1.82 13.67 Tom Grieve Sandy Johnson
Warren Morris 2B 1.71 15.4 Doug Melvin
Brian Bohanon SP 1.63 9.68 Tom Grieve Sandy Johnson
Ryan Dempster SP 1.45 6.98 Doug Melvin Sandy Johnson
Mike Venafro RP 1.19 7.36 Doug Melvin Sandy Johnson
Dean Palmer 3B 1.04 16.71 Tom Grieve Sandy Johnson
Mark Petkovsek RP 0.84 9.49 Tom Grieve Sandy Johnson
Jim Brower SP 0.42 1.87 Tom Grieve Sandy Johnson
Terry Mathews RP 0.31 2.54 Tom Grieve Sandy Johnson
Hanley Frias SS 0.22 4.42 Tom Grieve Sandy Johnson
Edwin Diaz 2B 0.17 0.62 Tom Grieve Sandy Johnson
Danny Kolb RP 0.13 1.9 Doug Melvin Sandy Johnson
Kevin Brown C 0.12 0.58 Tom Grieve Sandy Johnson
Jon Shave SS 0.09 1.98 Tom Grieve Sandy Johnson
Robb Nen RP 0.07 7.89 Tom Grieve Sandy Johnson
Bill Haselman C -0.04 3.84 Tom Grieve Sandy Johnson
Danny Patterson RP -0.08 2.64 Tom Grieve Sandy Johnson
Jeff Frye 2B -0.13 2.35 Tom Grieve Sandy Johnson
Terrell Lowery CF -0.17 3.21 Tom Grieve Sandy Johnson
Mike Cather RP -0.17 0 Tom Grieve Sandy Johnson
Corey Lee RP -0.2 0 Doug Melvin
Ruben Mateo CF -0.26 1.9 Doug Melvin Sandy Johnson
Jonathan Johnson RP -0.26 0 Doug Melvin Sandy Johnson
Kelly Dransfeldt SS -0.26 0.8 Doug Melvin
Bobby Witt SP -0.28 4.52 Tom Grieve Sandy Johnson
Billy Taylor RP -0.3 5.54 Eddie Robinson
Dan Smith SP -0.34 1.73 Tom Grieve Sandy Johnson
Tony Fossas RP -0.39 0 Eddie Robinson
Ryan Glynn SP -0.42 0 Doug Melvin Sandy Johnson
Chad Kreuter C -0.58 3.51 Tom Grieve Sandy Johnson
Scott Eyre RP -0.66 0 Tom Grieve Sandy Johnson
Doug Davis RP -0.66 0 Doug Melvin
Julio Santana SP -1 0.17 Tom Grieve Sandy Johnson
Matt Whiteside RP -1.1 0 Tom Grieve Sandy Johnson

Honorable Mention

The “Original” 2001 Rangers              OWAR: 48.4     OWS: 278     OPW%: .513

Sosa shredded opposition pitching to the tune of a .328 BA while launching 64 moon-shots, registering 160 RBI and scoring a League-best 146 runs. Aurilia delivered career-bests with a .324 BA, 37 dingers, 97 ribbies and 114 tallies as he topped the circuit with 206 safeties. Gonzalez swatted 35 big-flies and knocked in 140 baserunners. Zimmerman notched 28 saves and Brown furnished a 2.65 ERA in 19 starts.

On Deck

The “Original” 1924 Senators

References and Resources

Baseball America – Executive Database

Baseball-Reference

James, Bill. The New Bill James Historical Baseball Abstract. New York, NY.: The Free Press, 2001. Print.

James, Bill, with Jim Henzler. Win Shares. Morton Grove, Ill.: STATS, 2002. Print.

Retrosheet – Transactions Database

Seamheads – Baseball Gauge

Sean Lahman Baseball Archive


Are Two Opening-Day Homers Merely Dust-in the Wind?

As a Red Sox fan, I got very excited opening day when Dustin Pedroia hit two home runs. One of the big questions of this offseason is whether he has upper-single-digit homer power, or upper-teens homer power. Of course, as a thinking baseball fan, my head tells me to avoid getting overly excited about a small sample size. But does the two-HR outbreak actually tell us nothing? I think the expectations going into the season combined with Pedroia’s performance in his first game is a perfect situation to use Bayes’ Theorem.

To elaborate, I think Pedroia’s expectations going into this season have a bimodal distribution. If you look at his 2008-2012 seasons, he averaged 16 HR per year. His last two seasons averaged 8 HR per year. Was this due to a real decline, or due to injuries that sapped his power? While someone like Mike Trout might have a nice normally-distributed expectation around 35 HR, I expected Pedroia to have an either/or season: he’d either get back to 2008-2012 production, or continue as a 8-HR guy.

Now for a review of Bayes’ Theorem: it tells you how to update your prior beliefs given an observation. The formula for this is P(A|B) = P(B|A)*P(A)/P(B), where A and B are events, P(A) and P(B) are the probabilities of those events, and P(A|B) or P(B|A) should be read as “Probability of A given B,” or “Probability of B given A,” respectively. Specifically, in this case, A is “Dustin Pedroia is a 16-HR guy”, and B is “Dustin Pedroia hit 2 HR in his first game of the season”. I had a preseason belief about P(A), but I want to update it given that event B has occurred.

As implied above, I’m going to simplify Pedroia’s season outcomes into two possible outcomes: He is an 8-HR guy, or a 16-HR guy. Before the season, I’m going to guess that I had about a 50-50 belief that he was either one. Another assumption I’m going to make, to make the math easier, is that a season will see 640 plate appearances. You can make your own assumptions, but this is a demonstration of how much Bayes’ Theorem helps us update beliefs based on just one observation.

We need to determine three quantities to do our calculation now:
1. P(A)—probability that Pedroia is a 16-HR guy
2. P(B|A)—probability that we would see Pedroia hit 2 HR in his first 5 plate appearances, given that he is a 16-HR guy
3. P(B)—probability that we would see Pedroia hit 2 HR in his first 5 plate appearances (taking our 50-50 chance that he’s a 16 or 8-HR guy as a given)

1. Probability that Pedroia is a 16-HR guy

Easy. By assumption, P(A) is 50%.

2. Probability that we would see Pedroia hit 2 HR in his first 5 plate appearances, given that he’s a 16-HR guy

Tougher, but we can use a binomial probability model. That is 5C2*P(HR)^2*(1-P(HR))^3. When we have 16 HR in 640 plate appearances, P(HR) is 1/40, and 1-P(HR) is 39/40. This turns out to be .00579. P(B|A)= 0.579%.

3. Probability that we would see Pedroia hit 2 HR in his first 5 plate appearances, with preseason assumptions

This is the weighted average of all his possible season outcomes—so probability of 2HR in 5PA, given that he is a 16-HR guy, times the chance that he’s a 16-HR guy, PLUS, probability of 2HR in 5PA, times the chance that he’s an 8-HR guy. The same calculation as in number 2 can be done for if he’s an 8-HR guy, yielding an answer that the chance that he’d hit 2HR in 5PA is 0.151%. Given our calculation in the above paragraph, and our preseason assumption that it’s 50-50 that he’s an 8 or 16-HR guy, that gives us a weighted average P(B) = 0.365%.

So now we can mash all of those numbers into Bayes’ equation, and we find that .50*.00579/.00365 = .794, or 79.4%! Turns out that my Red Sox-loving lizard brain was not wrong! If you believed preseason that there was a 50%-50% chance that Pedroia would return to his 2008-2012 form, you should rationally update your beliefs to 80%-20% on the minuscule sample size of just two home runs in five plate appearances! Another note is that we should be forward-looking: since he has nearly a full season of plate appearances remaining, it might be rational to think that he’s likely to be an 18-HR guy, now that he has 2 in the bag.

This method could be adapted to a continuous expectation of outcomes, allowing a chance that Pedroia might be something besides an 8HR guy or a 16HR guy (although you and I know that that is clearly absurd).


This Post is Not About Kris Bryant

No, really. It isn’t. More ink has been spilled on Bryant than on every other just-sent-to-AAA layer combined. So you won’t get any more of that here.

Ok, this is actually a little about Bryant, in the sense that he is a future Cubs third baseman, and this is about the recent Cubs’ third basemen that have gone before him. It is, by and large, an uninspiring lot, but the list reveals something about how the Cubs used to assemble rosters, and how that now appears to have changed.

Here’s a list of WAR that each major-league team has accumulated at third from the beginning of the division era (1969) to the present. If you scroll waaaay down to the bottom you see the Cubs, down there at 25 out of 30. The only teams worse are all expansion teams. Here’s the same list resorted by wRC+. The Cubs inch up to 24, and a couple of storied (or at least old) franchises now appear below them, but the message is essentially the same: a message of dismal underachievement. This message is not confined to third – those of you who are either Cubs haters or masochists can play with those tables and look at the other positions. It’s the same tale of woe except in the few cases where the Cubs have had Hall-of-Fame-caliber players at a position for some length of time (e.g., Sandberg and Sosa*).

What accounts for this prolonged failure? Could it be The Curse? FanGraphs Community sought comment from the Major League Baseball Ruminants Association, and here’s what their spokesgoat had to say: “The Chicago Cubs’ multiple decades of ineptitude have nothing to do with supernatural forces or the actions or inactions of our members. Rather, the Cubs’ continual suboptimal performance is due to that franchise’s historic inability to integrate such concepts as advanced statistics and an even rudimentary understanding of aging curves into their roster assembly thought processes.”

Pretty strong words there from the MLBRA; let’s see if evidence backs them up.  What follows is a review of the top 10 Cubs third basemen by WAR since 1969. I’m leaving out guys like Mark Bellhorn and Jose Hernandez who played quite a bit at third, but whose primary position was elsewhere. The fact that I even have to say “I’m leaving out guys like Mark Bellhorn and Jose Hernandez” should be sending visible shivers down your spine.

10. Kevin Orie  684 PA, 79 wRC+, 1.9 WAR, Age 24-29

The only player on this list to come up with the Cubs during the divisional era, Orie got off to a promising start in 1997, with a 101 wRC+ in 415 plate appearances, as well as superior defense. He plunged into the abyss in 1998, and after putting up a 39 wRC+ through July, the disgusted Cubs offloaded him to the Marlins for Felix Heredia, whose left-handed arsenal of kerosene would reward opposing hitters for years to come. If you think baseball players get paid too much, take a look at Kevin Orie’s transaction list on Baseball Reference.  This is what life is like for the vast majority of players who aren’t good enough to hold down a steady major-league job.

9. Vance Law  1075 PA, 103 wRC+, 2.3 WAR, Age 31-32

Signed as a free agent in 1988, Law had a BABIP-fueled year in which he also swatted 29 doubles and 11 homers. The alien inhabiting Vance Law’s body returned to its distant galactic home in 1989, and Law reverted to his good-glove, small-stick self. He did get to play in two postseason games in Wrigley, which is two more than the vast majority of living humans can claim.

8. Steve Buechele  1290 PA, 94 wRC+, 3.6 WAR, Age 30-33

Danny Jackson’s disastrous arson spree in Chicago ended in July 1992, when the Cubs traded him to Pittsburgh for Buechele. His main contribution came in 1993, when the BABIP alien returned to Chicago, jacking Buechele’s BABIP up from his career .275 mark up to .305. Buechele produced a respectable 108 wRC+ that year, together with good defense. The rest of his time in Chicago he was essentially a slightly better version of Vance Law.

7. Bill Mueller  670 PA, 112 wRC+, 4.0 WAR, Age 30-31

Acquired after the 2000 season from the Giants for an aging Tim Worrell, who would give them three excellent seasons in relief, Mueller represented a rare venture by the Cubs into the land of sabermetrics. His problem wasn’t sabermetrics; it was injuries. Mueller was an excellent two-way advanced stat contributor when healthy, but in an 11 year career, Mueller exceeded 500 plate appearances just four times, none of them with the Cubs.

6. Steve Ontiveros  1633 PA, 96 wRC+, 4.1 WAR, Age 25-28

The good news: the Cubs got him young. The bad news: they traded Bill Madlock to get him. Ok, the Cubs also got Bobby Murcer in that deal. Meh. Ontiveros had outstanding plate discipline (career K rate: 11.4%; career BB rate: 12.2%), but no power whatsoever (career ISO: .093). Released in 1980, he took his keen batting eye to Japan.

5. Ron Cey  2108 PA, 110 wRC+, 5.6 WAR, Age 35-38

The Penguin waddled into Chicago in 1983 on a salary-dump trade from the Dodgers. He put up good offense for the Cubbies, but by this point in his career had a range not far exceeding that of the third base bag itself. The Cubs probably figured that putting Cey next to an aging Larry Bowa would hide the problem, but Bowa’s range had eroded as well. In 1984, Cey became the first Cubs third baseman to reach the postseason since Stan Hack. I’m sure that’s something he brings up with the grandkids a lot.

4. Luis Valbuena  1241 PA, 100 wRC+, 6.1 WAR, Age 26-28

A waiver acquistion from the Blue Jays in April 2012, Valbuena initially looked like a glove-first utility guy, but his offense gradually improved, until breaking out last year with a 116 wRC+.  The BABIP alien is being sought for questioning: Valbuena’s was .294 last year, compared to a career rate of .269. Although he has a reputation as a platoon bat, his career splits are just about even, so he may have a future as a starter, but it won’t be with the Cubs. Kris Bryant’s long shadow led the Cubs to trade Valbuena to the Astros, where he should have an easier time fending off Matt Dominguez.

3. Bill Madlock  1632 PA, 137 wRC+, 11.1 WAR, Age 23-25

This is the kind of trade the Cubs have all too often failed to make: After a disappointing 1973 season, the Cubs correctly recognized that they needed to retool, and thus dealt Ferguson Jenkins to the Rangers for Bill Madlock.  In his three seasons in Chicago Madlock supplied excellent offense that outweighed his spotty defense. Then in February 1977 the Cubs sent Madlock to San Francisco in exchange for Ontiveros and an aging, declining Bobby Murcer. This is the kind of trade the Cubs have all to often made. Yes, Madlock had issues, but the Pirates would eventually find a way to make use of him after the Giants also gave up on him. If the Cubs had recognized the value of his talent, they might have tried harder to do the same.

2. Ron Santo, 3135 PA, 122 wRC+, 19.9 WAR, Age 29-33

We now know why Ronnie didn’t age particularly well, but he still put up two outstanding seasons (in 1969 and 1972) and three good ones in his remaining time with the Cubs. His later years seem disappointing only in comparison to his four-year reign of terror over NL pitchers from 1964-67 (with respective OPS of .962, .888., .950, and .906). His lowest ISO during that period was .212 in 1967.  The mounds may have been higher back then, but they were never high enough to silence his bat.

1. Aramis Ramirez, 4705 PA, 126 wRC+, 28.5 WAR, Age 25-33

In backhanded revenge for Bill Madlock, in July 2003 the Cubs obtained Ramirez from the Pirates along with Kenny Lofton in exchange for Jose Hernandez and a PTBNL, who turned out to be second round bust Bobby Hill.  A particularly fiery pit in GM Hell awaits Dave Littlefield for this awful deal, but one man’s Hell is another man’s Ramirez, and this trade enabled the Cubs to enjoy the only stability they’ve known at third since Santo’s retirement. Ramirez hit 34 homers for the Bucs in 2001, but in 2002 the homers turned into strikeouts. Ramirez made some progress in 2003, but not enough to kill Littlefeld’s sick fascination with Herrnandez, and so the deal was done. Ramirez immediately blossomed with the Cubs, raking at a .233 ISO rate for the remainder of that season, and continuing his excellent output for many years thereafter. He is the fourth best Cubs third baseman of all time, behind only Santo, Hack, and Heinie Zimmerman.

So yes, this list bears out the ruminant’s ruminations, at least to some extent. Ramirez is the only good third baseman since 1969 that the Cubs had control of during his mid-career years. The Cubs often resorted to trading for or signing aging third basemen with declining performance and expanding paychecks, because their farm system had failed to produce anything better. The few young players they did obtain they either failed to develop (Orie, Ontiveros) or gave up on too soon (Madlock). Valbuena is an exception here, but even he is likely to top out as a second division starter at best. And remember, these are the good guys.

So you can see why Cubs fans are so obsessed with Bryant. For many of the last 45 years, the hot corner in Wrigley has been ice cold.
Z-Scores in Sports (a Supporting Argument for zDefense)

This is part 3 of the Player Evaluator and Calculated Expectancy (PEACE) model, which is an alternative to Wins Above Replacement.  This article will introduce evidence that z-scores can be converted into runs (or points in other sports) with accuracy and reliability, as well as analyze the results that zDefense has produced.

Recall that zDefense is broken down into 4 components: zFielding, zRange, zOuts, and zDoublePlays.  The fielding and range components depend on the accuracy of Calculated Runs Expectancy, which I introduced in Part 1.  Outs and double plays, though, use a different technique: they take z-scores for the relevant rate statistics, then multiply by factors of playing time.  Here were the equations:

  • zOuts = [(Player O/BIZ – Positional O/BIZ) / Positional O/BIZ Standard Deviation] * (Player Innings / Team Innings) * (√ Player BIZ / 2)
  • zDoublePlays = [(Player DP/BIZ – Positional DP/BIZ) / Positional DP/BIZ Standard Deviation] * (Player Innings / Team Innings) * (√ Player BIZ / 2) * Positional DP/BIZ


We can set up models in other sports that estimate point differentials using very similar techniques.  I’ve developed one for college football and another for the NBA.

For the first model, I’ve used the data for every Division I FBS football team from 2000-2014 (1,802 teams), and I defined the relevant statistics and their “weights” as such:

  • zPassing = [[Completion Percentage z-score * Completions per Game] + [Passing Yards per Attempt z-score * Passing Attempts per Game]] / 10
  • zRushing = [Rushing Yards per Attempt z-score * Rushing Attempts per Game] / 10
  • zTurnovers = [Turnovers per Game z-score]
  • zPlays = [Number of Offensive Plays per Game z-score] 


These 4 components summed make up zOffense, while taking each team’s opponents’ calculations results in zDefense.

What I found after summing the different components was that the resulting number, when divided by the number of games played, was a very accurate estimator for a team’s average point differential.

Among the nearly 2,000 college football teams, the average difference between zPoints (calculated margin of victory) and actual MOV was just 3.21 points, with a median of 2.77, and a max difference of 13.97 points.  About 20% of teams’ MOV were calculated to within 1 point or less, 53% were accurate to 3 points or less, 79% to 5 points or less, and 99% to 10 points or less.  The regression model for this dataset can be seen below:

http://imgur.com/kUDwbA7


The NBA model has similar results using 6 parts:

  • z3P (3-point shots) = [[3P FG% z-score * 3-point attempts * 3] / 10
  • z2P (2-point shots) = [2P FG% z-score * 2-point attempts * 2] / 10
  • zFreeThrows = [FT% z-score * free throw attempts] / 10
  • zTurnovers = [Turnovers per Minute z-score * League Average Points per Possession] * 2
  • zORB (offensive rebounds) = [Offensive Rebounds per Minute z-score * League Average Points per Possession]
  • zDRB (defensive rebounds) = [Defensive Rebounds per Minute z-score * League Average Points per Possession] 


Similar to the football model, these 6 components make up zOffense, while each team’s opponents’ calculations make zDefense.  I particularly like z3P, z2P, and zFT because they multiply the z-score by the “weight”: 1, 2, or 3 points.  Recall that zRange is multiplied by the IF/OF Constant, which is just the difference, on average, in runs between balls hit to the outfield vs. balls that remain in the infield.

I’ve only done the calculations for the 2013-2014 season, where teams averaged 1.033 points per possession.  To convert to zPoints in this model, add zOffense and zDefense, then divide by 5.

In most seasons, elite teams will have an average point differential of +10, while terrible ones will hover around -10.  On average, the NBA model had an average difference between the calculated and actual differential of just 1.331 points, with a median of 0.800.  17 out of 30 teams were calculated within 1 point, 25 within 2, and 29 out of 30 were accurate to within 5 points per game.

The fact that these models can be created using the same general principle (rate statistic z-scores multiplied by a factor of playing time equates relative points) provides some evidence that similar results are calculable in baseball.  This is the basis for zDefense in PEACE.  Let’s look at the results.

Most sabermetricians would turn to the Fielding Bible Awards for a list of the best fielders by position in any given year, so we’ll use those results to compare.  If we assume that the Fielding Bible is accurate, then we would expect zDefense to produce similar conclusions.  Comparing the 2014 winners to the players ranked as the best at their position by zDefense, we can see some overlap.  The number in parentheses is the positional ranking of the Fielding Bible Award winner by zDefense.

  • Position: Fielding Bible Winner (#)…zDefense Winner
  • C: Jonathan Lucroy (12)…Yadier Molina
  • 1B: Adrian Gonzalez (1)…Adrian Gonzalez
  • 2B: Dustin Pedroia (2)…Ian Kinsler
  • 3B: Josh Donaldson (2)…Kyle Seager
  • SS: Andrelton Simmons (8)…Zack Cozart
  • LF:Alex Gordon (1)…Alex Gordon
  • CF: Juan Lagares (3)…Jacoby Ellsbury
  • RF: Jason Heyward (1)…Jason Heyward
  • P: Dallas Keuchel (5)…Hisashi Iwakuma

The multi-position winner, Lorenzo Cain, was also rated very favorably by zDefense.  While most positions don’t have a perfect match, every single Fielding Bible winner was near the very top of their position for zDefense.  This is the case for almost every instance, which isn’t surprising: if there were drastic disagreements about who is truly elite, then we would suspect one of the metrics to be egregiously inaccurate.  Instead, we see many similarities at the top, which provides some solid evidence that zDefense is a valid measure.

As always, feel free to comment with any questions, thoughts, or concerns.


Who Won the Kimbrel Trade?

Wow. Craig Kimbrel traded right before the start of the season. I have to admit to being rather shocked. I know the Braves are rebuilding this off-season and it made sense to trade him. He is very highly valued for a player who only pitches 60 innings a season, perhaps over-valued. If the Braves are going to be hopeless this year then who needs a dominant single-inning pitcher?

The trouble is I love watching Kimbrel pitch, no matter the situation. I live in London, in the UK, so a lot of Braves games happen from 1-4am and I don’t get to watch them live. Every morning I use my MLB.com subscription to check the last night’s action. If I don’t have the time to watch the whole game, which is common, I skip to the innings where the Braves scored plus any inning Kimbrel pitches. Pace, a banana curveball and strikeouts, Kimbrel is one of those rare players who is worth watching every minute he plays. Even when he is (rarely) hit you feel a strikeout is coming next. So emotionally, I hate to see him traded (just like I hated seeing Heyward traded). Lots of reporters are saying the trade is a good deal for both sides or an outright win for the Braves, so in emotional despair, I thought I’d have a proper look into it.

The facts of the trade

To the San Diego Padres:

  • Craig Kimbrel – 3 years at $34.75m (includes option buyout) or 4 years at $46.75m
  • Melvin Upton Jr – 3 years at $48.15m

To the Atlanta Braves:

  • Carlos Quentin – 1 year at $11m (includes option buyout) or 2 years at $18m
  • Cameron Maybin – 2 years at $16.2m (includes option buyout) or 3 years at $24.2m
  • 2 prospects and 41st pick 2015 draft

N.B. Bold text highlights the likely choices.

I’ll not be analysing the prospects in much detail, instead ignoring the less relevant trade pieces and looking at the end outcomes. My method is below, but if you like, skip to the summary, that’s the important bit.

Methods

From the Padres POV

  • Upton not wanted/needed. Treat him as a league-minimum replacement-level 5th outfielder for 3 years (cost $1.5m). Add the rest of his salary to the Kimbrel contract.
  • Dumped 2 unneeded players and $27.2m in contracts off the books. Remove these values as savings for the Kimbrel contract
  • Gained Craig Kimbrel. Assume option taken (it is great value – see later*). Contract for 4 years at $46.75m – $27.2m (from Quentin and Maybin savings) + $46.65m (Upton cost)
  • Given up 3 prospects (effectively); 1 good (Wisler), 1 risk (Paroubeck) and 1 draft pick

I feel these are all reasonable assumption/treatments. The Padres want Kimbrel, don’t care much about what they get from Upton (assuming he continues as in 2013-14) and used the Quentin and Maybin savings to pay for it all.

From the Braves POV

  • Quentin not wanted/needed (not sure why – seems a better bench bat than most and nobody will trade for him as they know they can get him for minimum once the Braves cut him). Add his contract to the 2015 payroll – $11m
  • Maybin – Assume continues poor health/form and option buyout is taken. Treat as decent defensive replacement OF (23 career DRS in 8 years). Possibly gets 75 games a season but produces nothing more than T.Cunningham in AAA so set effective salary to league minimum – $1m for 2 years. Add rest of his contract to 2015-16 payroll ($15.2m over 2 years)
  • Payroll changes:
    • Savings – Kimbrel ($46.75m – 4 years), Upton ($48.15m – 3 years)
    • Wastings – Quentin ($11m – 1 year), Maybin ($15.2m – 2 years) – both include buyouts
  • Receive 3 prospects (effectively); 1 good (Wisler), 1 risky (Paroubeck) and 1 draft pick

Again, I feel these assumptions/treatments are reasonable. Maybin may produce better than this, but his batting numbers were as bad as M. Upton the last few years (70-80 wRC+) so I don’t think we can expect much more of him than Melvin (apart from his defence being better).

Summary

Padres POV

  • Get Craig Kimbrel – effectively 4 years for $66.2m ($16.55m/year)
  • Get spare replacement-level 5th OF at minimum salary for 3 years
  • Lose 3 prospects; 1 good, 1 risky, 1 draft pick

Braves POV

  • Lose Kimbrel (and M.Upton)
  • Get spare replacement-level 4th OF at minimum salary for 2 years
  • Payroll savings $67.7m over 4 years ($16.9m/year average)
  • Get 3 prospects; 1 good, 1 risky, 1 draft pick

Analysis

Lots of contract money going back and forth, but the end result is that the Braves get payroll savings of around $17m a year for 4 years and 3 prospects and the Padres give up 3 prospects to get Kimbrel at a reasonable free agent price* of around $17m a year for 4 years.

If you consider that the Padres would have lost that 3rd prospect (the draft pick) if they signed Kimbrel as a free agent, the deal starts to look pretty good for San Diego and AJ Preller. The Padres almost certainly wouldn’t have been able to sign Kimbrel as a free agent with other teams competing (everyone needs a Kimbrel and the Dodgers/Yankees/Tigers/Red Sox etc all have the money for him). The contract would certainly have been longer as well (see footnote on Kimbrel’s historic value*). The Padres are paying Kimbrel a lot, but the amount is fair and they didn’t give up much.

The Braves had signed Kimbrel to a much friendlier contract than he would have got as a free agent (he’s homegrown and a Braves fan so gave a large discount – again see footnote*). Kimbrel gets $13m /year for his free-agent years, when he could have had much more. John Hart effectively used Kimbrel’s generosity to swap the spare value for 3 prospects, one of whom is extremely risky (Paroubeck) and one who is completely unknown (the draft pick). The Braves have rid themselves of Upton, but in taking back other contracts they have effectively only saved the money they should have been paying Kimbrel (had he not given a home discount).

In conclusion, John Hart basically declared he didn’t want a well-paid but high-value closer and swapped it for one good (but not great) prospect and two unknown prospects. So how do I feel now? I would have preferred to watch Kimbrel play for my team every week… Enjoy it San Diego.


*A footnote on Kimbrel’s free agent value

Craig Kimbrel is currently 26 years old and 10 months. Below is a summary list of contracts for comparable relievers and their ages when signing.

Reliever Contract Age at signing Average salary/year
David Robertson $46m – 4 years 29 $11.5m
Andrew Miller $36m – 4 years 29 $8.0m
Jonathan Papelbon $50m – 4 years 32 $12.5m
Koji Uehara $18m – 2 years 40 $9.0m
Joe Nathan $20m – 2 years 40 $10.0m
Mariano Rivera 38 $15.0m
Aroldis Chapman (arb2) $8m – 1 year 27
Greg Holland (arb2) $8.25m  – 1 year 29
Kenley Jansen (arb2) $7.425m – 1 year 27


You’ll notice that Kimbrel is younger than them all and although the average yearly value is not as high as Kimbrel’s $13.0m 2016 salary, the elite arbitration-eligible relievers are likely to beat them all (apart from maybe Rivera). If he were a free agent this last winter, you can assume that he would have been offered 5-year (and possibly longer) contracts.

Kimbrel’s career numbers are also historically unprecedented at his age. This has been said many times before, but my favourite Kimbrel stat is the WAR leaders for relievers over the last 10 years. Kimbrel has the 5th highest WAR from 2005-2014. He entered the league at the end of 2010. Since entering the league in 2010 he leads reliever WAR by 1.5 over Holland and Chapman (who have comparable service time). Before signing his (very team friendly) extension Matt Swartz estimated his first year of arbitration salary should be $10.2m. For a detailed analysis of how much Kimbrel is worth I recommend you read his article (http://bit.ly/1GEjKyT). The point being, he is probably worth at least a $17m/year, 4 year contract.


References

http://www.spotrac.com/mlb/san-diego-padres/melvin-upton/

http://www.spotrac.com/mlb/atlanta-braves/cameron-maybin/

http://www.spotrac.com/mlb/san-diego-padres/craig-kimbrel/

http://www.spotrac.com/mlb/atlanta-braves/carlos-quentin/

http://www.fangraphs.com/statss.aspx?playerid=5015&position=OF

http://www.fangraphs.com/statss.aspx?playerid=5223&position=OF

http://www.fangraphs.com/blogs/evaluating-the-prospects-san-diego-padres/

http://www.baseball-reference.com/players/r/riverma01.shtml

http://www.fangraphs.com/leaders.aspx?pos=all&stats=rel&lg=all&qual=y&type=8&season=2014&month=0&season1=2005&ind=0&team=0&rost=0&age=0&filter=&players=0

http://www.mlbtraderumors.com/2013/10/arbitration-breakdown-craig-kimbrel.html


Tommy John Surgery and Throwing 95+ MPH

Nowadays all the rage seems to be about Tommy John surgeries, as it should be. The number of players who’ve had the surgery is rising at an alarming rate. Therefore many studies have been done on the issue. Most notably by Jeff Zimmerman and John Roegele, who have combined forces to create the biggest and most complete list of Tommy John surgeries. This led them to delve into many studies, such as the effects of Tommy John on performance, the success rate of the surgery, the effects of velocity, the effects of certain pitches, etc… Therefore I decided to do my part.

While a lot has already been done on Tommy John surgeries, not a lot of studies have examined the percentage of hard-throwing pitchers who have had the surgery. Jeff Zimmerman did look at pitchers who hit 100 MPH or more and the percentage of them who have had Tommy John (25% had the surgery). What I will be doing, however, is somewhat different. I will look at the pitchers whose fastball averaged 95 or more and the percentage of them who have had Tommy John surgery, as requested by Jeff, “Help Out: While I looked at pitchers who threw over 100 mph, 100 may not me the key number. Maybe it’s 97 mph, or 95 mph. The increase in velocity and increase in TJS can’t be ignored. It is time to perform a more thorough assessment.”

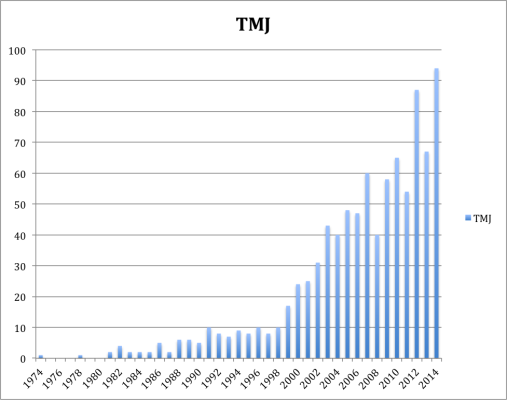
Before I dive into this, some of you reading might not be familiar with Tommy John surgeries, so I’ll give a brief explanation. If you are, however, then you can probably skip this paragraph. Tommy John surgeries or the ulnar collateral ligament (UCL) reconstruction is a surgical procedure where a ligament in the medial elbow is replaced with a tendon from elsewhere in the body. The procedure was first performed in 1974 on a pitcher called Tommy John, by Dr. Frank Jobe; the surgery was named after Tommy John. The procedure is rather devastating and it will usually take around a year for a pitcher to get back onto the field. Now, some pitchers of course never make it back, and some pitchers come back but are never the same. The success rate of the recovery varies and is debatable; some have estimated it at around 80%. For a more elaborate explanation of the success rate I recommend reading Jon Roegele’s article here. The final element you should know is that the Tommy John surgery is on the rise; it’s being performed at an alarming rate, which has spurred many studies. Below is a graph of all the Tommy John surgeries performed since 1974 (not including the ones that occurred in 2015).

TMJ

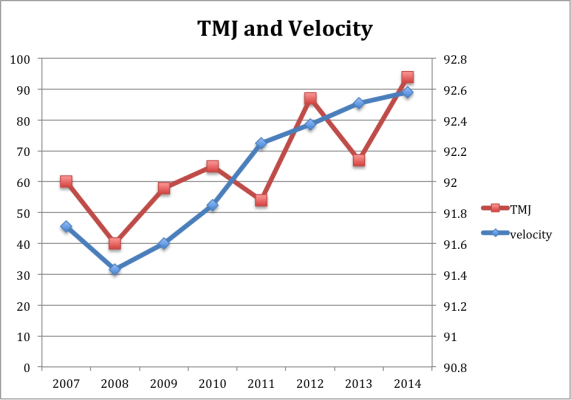
So Tommy Johns are on the rise, and reached an all-time high in 2014. You know what’s also on the rise? Pitcher velocity. Since PITCH f/x was made available in 2007, there has been a steady and consistent increase in pitcher velocity. Both the rise in Tommy John surgeries and the rise in velocity seem to be linked. (The velocity below is on an average per year basis).

TMJ and Velocity

This, however, doesn’t mean that one causes the other. A big question, at the end of almost every Tommy John article, is the attempt to figure out or contemplate what is causing the increase in the surgery. Especially since it seems practically every pitcher that throws hard is getting the surgery, Zack Wheeler being the latest example. Hopefully what follows will show or will give some inclination into whether pitchers who throw hard are more likely to have the surgery.

So first I’ll explain my process. I went on Baseball Prospectus and I looked at every pitcher’s average velocity from 2007 to 2014. I looked at both starters and relievers and I didn’t set an innings limit, in order to get as big of a sample size as possible. Then I took every pitcher who threw 95 or over as the arbitrary definition of hard throwers, which left me with 191 pitchers. After I got every pitcher who 95 MPH or more and I looked up their injury history, to see whether or not they had received the surgery. Here is what I found; I also included the pitchers who threw 96+ MPH because while I was compiling the data, I thought I noticed a slight increase in Tommy John surgeries. A final element to note is that I didn’t look at Minor League pitchers, only the Major Leaguers because unfortunately there is no PITCH f/x data available for minor leaguers (at least that I know of).

Sample Size MPH Percentage of TMJ
191 95+ MPH 32.46%
95 96+ MPH 36.45 %

Of those pitchers who threw 95+ here’s a list of those who have had more than one Tommy John surgery:

Brian Wilson
Pedro Figueroa
Tyler Yates
Christian Garcia

Okay, so now what to make of this? 32.46% seems like an awful lot, but one needs to put it into perspective. Jeff Zimmerman in his “100MPH = Tommy John Surgery?” article pointed out that, “The number of major league pitchers with the surgery now stands at 33% according to Will Carroll.” I personally felt that that number was awfully high.

So I read Will Carroll’s article and found it somewhat problematic. “One-third of current MLB pitchers have had Tommy John surgery. Of the about 360 who started the season, 124 share the all-too-familiar triangular scar.” While I do respect Will Carroll’s work, why did he limit himself to the pitchers who started the season? And what does that even mean? Is it the pitchers who threw on opening day? Was it the pitchers on opening day rosters? Did he use an innings limit? At this point, I’m simply befuddled at how he came to the number of “360 pitchers”. Due to baseball’s Minor League system one first needs to define what qualifies as a Major League pitcher. I’m not sure that Carroll did that or rather cannot tell from his article how he did that. I think a more thorough study needs to be done. For example, not simply looking at the pitchers who start the season. I think a good barometer could be, to set an innings limit, for a certain amount of years and looking at the percentage of those pitchers who had Tommy John. I think that will give us a better sense of the total percentage of pitchers who have had the surgery. Or hell one could do it on a year-by-year basis.

As for this study, what we can conclude is that around one in three pitchers who throw 95+ MPH have to suffer the surgery. If we simply go by Will Carroll’s study, this doesn’t seem like it increases a pitchers chance of getting the surgery at all. I, however, think that with a more thorough study we will find that throwing harder does actually lead to more Tommy Johns. This is of course just a hypothesis, and by no means should be taken as fact. Also saying that 95 MPH is the benchmark for hard throwers is relatively arbitrary, maybe 94+ or 93+ MPH will give us different results.


How Many Elite Players Were Good Prospects?

I really enjoyed Jeff Sullivan’s piece on the prospect pedigree of good players, and it was interesting to see how many solid players never cracked the Baseball America 100 in any year. This is an extension of that article, and not a particularly original one. In fact, I think it’s about the most obvious next step: how many great players were prospects?

It was interesting to see that someone can have a decent season as a totally unheralded player, but there are a lot of players who have a 3-win season and promptly fade into ignominy. Players at that threshold in 2010 included Cliff Pennington and Dallas Braden, and in 2011, Emilio Bonifacio and Alexi Ogando. Cherry-picked names, to be sure, but it’s easy to imagine they (and players like them) are the source of that ~33% of un-ranked good players, and the real elite players are usually identified as at least good. That doesn’t mean it’s true, though, so I tested it.

I pulled the top 10 pitchers and the top 10 position players by WAR for each year from 2010 through 2014. If there was a tie for 10th, I included both players, so the sample ended up at 101 players. Then, for each player, I found their highest ranking on the BA lists. The same caveats as in Jeff’s article apply here, but again, BA is the industry standard, and their lists go back long enough to make them very useful. Following: a giant table, with every qualifying player-year, their WAR in that year (and how that ranked among all players), and their highest prospect ranking and the year of that ranking.

Name Season Team WAR WAR Rank Highest Prospect Rank Prospect Rank Year
Mike Trout 2013 Angels 10.5 1 2 2011
Mike Trout 2012 Angels 10.3 1 2 2011
Jacoby Ellsbury 2011 Red Sox 9.4 1 13 2008
Josh Hamilton 2010 Rangers 8.4 1 1 2001
Roy Halladay 2011 Phillies 8.4 1 12 1999
Mike Trout 2014 Angels 8.0 1 2 2011
Clayton Kershaw 2014 Dodgers 7.6 1 7 2008
Clayton Kershaw 2013 Dodgers 7.0 1 7 2008
Cliff Lee 2010 – – – 6.9 1 30 2003
Justin Verlander 2012 Tigers 6.7 1 8 2006
Andrew McCutchen 2013 Pirates 8.4 2 13 2007
Matt Kemp 2011 Dodgers 8.3 2 96 2006
Carl Crawford 2010 Rays 7.7 2 59 2002
Buster Posey 2012 Giants 7.7 2 7 2010
Corey Kluber 2014 Indians 7.2 2 Unranked Unranked
Clayton Kershaw 2011 Dodgers 7.1 2 7 2008
Andrew McCutchen 2014 Pirates 6.8 2 13 2007
Adam Wainwright 2013 Cardinals 6.6 2 18 2003
Roy Halladay 2010 Phillies 6.2 2 12 1999
Felix Hernandez 2012 Mariners 6.2 2 2 2005
Jose Bautista 2011 Blue Jays 8.1 3 Unranked Unranked
Robinson Cano 2012 Yankees 7.6 3 Unranked Unranked
Josh Donaldson 2013 Athletics 7.6 3 Unranked Unranked
Evan Longoria 2010 Rays 7.5 3 2 2008
Cliff Lee 2011 Phillies 6.8 3 30 2003
Alex Gordon 2014 Royals 6.6 3 2 2007
Matt Harvey 2013 Mets 6.5 3 54 2012
Justin Verlander 2010 Tigers 6.2 3 8 2006
Felix Hernandez 2014 Mariners 6.1 3 2 2005
Clayton Kershaw 2012 Dodgers 5.7 3 7 2008
Dustin Pedroia 2011 Red Sox 7.8 4 77 2006
Carlos Gomez 2013 Brewers 7.5 4 52 2008
Chase Headley 2012 Padres 7.5 4 32 2008
Joey Votto 2010 Reds 7.0 4 43 2007
Anthony Rendon 2014 Nationals 6.5 4 19 2012
CC Sabathia 2011 Yankees 6.4 4 Unranked Unranked
Jered Weaver 2010 Angels 6.1 4 57 2006
David Price 2014 – – – 6.1 4 2 2009
Max Scherzer 2013 Tigers 6.0 4 66 2008
David Price 2012 Rays 5.1 4 2 2009
David Wright 2012 Mets 7.4 5 21 2004
Miguel Cabrera 2013 Tigers 7.4 5 12 2003
Ian Kinsler 2011 Rangers 7.2 5 98 2005
Albert Pujols 2010 Cardinals 6.8 5 42 2001
Josh Donaldson 2014 Athletics 6.5 5 Unranked Unranked
Dan Haren 2011 Angels 6.4 5 Unranked Unranked
Felix Hernandez 2010 Mariners 6.0 5 2 2005
Anibal Sanchez 2013 Tigers 5.9 5 40 2006
Phil Hughes 2014 Twins 5.7 5 4 2007
Cliff Lee 2012 Phillies 5.1 5 30 2003
Ryan Braun 2012 Brewers 7.3 6 26 2007
Chris Davis 2013 Orioles 7.1 6 65 2008
Ryan Braun 2011 Brewers 7.1 6 26 2007
Ryan Zimmerman 2010 Nationals 6.6 6 15 2006
Michael Brantley 2014 Indians 6.3 6 Unranked Unranked
Justin Verlander 2011 Tigers 6.3 6 8 2006
Ubaldo Jimenez 2010 Rockies 5.9 6 82 2005
Felix Hernandez 2013 Mariners 5.7 6 2 2005
Jon Lester 2014 – – – 5.6 6 22 2006
Gio Gonzalez 2012 Nationals 5 6 26 2008
Matt Carpenter 2013 Cardinals 6.9 7 Unranked Unranked
Curtis Granderson 2011 Yankees 6.8 7 57 2005
Andrew McCutchen 2012 Pirates 6.8 7 13 2007
Jose Bautista 2010 Blue Jays 6.4 7 Unranked Unranked
Giancarlo Stanton 2014 Marlins 6.2 7 3 2010
Jered Weaver 2011 Angels 5.9 7 57 2006
Josh Johnson 2010 Marlins 5.8 7 80 2006
Cliff Lee 2013 Phillies 5.5 7 30 2003
Jordan Zimmermann 2014 Nationals 5.3 7 41 2009
Zack Greinke 2012 – – – 5.0 7 14 2004
Evan Longoria 2013 Rays 6.7 8 2 2008
Alex Gordon 2011 Royals 6.6 8 2 2007
Adrian Beltre 2012 Rangers 6.5 8 3 1998
Adrian Beltre 2010 Red Sox 6.4 8 3 1998
Jose Bautista 2014 Blue Jays 6.2 8 Unranked Unranked
Francisco Liriano 2010 Twins 5.7 8 6 2006
Doug Fister 2011 – – – 5.2 8 Unranked Unranked
Chris Sale 2014 White Sox 5.1 8 20 2011
R.A. Dickey 2012 Mets 4.9 8 Unranked Unranked
Mat Latos 2013 Reds 4.8 8 Unranked Unranked
Miguel Cabrera 2011 Tigers 6.5 9 12 2003
Jason Heyward 2012 Braves 6.5 9 1 2010
Robinson Cano 2010 Yankees 6.3 9 Unranked Unranked
Paul Goldschmidt 2013 Diamondbacks 6.3 9 Unranked Unranked
Jonathan Lucroy 2014 Brewers 6.2 9 Unranked Unranked
Adam Wainwright 2010 Cardinals 5.6 9 18 2003
Jake Arrieta 2014 Cubs 5.1 9 67 2009
Matt Cain 2011 Giants 5 9 10 2006
Justin Verlander 2013 Tigers 4.8 9 8 2006
Johnny Cueto 2012 Reds 4.7 9 34 2008
Joey Votto 2011 Reds 6.4 10 43 2007
Miguel Cabrera 2012 Tigers 6.4 10 12 2003
Andres Torres 2010 Giants 6.3 10 Unranked Unranked
Manny Machado 2013 Orioles 6.2 10 11 2012
Carlos Gomez 2014 Brewers 5.7 T-10 52 2008
Adrian Beltre 2014 Rangers 5.7 T-10 3 1998
CC Sabathia 2010 Yankees 5.1 10 Unranked Unranked
Max Scherzer 2014 Tigers 5.1 10 66 2008
Matt Garza 2011 Cubs 5.0 10 21 2007
CC Sabathia 2012 Yankees 4.7 10 Unranked Unranked
Chris Sale 2013 White Sox 4.7 10 20 2011

That is a big, ugly table, so here are some summary facts. Of this 101-player sample, 20 were never ranked by Baseball America, so indeed, top players appear to be more likely to have been a ranked prospect (80%) than good players (66%, per Jeff’s article). None of the unranked players were ever the best position player or pitcher in 2010-2014; the 1st place player with the lowest ranking was Cliff Lee, who topped out at 30th in 2003. The unranked players tended to be concentrated toward the bottom of the WAR leaderboards; 75% of the unranked players had a rank of 5th through 10th. I expected more of the people in 8th through 10th in a given season to be beneficiaries of a fluke season, but there are a lot fewer of those than I expected. The unranked players with the least impressive careers outside their top seasons are probably Andres Torres and RA Dickey, but the other unranked players are pretty uniformly great. Maybe not top-10-WAR-every-year-great, but still, great.

What about pitchers versus position players? If the top 10 by WAR of one group was more likely to include unranked players than the other, that would suggest that group was more difficult to scout and accurately predict. But while the split between pitchers and hitters among the unranked players is not totally even, 12 to 8, it’s well within what I would expect from random variation. Maybe a bigger sample could pull something meaningful out, but I’m not comfortable concluding there’s a difference based on this alone.

The following chart digs more into the individual ranks in each season. The x-axis is the WAR rank, and the bar height is the percentage of players at that point that were in the BA top 100. The line running across the chart is the average BA ranking of the players that were ranked.

chart 1

What this shows is a pretty steady decline in the percentage of players ranked in the BA Top 100 as you move down the WAR leaderboard, and a totally random average ranking of those ranked players. This fits with my perception of prospect rankings – being good enough to be ranked is pretty important, but the exact position on those rankings is not very predictive. As Jeff showed, it’s very tough to be good without being ranked, but this suggests it’s not tough for a prospect to be ranked as if he’ll be merely good, but be great some season.

What about consistent greatness? This list I created really doesn’t capture the best players of the last five years, but the best player-seasons. Can someone be really excellent over a sustained period of time if they weren’t ranked? For this, rather than looking at individual seasons, I grabbed the top 25 hitters and the top 25 pitchers by total WAR from 2010 through 2014. I thought about doing several five-year periods, but I didn’t want to double-count someone like Miguel Cabrera, who would show up for both 2010-14 and 2009-13. Below, a slightly less-giant table than the first, containing similar information: their WAR from 2010-2014, their highest BA ranking (if any), and the year that ranking came in.

Name Team WAR Highest Prospect Rank Year
Clayton Kershaw Dodgers 32.2 7 2008
Miguel Cabrera Tigers 31.4 12 2003
Andrew McCutchen Pirates 30.9 13 2007
Robinson Cano – – – 29.9 Unranked Unranked
Mike Trout Angels 29.5 2 2011
Adrian Beltre – – – 29.1 3 1998
Felix Hernandez Mariners 28.9 2 2005
Jose Bautista Blue Jays 27.8 Unranked Unranked
Justin Verlander Tigers 26.7 8 2006
Ben Zobrist Rays 26.7 Unranked Unranked
Cliff Lee – – – 26.2 30 2003
Joey Votto Reds 26.2 43 2007
Evan Longoria Rays 26.1 2 2008
Dustin Pedroia Red Sox 24.9 77 2006
David Price – – – 24.5 2 2009
Buster Posey Giants 23.8 7 2010
Matt Holliday Cardinals 22.8 Unranked Unranked
Troy Tulowitzki Rockies 22.7 15 2007
Chase Headley – – – 22 32 2008
Cole Hamels Phillies 21.9 17 2004
Alex Gordon Royals 21.7 2 2007
Jason Heyward Braves 21.7 1 2010
Ian Kinsler – – – 21.3 98 2005
Zack Greinke – – – 21.2 14 2004
Adam Wainwright Cardinals 21.2 18 2003
Max Scherzer Tigers 21.1 66 2008
Giancarlo Stanton Marlins 21 3 2010
Yadier Molina Cardinals 21 Unranked Unranked
Chase Utley Phillies 21 81 2003
Adrian Gonzalez – – – 20.6 31 2003
Ryan Braun Brewers 20.5 26 2007
David Wright Mets 20.5 21 2004
Jacoby Ellsbury – – – 20 13 2008
Josh Hamilton – – – 19.8 1 2001
Anibal Sanchez – – – 19.7 40 2006
Jered Weaver Angels 19.7 57 2006
Jon Lester – – – 19.2 22 2006
CC Sabathia Yankees 18.8 Unranked Unranked
James Shields – – – 18.3 Unranked Unranked
Hiroki Kuroda – – – 17.8 Unranked Unranked
Madison Bumgarner Giants 17.8 9 2009
Gio Gonzalez – – – 17.7 26 2008
Mat Latos – – – 17.6 Unranked Unranked
Doug Fister – – – 16.9 Unranked Unranked
Roy Halladay Phillies 16.5 12 1999
Chris Sale White Sox 16.1 20 2011
C.J. Wilson – – – 15.6 Unranked Unranked
Dan Haren – – – 15.5 Unranked Unranked
Jordan Zimmermann Nationals 15.5 41 2009
Johnny Cueto Reds 15.5 34 2008

Of these 50 players, 12 were unranked, or almost the exact same percentage as the single-season leaders (24% for the five-year vs. 20% for the single-season). Of the 12 unranked players, 7 came between 38th and 50th on the leaderboard, but 3 came in the top 10 (Robinson Cano, Jose Bautista, and Ben Zobrist). At first glance, there was no meaningful split in the unranked players between pitchers and hitters (7 vs. 5), but interestingly, all 7 of the unranked pitchers were in the bottom half of the pitcher leaderboard. All of the top 12 pitchers in the last five years were ranked, with Max Scherzer (#66 on BA’s 2008 list) the lowest, so perhaps it’s less likely a pitcher will be truly elite out of nowhere than a hitter. Again, with this small a sample, I’m not comfortable concluding anything, but it’s certainly interesting.

This is kind of an anticlimactic article, because none of my expectations were turned upside down. A great player was likely to have been ranked at some point, more likely than a merely good player, but there are still some who come out of nowhere. Of those ranked, the actual rank seems to matter less than the fact that they cracked the top 100. None of that is very surprising, but hopefully it’s still interesting to see it all laid out.


Six Feet Under: Evaluating Short Pitchers

It’s September 10th, 1999, and the small flame-throwing right-hander from the Dominican Republic just struck out Scott Brosius and Darryl Strawberry. He’s about to get Chuck Knoblauch swinging (and missing) on 1-2 count for his 17th strikeout of the night to finish the game. He does, and the fans at the old Yankee Stadium go nuts, for they’ve just seen Pedro Martinez’ finest start in the greatest pitching season of all time. The final score is 3-1, with the only Yankee run, and hit, coming off a Chili Davis home run. Pedro is 5’11’’ and 170 lb, one of the smallest pitchers in baseball. While most players tower over him off the mound, Pedro writes a different story when he’s pitching. The Yankee hitters fail to notice his height when he kicks his leg up, down, and serves a 95-mph fastball from a three-quarters delivery at their eyes.

The average male height in the U.S. is 5’10’’. You’d never know this from watching a baseball game, where the average height is about 6’2’’, with pitchers just a little taller at about 6’3’’. We all remember the success Randy Johnson had at 6’10’’, and his height was always considered an advantage. When we watched Pedro Martinez, however, commentators and baseball men viewed him as an exception to some obscure and unwritten rule: that shorter athletes can’t become successful pitchers.

Six feet, like 30 home runs or a .300 batting average, has become a number associated with a distinct meaning. If you hit 30 home runs, you’re a power hitter. Hit 29 homers, and you have some pop. If you hit .300, you’re a great hitter. Hit .299, and you just missed hitting .300. Similarly, if you’re six feet, you can pitch. If not, you’re short, but at least you might get an interesting nickname like Tim Lincecum’s (5’11”) “The Freak.”

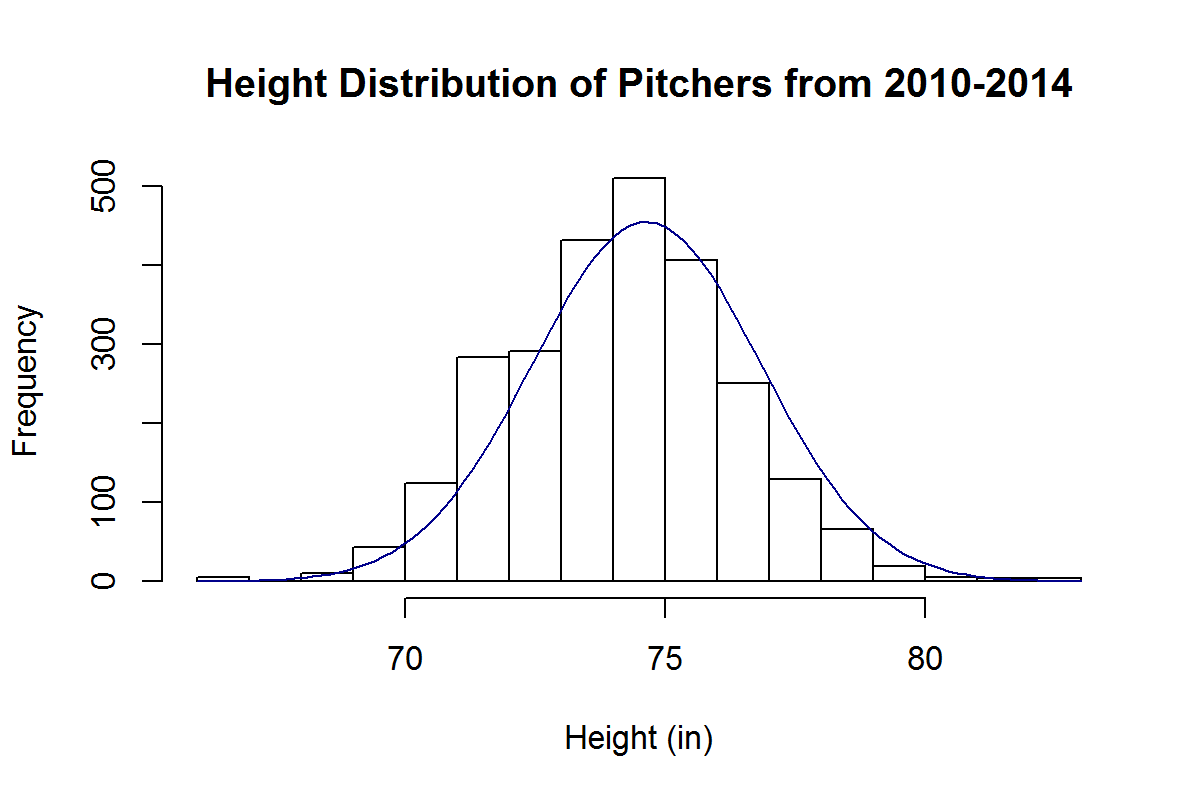
Most Major League pitchers fall between 6’1’’ and 6’4’’. We can look at the height distribution for pitching seasons of the last 5 years and see that it’s approximately normal:

By this approximation, the chance of randomly selecting a pitcher of the last 5 years who is shorter than 5’11’’ is about 5%.

Are short pitchers really destined to fail? We’ve all been told that it’s better to be taller if you pitch. But is this true? Let’s consider short pitchers to be 5’11’’ or under and examine their effectiveness and distribution in comparison to taller pitchers, who we’ll consider to be 6 feet or taller.

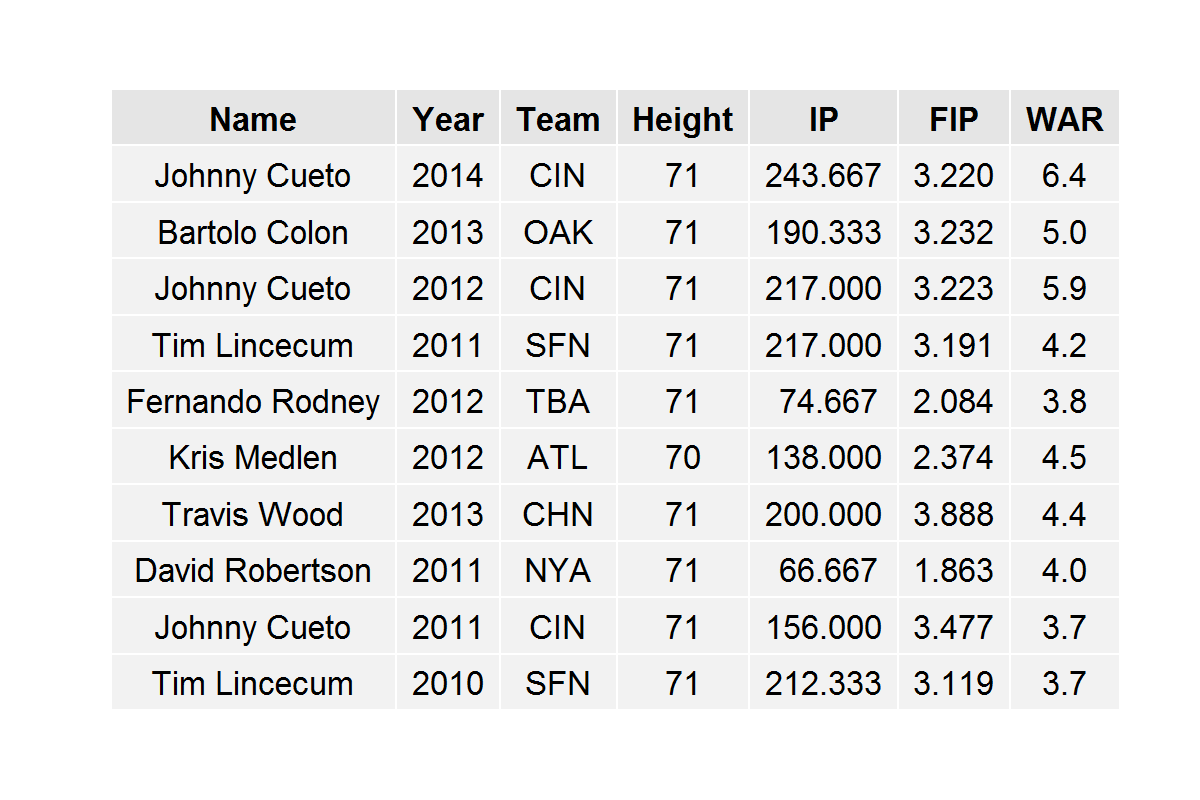
The top ten best pitching seasons for shorter pitchers of the last 5 years are:

We notice that Tim Lincecum appears on this list twice and Johnny Cueto appears on it three times. All of these pitchers are 5’11’’ with the exception of Kris Medlen, who is 5’10’’. So, we see that successful pitching seasons by short pitchers don’t come completely out of the blue. Short pitchers can be successful and can dominate batters, most of whom are much taller, as Cueto did last year and in 2012.

In fact, short pitchers aren’t all that rare to come by, although they’re considerably rarer than taller pitchers. In the last 5 years, there have been 23 instances of short starting pitchers throwing at least 150 innings. In comparison, there have been 402 instances of this type for taller starting pitchers.

Shorter pitchers are generally relegated to the bullpen; there have been 95 instances in the last 5 years of full-time short relief pitchers and 968 instances of full-time taller relief pitchers.

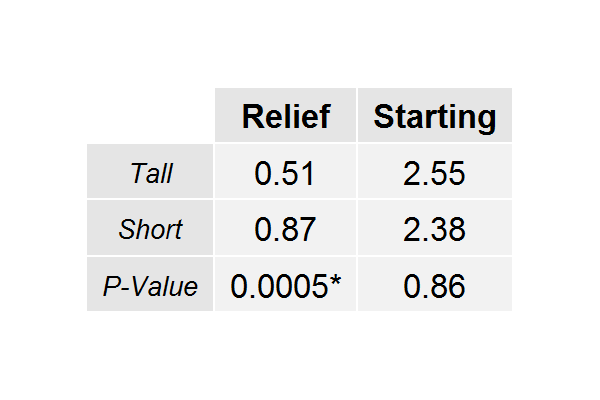
We can see the average WAR breakdowns for all of these pools of players in the following table, along with P-Values for a two-sided t-test comparing the short relievers against the tall relievers and the short starters against the tall starters:

What the 0.0005 is telling us, here, is that we would observe these results by chance alone with probability 0.0005. Thus, there is actually a significant difference in the mean WAR for short relievers and the mean WAR for tall relievers (obviously favoring short relievers). On the other hand, the difference between the starters is not significant. Either way, we have no evidence to suggest that shorter pitchers are any less effective than taller pitchers.

Are shorter pitchers undervalued in the baseball market? If so, to what extent? We can approach this by examining the WAR value of a pitcher relative to his salary in free agency. We can do this by comparing the height groups within relievers and starters (since relievers are generally valued differently than starters).

However, we find that in the last five years, there are only 4 instances of a starter 5’11’’ or shorter pitching for a team that acquired him via free agency; and all of them are Bartolo Colon seasons from 2011-2014.

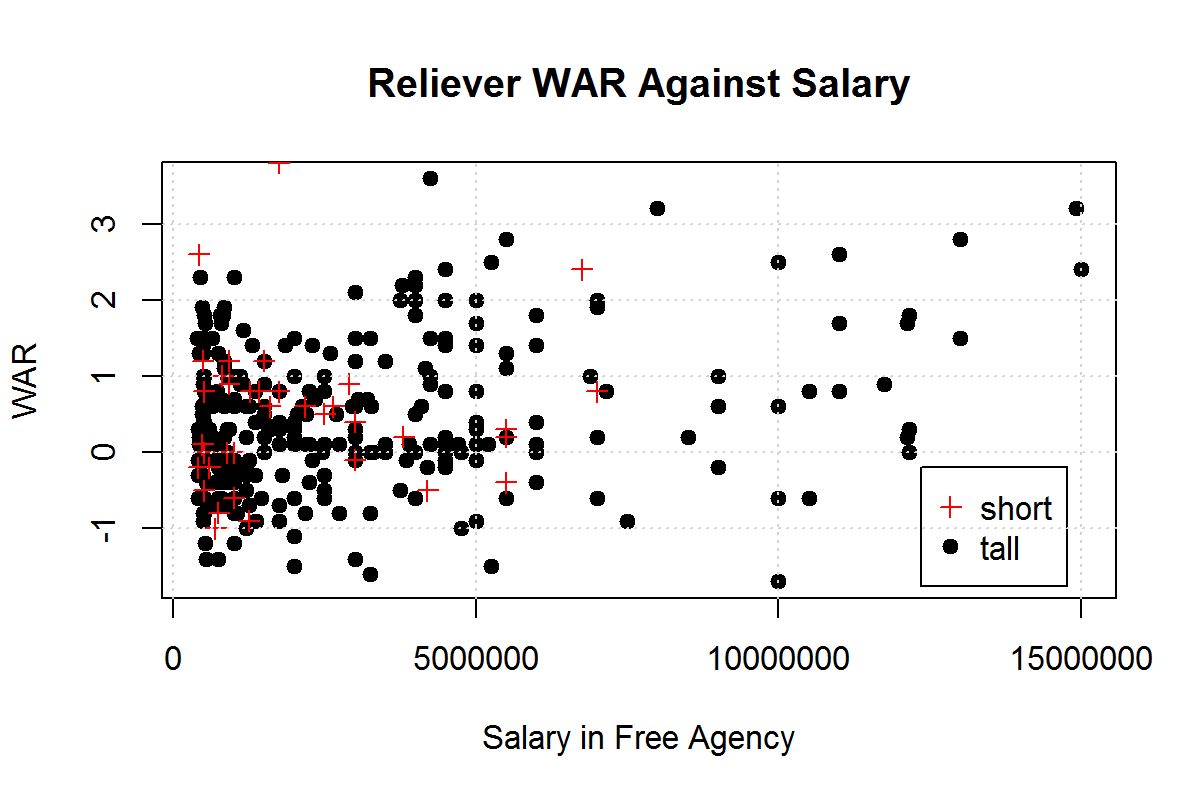
Fortunately, there are more instances of this in relievers, which is what we’ll examine. We notice the distribution of WAR and relievers’ salaries in free agency:

We see that short and tall relievers are clustered between -1 and 1 WAR and $1 million and $5 million dollars. However, we see several taller relievers past the $7.5 million mark with unremarkable WARs, which we don’t see for shorter relievers. From this, we would suspect that taller relievers are being overvalued while shorter relievers are being undervalued.

This is, in fact, the case: short relief pitchers are producing 2.33 WAR for every $10 million they earn in free agency while taller relievers are producing 1.36 WAR for every $10 million they earn. In comparing these values with a one-sided t-test, we acquire a P-Value of 0.0018, meaning these are results we would acquire by chance only .18% (a significant value) of the time. And so it goes, relievers under 6 feet are actually about 1.7 times as valuable as their taller counterparts.

Is there something inherently different about shorter pitchers that makes them less capable of pitching successfully in the big leagues? The evidence says no. In fact, it might be more worthwhile for General Managers to draft pitchers under 6 feet tall and reap the rewards.

Just because an athlete doesn’t tower over his opponents off the mound, doesn’t mean he can’t bring 55,000 dumbfounded Yankee fans to their feet on an unassuming September evening.


Do Pitchers Keep Defenses on Their Toes?

As a Blue Jays Fan, I’ve enjoyed the opportunity to watch Mark Buehrle pitch the last two years. Getting to see a player with below-average stuff (and that’s probably generous) retire major-league batters regularly is a real treat. On top of that, Mark Buehrle is one of the fastest-paced pitchers in all of baseball. He led all of baseball in 2014 in time between pitches, or pace. He was second in 2013 to teammate R.A. Dickey. He was first again in 2012. Games with Mark Buehrle on the mound move quickly. Often you will hear comments that this has the effect of keeping fielders “on their toes”.

Here’s his manager John Gibbons after a start last September – “He’s a teammate’s dream because he keeps his defence on their toes by working fast.” And here is a quote from Jose Bautista after a start last June – “He’s pitching great, throwing strikes, keeping people off balance and allowing us a chance to play defence behind him. It’s no surprise that every time he pitches there are plenty of good defensive plays made. He keeps everybody engaged in the game because he works quick.”

What Gibbons, Joey Bats, and many others, are saying is that, due to the quicker pace of play, fielders are more ready to react to balls towards them. The implication of this statement is that Mark Buehrle, and other similarly fast paced pitchers, receive better than expected defense, especially on the infield. I’ve often wondered if this belief had any merit so I decided to look into it myself.

I took a look at the rate at which groundballs hit off of Buehrle have been turned into outs throughout his career and compared his numbers to those of his teammates (Note that I would have liked to include only other starting pitchers from among Buehrle’s teammates but was unable to do so. I wouldn’t expect it to make much of a difference though). These numbers come from baseball-reference.com.

Here is what that data looks like:

Mark Buehrle's Groundout Rates

We can see that Buehrle’s ability to “keep infielders on their toes” does not translate to more outs on groundballs relative to his teammates in every year. In fact, in only seven of his 14 full seasons has Mark Buehrle’s rate of groundballs converted into outs exceeded those of his teammates. If being a fast-paced pitcher improved the defense behind you then we’d expect to see Mark Buehrle consistently outperform his teammates. Only once in the past five years has this been the case.

That one time in the past five years though, 2012, is interesting. In 2012, Buehrle’s one year with the Miami Marlins, only 41 of the 259 groundballs hit off of Buehrle went for hits. This 82% out rate was well above that of the rest of the team, which stood at 72%. Perhaps we could conclude that the Miami infielders were particularly impacted by Buehrle’s fast pace. This is likely not the case though as the primary shortstop of that team, Jose Reyes, was also the primary shortstop behind Buehrle in 2013 & 2014 with the Blue Jays. In those two years, Buehrle actually had worse infield defense behind him than his teammates (and, sadly, the two worst rates of groundball to out conversion in his career), so it’s likely that Buehrle’s success in 2012 was more due to luck.

This analysis doesn’t consider the average velocity of groundballs hit off of Buehrle compared to his fellow pitchers or anything to do with groundball trajectories, but it seems clear that any defensive advantage Buehrle gains from pitching quickly is minimal at best. Over the course of Buehrle’s 14 complete seasons, groundballs have been converted into outs 75.3% of the time, while the groundballs hit off of his teammates have turned into outs 74.0% of the time. This difference equates to between 5 and 6 extra outs a year. This isn’t a huge advantage, but 5 or 6 extra outs a season and regular two and a half hour games is better than a kick in the teeth.

Next, I wanted to see if the ability to “keep fielders on their toes” was seen in pitchers other than Mark Buehrle. I looked at the ten fastest-paced starting pitchers from 2014 (min 100 IP) to see if there was a noticeable increase in groundballs converted into outs when compared to their teammates. I also did the same for the ten slowest-paced starting pitchers. In the fast-paced group are Buehrle, Dickey, Doug Fister, Wade Miley, Jon Niese, Andrew Cashner, Michael Wacha, TJ House, Dan Haren, & Chris Young. In the slow-paced group are plodders Jorge de la Rosa, Yusmeiro Petit, Clay Buchholz, Tyler Skaggs, Edinson Volquez, Chris Archer, Hiroki Kuroda, Masahiro Tanaka, Yu Darvish, & Edwin Jackson (One pitcher had to be excluded from each group as they were traded midseason and therefore exact split data for their teammates was unavailable. These pitchers were David Price from the slow-paced group and Vidal Nuno from the fast-paced group).

The results are below:

Pitcher Groundout rates

Rather than seeing the fast-paced pitchers receiving better groundball defense than their slow-paced peers, we actually see the reverse. Groundballs off the bats of slow-paced pitchers were converted to outs more often than those off of fast-paced pitchers. Once again, this analysis doesn’t consider batted-ball velocity or trajectory, but it seems clear that the supposed benefit of a faster pace doesn’t show up in infield defense. And although the data table above showed that slow-paced pitchers benefited from stronger infield defense, it seems unlikely that this is caused by the slow pace of the pitchers. Rather this is almost certainly statistical noise.

With pace of play concerns becoming more prevalent in baseball these days, there may be some pressure on pitchers to take less time between pitches. If pitchers do make such changes, they shouldn’t expect to receive any stronger defense behind them, even if some may suggest as much. So the next time a broadcaster or anyone applauds a guy for “keeping the defense on its toes” with his fast pace, you can remain skeptical that such a benefit exists. After all, these are major-league ballplayers, many of whom are being paid millions of dollars. I’m sure they can pay attention for an extra ten seconds.


Should Players Try to Bunt for a Hit More?

This post will look at bunting for a hit and try to identify if it is a skill that can efficiently and effectively increase offensive production, and answer the general question of, should players bunt more?

Is Bunting for a Hit a Skill?

Before we answer the ultimate question of whether or not players should bunt more, we need to first identify whether or not bunting for a hit is a skill to begin with.

This is where data becomes an issue, but we should be able to make do.

Before 2002 there are no records on FanGraphs of bunt hits, so I looked at all qualified hitter seasons from 2002 to 2014 in which a player bunted three or more times in a season—since most players go a whole season without a bunt, three bunts or more in a season puts a player in the top fifty percentile for bunt attempts in a season.

From there I looked at the year-to-year correlation of a player’s bunt hit percentage—bunt hits divided by bunts (i.e. a player’s batting average on bunts)—for the entire population. Mind you, we only have record of the amount of times a player bunts, not the amount of times a player attempted to bunt for a hit. So in all reality, a player’s bunt hit percentage would be higher if we were able to tease out the amount of times that they laid down a sacrifice bunt from their total bunts. However, from the data we are still able to find a .33 year-to-year correlation on bunt hit percentage for our population of hitters.

Takeaway: bunting for a hit is a skill.

Should Players Bunt More?

Now that we’ve answered the question of whether or not bunting for a hit is skill, we can circle back to our original question of whether or not players should bunt more.

Because we want to have a large enough sample of attempted bunts for bunt hit percentage (BH%) to stabilize, we will look at all qualified hitter totals (i.e. multiple season totals), not individual seasons, from 2002 to 2012.

To answer our question we need to look at the expected value gained for a player when they have an at bat where they don’t attempt to bunt—a regular at bat—and subtract it from the expected value gained in at bats where they attempt to bunt for a hit—a bunt hit attempt.

To come up with the expected value of a regular at bat we have to look at the linear weight value added per plate appearance of a player’s at bats from 2002 to 2012, or their entire career value if their whole career falls within that period. We then multiply that linear weight value per plate appearance by probability that they achieve one of those outcomes.

Here’s the formula for Expected Value of a regular at bat (xRA):

  • =((((1B-Bunt Hits)*0.474)+(2B*0.764)+(3B*1.063)+(HR*1.409)+(HBP*0.385)+(IBB*0.102)+(UBB*0.33))/(PA-Bunt Attempts))*((1B-Bunt Hits)+2B+3B+HR+BB+HBP)/(PA-Bunt Attempts)

This formula looks much more complicated than it actually is, but you’ll be able to click into the cells in the live excel document below and visually see how the values are computed. All of the decimals that are part of the formula are linear weight values, which you can find here.

We need to go through the same process to figure out what the expected value added is for a player on a bunt hit attempt—the average value added with a bunt times the probability of a successful bunt hit (BH%).

I was unable to find the linear weight value of a bunt hit, but we do have a sufficient substitute. A bunt hit essentially adds the same value as a base hit with no runners on base—.266 runs per inning. A single with no runners on base is a good proxy for the happening of a bunt hit. Like a base hit with no runners on base, a bunt hit offers no opportunity for a runner on base to score or advance past the next base in front of them. Short of looking at box score data to find the average amount of runners that scored per inning after a successful bunt hit, which will need to be done for a more conclusive answer to our question, we will use the average linear weight value of a single with no runners on for each of the out states as our linear weight value (i.e. I averaged the linear weight value of a single with no runners on base and no outs, a single with no runners on base and one out, and a single with no runners on base and two outs to get the average linear weight value; this is not the exact way to get the linear weights value of a single with no runners on base, because there are undoubtedly a different amount of singles with no runners on base that occurred for each out state, but this should be close).

This is the formula for expected value gained on a bunt attempt (xBA):

  • Bunt Hit Average (bunt hits/total bunts)*.266 (our estimated linear weight value for a bunt hit)

Now that we’re able to come up with the expected value added for a player in a regular at bat (xRA) and the expected value added for a player on a bunt hit attempt (xBA), we can subtract the two values from each other—xRA minus xBA—to see which players have lost the most value per plate appearance by not bunting.

This chart shows the players with a minimum of ten bunt attempts that have lost the most value by not bunting (i.e. which players have the biggest difference between their expected value gained from a regular at bat and a hit attempt):

Click Here to See Chart with Results

Bunts: Bunt attempts

Bunt Hits: Hits on bunts

RA%: Chance that a positive offensive event occurs, outside of bunt hit

BA%: Chance that a player gets a hit on a bunt

xRA: Expected value added from a regular at bat

xBA: Expected value added from a bunt attempt

Net Value: xRA minus xBA

Implications

This research doesn’t mean to suggest that all players who have a higher expected value added on a bunt attempt than they do in a regular at bat should bunt every time. Carlos Santana gets a hit in 78% of the at bats where he bunts, but he has only attempted 14 bunts in his career, so we don’t have a large enough sample of bunt attempts to know what his actual average on bunt attempts would be; this goes for most if not all of the players on this list. There is most likely an inverse correlation between BA% and bunt attempts (i.e. the more you try and bunt for a hit, the less likely you will get a hit as the infield plays further up on the grass).

This research means to suggest that players have not reached the equilibrium for bunt attempts (i.e. they haven’t maximized their value). Players should increase the percentage of the time they bunt until their xRA and xBA are the same; at this point their value will be maximized. The more a player with a negative net value tries to bunt for a hit, the more expected value he will add. This will happen until his expected value added from a bunt falls beneath what he is able to achieve through a regular at bat; this happens when the defense starts to defend him more optimally, they align for the bunt hit, and his BH% falls. Once this occurs he will force the defense to play more honestly—the infielders will have to play farther in on the grass—and increase his expected value added in a regular at bat as more balls get past the infield from shallow play.

What’s interesting is that there are two different types of players on this list. The first type of player is the type that you would traditionally think of as player who would try and bunt for a hit: the speedster with very little power. The second type of player is the player who, as a result of the recent, extensive use of defensive shifts, has a high BA%—batting average on bunt hits—because the defense is not in a position to cover a bunt efficiently: Carlos Santana, Carlos Pena, Colby Rasmus, etc.

The voice for the question about why players don’t try to beat the shift with bunts down the third base line has grown louder, but there still hasn’t been a good answer as to why it hasn’t been done more; the evidence seems to suggest that it is valuable and should be done more. I’m not able to confirm that the 11 hits that Carlos Santana had on bunt hits came when the defense was in a shift, but I think it would be somewhat unreasonable to believe that he was able to beat out a throw to first on a bunt hit attempt when the defense was in a traditional alignment more than a few times.

Carlos Santana Spray Chart
Carlos Santana’s spray chart take from Bill Petti’s Spray Chart Tool

The image above is a spray chart of Carlos Santana’s ground ball distribution as a left-handed hitter; the white dots are hits and the red dots are outs. This chart suggests that it would be advantageous for teams to shift against Santana when he bats left-handed. I would argue that because of Santana’s success—his high BH%—at bunting for a hit, he should do this more, which will generate more value by itself, and increase the value generated in regular at bats as he forces the defense to change their defensive shift against him from the increase in bunt attempts. However, once he reaches the equilibrium, any further changes may ultimately be a zero sum game.

There are no silver bullets to get more runners on base, but there will always be more efficient, undervalued ways to achieve that goal. This research has proven that bunting for a hit is underutilized, and once more work is done to tease out sac bunts from a player’s bunt hit attempts and calculate an accurate BH%, along with the generation of linear weight values for a bunt hit, we will have a more definitive answer for what a bunt hit is worth.

Devon Jordan is obsessed with statistical analysis, non-fiction literature, and electronic music. If you enjoyed reading about pitcher value in Fantasy Baseball, follow him on Twitter @devonjjordan.