Exploring Batter xwOBA and its Applications, Part 2
In Part 1, I discussed what batter xwOBA does, what data feeds into it (using Statcast’s quality of contact types, including barrels), and thus what some sources of noise or “batted ball luck” are contained within xwOBA despite what it strips out in terms of defense and park impacts.
Some takeaways to set up Part 2:
- Barrel% (AKA barrels per plate appearance) appears to be in a similar range of year-to-year reliability as K% and BB% for batters, while other Statcast quality of contact categories that produce positive results had far worse year-to-year consistency.
- When comparing roughly the first third of a season to the rest of a season, it appears that barrels remain one of the more reliable metrics we examined, while “flares and burners,” which are worth a bit less than half the wOBA of a barrel on average, are very unreliable despite making up 25% of all batted balls. Thus, variation in the number of flares and burners a batter hits was identified as a likely source of noise that would still exist in xwOBA. (The same, to a lesser extent, could be said of “solid contact.”)
Now that we understand what feeds into xwOBA better, I want to look at the descriptive and predictive capabilities of xwOBA. To be clear, while xwOBA regresses results on batted balls based on exit velocity and launch angle, it is not a projection of future results / a predictive metric.
The “expected” element refers to what you would have expected a player’s past results to be. In this manner, it is similar to FIP, though FIP is much simpler. And, just like with FIP, you cannot simply look at a player’s FIP and then anticipate them replicating that going forward. However, as FIP is to ERA, theoretically xwOBA could be to wOBA – it considers elements potentially more indicative of skill while cutting out some noise, and thus could predict wOBA going forward better than actual past wOBA.
We should have something else to compare it to though, mostly for fun. We could compare it to past projections here at FanGraphs, but that sounds like a great deal of additional work for me that I would not know where to start with, so let’s conduct an experiment by producing a simple model that describes, but does not attempt to project, batter wOBA.
For Comparison to xwOBA: Our (Very Simple) Model
I constructed a quick linear model using all batter data from 2015-2017.
I saw, from Part 1, that three of the most reliable batter statistics we looked at were K%, BB%, and Barrel%. Therefore, I used batter K%, BB%, and Barrel% to describe wOBA in a linear model weighted by the number of plate appearances each batter had. (When we later test the predictive capabilities of Our Model, we will benefit from Statcast here by being able to look at barrels instead of home runs, as barrels appear to be more trustworthy than actual home runs.)
After rounding the coefficients, that gave me the following equation:
wOBA = 0.309 – 0.36*K% + 0.45*BB% + 1.24*Barrel%
or
wOBA = 0.309 + (-0.36*K + 0.45*BB + 1.24*Barrels)/PA
Unlike xwOBA, Our Model ignores the well over 90% of batted balls that are not barrels. Our Model also ignores the specifics of how each barrel is hit, unlike xwOBA. Not all barrels are created equal. For example, for barreled balls hit at a launch angle of 28 degrees, a 102 mph exit velocity has produced home runs on about 3 out of every 4 batted balls, while at 112 mph there have been 100% home runs.
These details undoubtedly matter for estimating past results – Our Model should be easily worse than xwOBA in that respect. But how will this impact predictive capabilities? Will Our Model’s lack of knowledge of what happens in about two-thirds of all batter plate appearances significantly worsen predictive qualities, or will it cut out the noise to the point that predictive qualities improve?
wOBA vs. xwOBA vs. Our Model
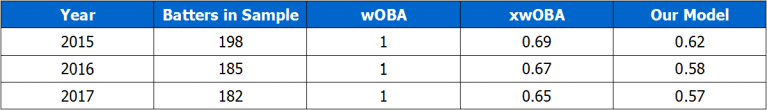
Naturally, to find out, let’s go to some tables. First, how do the models describe wOBA in a full season and at the 2-month level? (i.e. What is the R² between 2015 wOBA and 2015 xwOBA? Or between Apr-May 2015 wOBA and Apr-May 2015 for Our Model? And so on…)
R² of Models Describing wOBA – Full Year
R² of Models Describing wOBA – First Two Months of Season Only
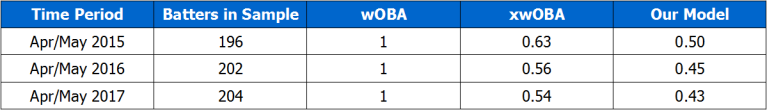
^using batters with min. 300 batted balls for full years and 100 batted balls for two month periods.
Of course wOBA perfectly describes itself. No other model can beat that! As was assumed, xwOBA is clearly a tier above Our Model in terms of descriptive capabilities.
xwOBA loses to wOBA because, for example, xwOBA doesn’t know when the defense made or did not make a play; when a ball that might have cleared the fence on an average day was actually blown in by the wind and caught; or whether a lumbering lefty pulled yet another hard-hit grounder straight into the shift.
Our Model, in turn, loses to xwOBA, because it leaves out the same things as xwOBA plus it knows nothing about whether a liner, a pop up, or whatever else was hit on the vast majority of batted balls. Still, Our Model is not way less successful.
Finally, on to the most interesting part: predictive capabilities.
People have been comparing batter xwOBA to wOBA when discussing breakout or slumping hitters and whether or not they may continue to succeed or fail. To test the appropriateness of this, let’s see how well our three batting value models (wOBA, xwOBA, and Our Model) predict future batting value (future wOBA) on a “year-to-year” and a “pre-June 1st to June 1st onward” basis.
R² Between One Year of Models and the Following Year’s wOBA

^Same sample as in Part 1: Batters with min. 300 batted balls in both years being compared.
At the year-to-year level, none of these metrics are magic at predicting future wOBA. It is not clear from this fairly simplistic analysis whether one year’s wOBA or xwOBA will tell you more about the next year’s wOBA. Our Model may be the worst (well, it at least did a poor job 2016-2017).
R² Between Models Pre-June 1st and wOBA June 1st Onward

^Same sample as in Part 1: Batters with min. 100 batted balls before June 1st and 200 batted balls from June 1st onward.
In our smaller in-season sample, there is a difference. It appears using wOBA from the first two months of a season to predict rest of season wOBA is the worst idea out of the three.
It also appears that using xwOBA or Our Model from the first two months of a season to predict rest of season wOBA isn’t really any different, despite Our Model ignoring so much information! (I’m not going to say Our Model is better, because this is fairly imprecise analysis and the R² values are very similar.)
Conclusions
Similar to the lessons of FIP for pitchers, we can see how leaving out large amounts of data can be appropriate when you have not figured out how to use it effectively yet. Even though wOBA itself clearly benefits from feeling the impact of certain reliable things that are ignored by the other models we examined, such as a batter outperforming their quality of contact due to playing in a hitter’s park or being fast, xwOBA and Our Model cut out other elements that muddy the data in small samples to make up for missing that info.
However, neither xwOBA nor Our Model is built to be projections of future performance. I already linked to this Tom Tango tweet in Part 1, which says that the minimum condition to make a statistic predictive is to weight it by the number of trials, which for batters here we could use plate appearances. In a simple form, this would consist of a model that incrementally adjusts the expectations for a batter to be based more on their tracked performance and less on the league average rate as more data (i.e. plate appearances) for that batter become available.
One can see how you could go about using Statcast data to build a projection system for wOBA on batted balls. For example, one could project the rate of barrels hit based more on a batter’s past barrel rate than the league average rate even in a relatively small number of PA, while one would have to heavily regress the projected rate of flares and burners a batter would hit toward the league average rate.
We have a number of projection systems available at FanGraphs that are great and constantly updated. Using Statcast data is attractive, but it is all very new, so we need to wait a bit longer before we see a similar Statcast-based projection system. Also, we probably simply need more years of Statcast data before we can be too confident in any such projection system regardless.
If you want your batter analysis to benefit from Statcast data in the meantime, maybe check out how a batter’s barrels per plate appearance have changed. Have they gone from about average to well-above average? Their ability to hit for power may have legitimately changed. (Speaking of which, this Mookie Betts power surge is crazy. 2015 to 2017 Barrel% = 4.2%. This year through July 7th: 11.9%!!!)
Enjoy xwOBA and what it does, but be careful using it to adjust your future expectations for players without diving deeper or relying on the powerful information we already have.
Liam Stevenson is an engineering grad who would love to somehow turn his baseball obsession into a day job.
{clap clap clap}
I live-tweeted it here: https://twitter.com/tangotiger/status/1020351537632169984
^re: Tom’s tweet thread above, I’m not sure exactly what happened, but I can only see the full thing via the link below:
https://twitter.com/tangotiger/status/1020365435563315201
Thanks again to Tom for the feedback and discussion!
I can’t find the article, but last year someone showed that base running skills have a substantial influence on xwOBA versus wOBA. I.e. Billy Hamilton will consistently outperform his xwOBA and Kendrys Morales will consistently underperform. Thus, wxOBA is biased and won’t converge to wOBA in the limit of infinite data. This hinders xwOBA in the predictive comparison versus wOBA. If you can figure out a clever way to control for the covariate, you’d have a better predictor.
This is definitely true. Baseball Savant hosts Statcast sprint speed data, but not in an easily downloadable/workable format, as far as I am aware.
In the absence of that, I would imagine using Speed Score or FanGraph’s Baserunning Runs would somewhat help in this respect.
IN addition to a speed factor, xwOBA also badly needs a ballpark adjustment. Pretty clearly you are getting wildly different outcomes for some batted balls depending on ballpark. Chase Field is 407′ to center which isn’t far off the MLB average but has a 25′ tall wall so a drive to CF gets pretty different outcomes there vs other parks – it turns some HR into doubles/triples. Fenway turns a lot of warning track flyball outs to LF into doubles and a few drives right down the RF line into HR that would be doubles/triples elsewhere. Balls at Coors simply will fly farther and generally produce better results than Statcast would predict because of the altitude.
Then there is the issue of foul balls. Oakland turns a lot of foul pop-ups into outs that are simply out of play at most ballparks. So you have batted balls that count against you in Oakland that aren’t even counted in other ballparks. They just don’t even exist elsewhere as far as xwOBA is concerned.
Appreciate the piece BTW
Re: park adjustment – I guess it depends on what the goal of xwOBA is. Right now, it tries to show you the typical production on those batted balls in a somewhat context neutral manner… I like that for what it is.
Certainly when it comes to building projections based on this batted ball data, you would need to build in an adjustment for park to your expectation. Like with your Fenway example, for a RHH like Mookie Betts who pulls a lot of balls in the air, you’d project him to overperform on those batted balls going forward, and his projected wOBA would benefit greatly from his home park compared to even other players hitting at Fenway.
I can see that being beneficial over traditional park factors when trying to project players with specific batted ball tendencies who change teams. Like when Stanton went to the Yankees, it seemed to me that he wouldn’t see a big power boost. With his strength, he wasn’t losing warning track flies in Miami like most.
(Relevant Mike Petriello tweet: https://twitter.com/mike_petriello/status/939471848865230848 )
Re: the foul balls, that’s definitely an interesting point. I think you could incorporate it – foul balls in the Baseball Savant data often have exit velocity and launch angle data. There are a few complications with incorporating it I imagine.
First, they haven’t incorporated spray angle into xwOBA at all yet. You wouldn’t want to blanket incorporate all fouls based on their EV and LA (for example, boosting a player’s xwOBA for pulling a bunch of medium line drives 30 degrees foul), so you’d have to start considering spray angle to figure out if the foul balls are close to being in play. Second, extreme angle balls (like pop ups and chopped grounders) aren’t well tracked, so I imagine something like foul pop ups would be even worse.
A basic adjustment for a projection would be to say that Oakland inflates the expected number of pop ups, which is what I understand happens with projection systems today. It feels like there should be a more interesting way to do it with the new data we have, but I’m not sure off the top of my head.
Thanks for the comment and sorry for the super long response, but you got me thinking haha