Author Archive

Exploring Batter xwOBA and its Applications, Part 2

In Part 1, I discussed what batter xwOBA does, what data feeds into it (using Statcast’s quality of contact types, including barrels), and thus what some sources of noise or “batted ball luck” are contained within xwOBA despite what it strips out in terms of defense and park impacts.

Some takeaways to set up Part 2:

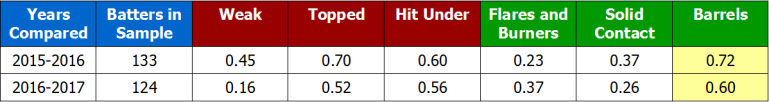
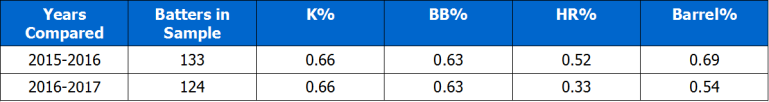
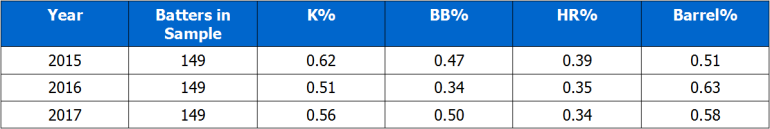
  • Barrel% (AKA barrels per plate appearance) appears to be in a similar range of year-to-year reliability as K% and BB% for batters, while other Statcast quality of contact categories that produce positive results had far worse year-to-year consistency.
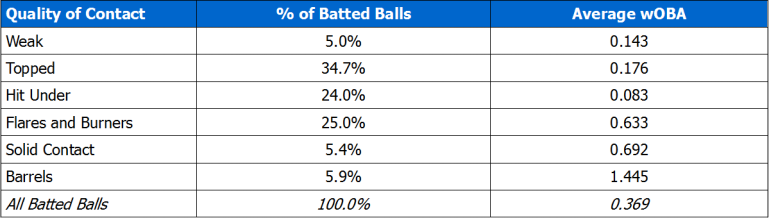
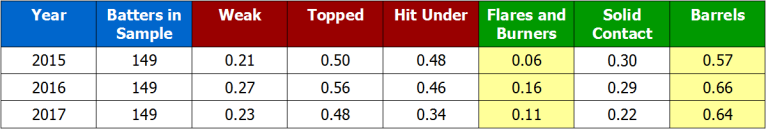
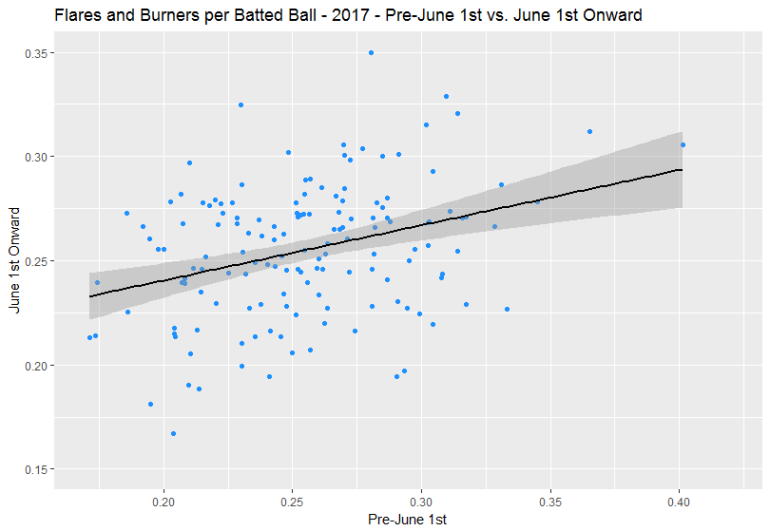
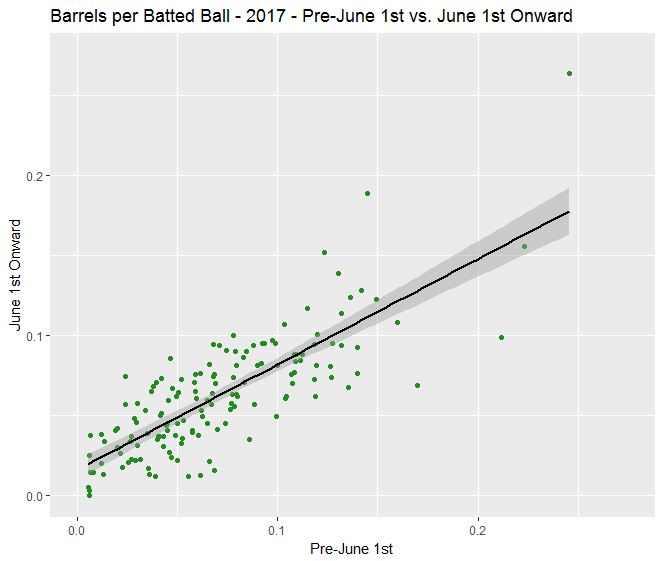
  • When comparing roughly the first third of a season to the rest of a season, it appears that barrels remain one of the more reliable metrics we examined, while “flares and burners,” which are worth a bit less than half the wOBA of a barrel on average, are very unreliable despite making up 25% of all batted balls. Thus, variation in the number of flares and burners a batter hits was identified as a likely source of noise that would still exist in xwOBA. (The same, to a lesser extent, could be said of “solid contact.”)

Now that we understand what feeds into xwOBA better, I want to look at the descriptive and predictive capabilities of xwOBA. To be clear, while xwOBA regresses results on batted balls based on exit velocity and launch angle, it is not a projection of future results / a predictive metric.

The “expected” element refers to what you would have expected a player’s past results to be. In this manner, it is similar to FIP, though FIP is much simpler. And, just like with FIP, you cannot simply look at a player’s FIP and then anticipate them replicating that going forward. However, as FIP is to ERA, theoretically xwOBA could be to wOBA – it considers elements potentially more indicative of skill while cutting out some noise, and thus could predict wOBA going forward better than actual past wOBA.

We should have something else to compare it to though, mostly for fun. We could compare it to past projections here at FanGraphs, but that sounds like a great deal of additional work for me that I would not know where to start with, so let’s conduct an experiment by producing a simple model that describes, but does not attempt to project, batter wOBA.

For Comparison to xwOBA: Our (Very Simple) Model

I constructed a quick linear model using all batter data from 2015-2017.

I saw, from Part 1, that three of the most reliable batter statistics we looked at were K%, BB%, and Barrel%. Therefore, I used batter K%, BB%, and Barrel% to describe wOBA in a linear model weighted by the number of plate appearances each batter had. (When we later test the predictive capabilities of Our Model, we will benefit from Statcast here by being able to look at barrels instead of home runs, as barrels appear to be more trustworthy than actual home runs.)

After rounding the coefficients, that gave me the following equation:

wOBA = 0.309 – 0.36*K% + 0.45*BB% + 1.24*Barrel%

or

wOBA = 0.309 + (-0.36*K + 0.45*BB + 1.24*Barrels)/PA

Unlike xwOBA, Our Model ignores the well over 90% of batted balls that are not barrels. Our Model also ignores the specifics of how each barrel is hit, unlike xwOBA. Not all barrels are created equal. For example, for barreled balls hit at a launch angle of 28 degrees, a 102 mph exit velocity has produced home runs on about 3 out of every 4 batted balls, while at 112 mph there have been 100% home runs.

These details undoubtedly matter for estimating past results – Our Model should be easily worse than xwOBA in that respect. But how will this impact predictive capabilities? Will Our Model’s lack of knowledge of what happens in about two-thirds of all batter plate appearances significantly worsen predictive qualities, or will it cut out the noise to the point that predictive qualities improve?

wOBA vs. xwOBA vs. Our Model

Naturally, to find out, let’s go to some tables. First, how do the models describe wOBA in a full season and at the 2-month level? (i.e. What is the R² between 2015 wOBA and 2015 xwOBA? Or between Apr-May 2015 wOBA and Apr-May 2015 for Our Model? And so on…)

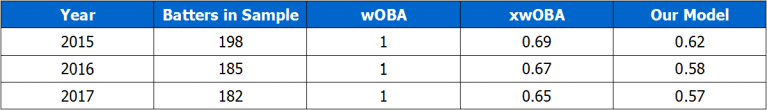
R² of Models Describing wOBA – Full Year

Table 6 - Models - Descriptive capabilities - full year

R² of Models Describing wOBA – First Two Months of Season Only

Table 7 - Models - Descriptive capabilities - two month period

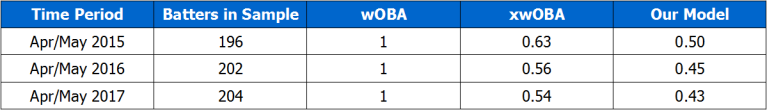
^using batters with min. 300 batted balls for full years and 100 batted balls for two month periods.

Of course wOBA perfectly describes itself. No other model can beat that! As was assumed, xwOBA is clearly a tier above Our Model in terms of descriptive capabilities.

xwOBA loses to wOBA because, for example, xwOBA doesn’t know when the defense made or did not make a play; when a ball that might have cleared the fence on an average day was actually blown in by the wind and caught; or whether a lumbering lefty pulled yet another hard-hit grounder straight into the shift.

Our Model, in turn, loses to xwOBA, because it leaves out the same things as xwOBA plus it knows nothing about whether a liner, a pop up, or whatever else was hit on the vast majority of batted balls. Still, Our Model is not way less successful.

Finally, on to the most interesting part: predictive capabilities.

People have been comparing batter xwOBA to wOBA when discussing breakout or slumping hitters and whether or not they may continue to succeed or fail. To test the appropriateness of this, let’s see how well our three batting value models (wOBA, xwOBA, and Our Model) predict future batting value (future wOBA) on a “year-to-year” and a “pre-June 1st to June 1st onward” basis.

R² Between One Year of Models and the Following Year’s wOBA

Table 8 - Models - Predictive capabilities - year to year

^Same sample as in Part 1: Batters with min. 300 batted balls in both years being compared.

At the year-to-year level, none of these metrics are magic at predicting future wOBA. It is not clear from this fairly simplistic analysis whether one year’s wOBA or xwOBA will tell you more about the next year’s wOBA. Our Model may be the worst (well, it at least did a poor job 2016-2017).

R² Between Models Pre-June 1st and wOBA June 1st Onward

Table 9 - Models - Predictive capabilities - Pre June 1st to ROS

^Same sample as in Part 1: Batters with min. 100 batted balls before June 1st and 200 batted balls from June 1st onward.

In our smaller in-season sample, there is a difference. It appears using wOBA from the first two months of a season to predict rest of season wOBA is the worst idea out of the three.

It also appears that using xwOBA or Our Model from the first two months of a season to predict rest of season wOBA isn’t really any different, despite Our Model ignoring so much information! (I’m not going to say Our Model is better, because this is fairly imprecise analysis and the R² values are very similar.)

Conclusions

Similar to the lessons of FIP for pitchers, we can see how leaving out large amounts of data can be appropriate when you have not figured out how to use it effectively yet. Even though wOBA itself clearly benefits from feeling the impact of certain reliable things that are ignored by the other models we examined, such as a batter outperforming their quality of contact due to playing in a hitter’s park or being fast, xwOBA and Our Model cut out other elements that muddy the data in small samples to make up for missing that info.

However, neither xwOBA nor Our Model is built to be projections of future performance. I already linked to this Tom Tango tweet in Part 1, which says that the minimum condition to make a statistic predictive is to weight it by the number of trials, which for batters here we could use plate appearances. In a simple form, this would consist of a model that incrementally adjusts the expectations for a batter to be based more on their tracked performance and less on the league average rate as more data (i.e. plate appearances) for that batter become available.

One can see how you could go about using Statcast data to build a projection system for wOBA on batted balls. For example, one could project the rate of barrels hit based more on a batter’s past barrel rate than the league average rate even in a relatively small number of PA, while one would have to heavily regress the projected rate of flares and burners a batter would hit toward the league average rate.

We have a number of projection systems available at FanGraphs that are great and constantly updated. Using Statcast data is attractive, but it is all very new, so we need to wait a bit longer before we see a similar Statcast-based projection system. Also, we probably simply need more years of Statcast data before we can be too confident in any such projection system regardless.

If you want your batter analysis to benefit from Statcast data in the meantime, maybe check out how a batter’s barrels per plate appearance have changed. Have they gone from about average to well-above average? Their ability to hit for power may have legitimately changed. (Speaking of which, this Mookie Betts power surge is crazy. 2015 to 2017 Barrel% = 4.2%. This year through July 7th: 11.9%!!!)

Enjoy xwOBA and what it does, but be careful using it to adjust your future expectations for players without diving deeper or relying on the powerful information we already have.


Exploring Batter xwOBA and its Applications, Part 1

We are around the halfway point of the fourth season for which we have had Statcast data. One of the primary metrics created with Statcast data, introduced on the excellent Baseball Savant, is xwOBA (expected weighted on-base average), which I have noticed being adopted more for public analysis, including at this site.

The primary component of xwOBA is a statistical model that estimates the wOBA that each batted ball is expected to have produced based on its exit velocity and launch angle. In addition, actual strikeouts, walks, and times hit by a pitch are added in, as it is done in the normal wOBA formula.

There have been some explorations this year into the potential for predictive value added by xwOBA for pitchers, by Craig Edwards and Jonathan Judge, and batters, by Tom Tango and recent major leaguer Nate Freiman.

The pieces related to pitchers indicate what we would expect from our traditional DIPS principles: there is little evidence that pitchers have enough control over their results on balls in play to make including balls in play particularly worthwhile. For batter xwOBA, the pieces by Tom Tango and Nate Freiman serve as good jumping off points for a deeper dive, which is what I would like to present here (now that I’m finally done dragging my feet on writing this for a couple of months).

There is nothing too crazy presented here – think of this as a PSA on what batter xwOBA does, what goes into it, and why it is more of a stepping stone to future Statcast-based predictive metrics than something you should apply in a forward-looking manner today.

What does xwOBA do and what does that mean?

At the beginning of the article, I introduced the primary component of xwOBA as a statistical model that estimates wOBA for batted balls based on their exit velocity and launch angle. This more or less regresses the results of all batted balls to the mean wOBA we would expect of them without impact from or knowledge of the defense or park in which they were hit. In this way, it strips out a form of what could be called “BABIP luck” or “batted ball luck” that is associated with those things it does not include.

This is potentially powerful for predicting future performance, though it is not a predictive metric. In the case of batters, we know that they have substantially more control over their batted ball results than pitchers, generating a much wider range of BABIP and HR/FB% on a year-to-year or career basis than pitchers. Therefore, including analysis of balls in play for batters makes much more sense than for pitchers, which batter xwOBA could help to do.

However, while I have been seeing xwOBA regularly used to comment on early season breakouts or slumps, I have not come across a close look under the hood of batter xwOBA to both test its possible predictive capabilities and identify what sources of noise or “batted ball luck” it leaves in. Let’s see what we can find out.

What goes into xwOBA?

Statcast Quality of Contact Categories

To start, I decided to use some of the new “quality of contact” categories that the Statcast crew have defined. You’ve probably heard of barrels, the category that produces the highest wOBA (1.445, according to my calculations*), consisting generally of very hard hit fly balls and high line drives. It’s also the category seemingly most indicative of skill and thus signal amidst the noise, which is why it is the only one regularly used so far. The other five categories do contribute to xwOBA though, so let’s look at a quick summary of them.

*most of the numbers I use in here will be based on what I calculated using R from 2015-2017 Baseball Savant data, which may differ very slightly for a variety of reasons from what you see elsewhere – including, most likely, my personal failures. 

Statcast Quality of Contact Type Summary (2015-2017 data)

Table 1 - Quality of Contact Summary

Some of those names are more self-explanatory than others – if you would like to know more specifics, here is a Tom Tango blog post explaining them as well as providing some visualizations to help.

Aside from the specifics of what each of the six quality of contact types refer to, the takeaway should be this: While barrels contribute the highest wOBA on average and are most representative of skill, well over 90% of batted balls are not barrels. Expected results on these non-barreled balls are still fed into the xwOBA model. For batters, how much less indicative of skill are these other batted balls? And if they are less indicative of skill, are they useful to include?

First, let’s simply look at how each quality of contact type correlates year-to-year. Unfortunately, we only have three full seasons of data to compare, but let’s do what we can. For players with at least 300 batted balls in each year, I calculated the year-to-year R² value for the rate at which players hit each quality of contact type. (e.g. 2015 Barrels/batted ball to 2016 Barrels/bb)

Year-to-Year R² of Statcast Quality of Contact Types

Table 2 - Year to year correlations for Quality of Contact types

^Red denotes categories that produce poor batting results, green denotes good batting results

From the above table, we can get a sense of why the Statcast crew has focused on barrels – they are the only quality of contact type that produces both above average results and quite a bit of year-to-year reliability. Balls categorized as “topped” or “hit under” appear to approach barrels in reliability, but are worth very little. The “flares and burners” and “solid contact” categories produce close to half the value of barrels, but are far less reliable on a year-to-year basis.

For comparison, below are the year-to-year R² values for a few other things for the same set of hitters. Each of these metrics refer to the number of occurrences of that event per plate appearance.

Year-to-Year R² of Some “per PA” Metrics

Table 3 - Year to year correlations for other plate appearance metrics

This is pretty cool to me. Barrels per plate appearance or per batted ball seem to be in at least the same vicinity of year-to-year reliability as K% and BB%, which are two of the most important simple analysis tools out there for hitters. Barrel% is also a distinctive step above HR% in both sets of years compared.

But, what I really wanted to test going into this was smaller sample reliability, given the usage of xwOBA in so many early season articles.

In the following tables are R² values for the same quality of contact and per PA metrics we have discussed so far, but instead of looking at year-to-year R², we are testing the relationship between roughly the first third of a season (before June 1st) and the final two thirds of a season (June 1st onward).

R² Comparing Pre-June 1st to June 1st Onward – Statcast Quality of Contact Types

Table 4 - Pre and post June 1st correlations for Quality of Contact types

R² Comparing Pre-June 1st to June 1st Onward – Some “per PA” Metrics

Table 5 - Pre and post June 1st correlations for other PA metrics

Note: I simply proportionally adjusted my batted ball minimums for batters in this sample (batters with min. 100 bb before June 1st and min. 200 bb from June 1st onward), weirdly producing 149 batters in each year…

In general, of course, these R² values are a bit worse than the year-to-year ones. Strikeouts and barrels look the best here, with the next tier probably being topped, hit under, and walks.

What struck me most was something I figured I would find here: flares and burners take a significant hit in this smaller sample. How many flares and burners a player hits through a couple of months tells you very little about how many they will hit for the rest of the season.

To help visualize this, below are two graphs from the 2017 “pre-June 1st to June 1st onward” comparison: flares and burners per batted ball (R² = 0.11) and barrels per batted ball (R² = 0.64).

plot_2017_FlaresandBurners

plot_2017_Barrels

There is no doubt here that barrels are more indicative of a repeatable skill in partial season samples than flares and burners. (I want to say thanks to Aaron Judge for stretching out the barrels graph, by the way.)

This is why, earlier in the article, I said that xwOBA only strips out certain types of batted ball luck. In a small sample, players could hit some extra soft line drives, hard ground balls, or bloop singles instead of cans of corn or weak grounders, causing them to have an uncharacteristically high wOBA and xwOBA. Our analysis to this point deems knowing about those flares and burners to be not very useful for assessing a batter’s future results partway through a season.

But how much of an impact could that possibly have? Well, I calculated that flares and burners produced a .633 wOBA from 2015-2017 while making up about a quarter of all batted balls. According to FanGraphs, the highest wOBA ever recorded in a qualified batting season was .598 by Babe Ruth in 1920.

So yes, I think that lucking into some extra peak Babe Ruth plate appearances could have a relevant impact on a batter’s small sample xwOBA.

Up next

We have covered a lot so far, so I will break things here. In Part 2, we will look at a similar analysis on wOBA and xwOBA themselves, see if we can create a more simplistic metric than xwOBA that is comparably predictive in small samples, and discuss how the Statcast crew is likely working to create predictive metrics based on Statcast data (since that’s not what xwOBA is, making this analysis pretty unfair to them!).