Archive for Uncategorized

The Athletics Traded for Blake Treinen and Built a Dominate Reliever

Last July when the Oakland Athletics traded for Blake Treinen, Jesus Luzardo, and Sheldon Neuse, providing the Washington Nationals the services of relievers Sean Doolittle and Ryan Madson, the Athletics trade was more notably about the prospects of Luzardo’s pitching and Neuse at third base. The Athletics are in the middle of a definitive rebuild; outside of the Athletics organization, the Treinen piece of the trade was simply for his services as a simple bullpen body to hit average (hopefully) and pander on through the remnant of the season as Doolittle and Madson’s replacement.

Contextually, when the trade occurred last July, Treinen was 28 and hitting his ceiling in the Nationals development methodology. He lost hit job in April of 2017 then slowly settled into an awful 5.73 ERA with 48 allowed hits in the first half. There is no magical analytic which explains why he was bad, no pedantically bad situational deterioration – Treinen was simply bad.

Specifically, Treinen was bland on his first pitch (which is a telling sign of a pitcher struggling), lofting sweet, contact worthy pitches to the upper zone. Overall, batters swung and made contact throughout his first-pitch zones. Hence, the same area that created his bizarre downward trend was the first area where Treinen began his 2018 correction. He has cut high zone pitches on the first-pitch count, aptly cutting contact to the high zone. Batters are attacking his first pitch less, taking (or trying to take) a more principled approach to seeing him out.

The batting delay has created Treinen’s most formidable analytical point: the second highest and lowest qualified-reliever swinging strike rate and ERA at 18.8 percent and .93, respectively.

Any improvement this stark demands a resurgence across all pitching categories. First, Treinen has begun to shift his fastball placement. In 2017, on a micro fastball scale, Treinen offered either the fastball outside (44 percent balls) or distinctly inside (76.1 percent contact), failing to hit the lateral sides of the inside zone. That crisp distinctness allowed batters to perceive where his fastball was going to land, allowing a 156 wRC+. In 2018, he has avoided letting the fastball fall distinctly outside of the zone (30 percent balls, 72.7 percent contact), thus offering more variety within more controlled movement. His fastball has kept batters to a negative 20 wRC+.

When batters have been contacting his fastball, they have a 47.1 percent fly-ball rate. Perceptually, this is an alarming rate, less that placement becomes intrinsically important. In a string of reactions, Treinen is enforcing a greater chase rate (38.7 percent, increase from 30.8 percent) while decreasing his chase contact rate from 52.2 to 38.6 percent. This has cut the ability of batters to find barrel contact (2.1 percent), thus cutting his opposite field hit-rate to 19.8 percent. In short, Treinen is deriving contact that is easy to field.

Hypothetically, this might be a philosophical adjunct to the Athletics analytic mantra. The team is shifting on 30.4 percent of left-handed batters, an increase from 17.1 percent last season with the Washington Nationals. Neither team shift at a dramatic rate, but there is a slight difference between the Nationals fielding chart and the Athletics fielding chart behind Treinen. The slight difference may not be the main reason, but the Athletics awareness of how to help Treinen with more movement is, at minimum, an interesting note.

However, for all the jovial notation Treinen’s fastball is receiving, his main-pitch, the sinker, deserves even more praise. He has kept batters to a .200 average, already hitting 17 strikeouts on the sinker for a 56 wRC+. Much like the fastball, the sinker is moving less, but in a crisper fashion (9.7 rating down from 11.9). On a meta point, Treinen is simply more confident and educated in his pitching approach – on a simple eye-test, he is perceptually prepared where to throw. Scrupulous timing and more variety in placement of his sinker has lowered contact to 71.1 percent (was an egregious 86.2 percent last season). The one data-point which fundamentally incorporates how good his sinker has been is the increase in outside swing percentage (43 percent) while decreasing outside-contact (52.1 percent).

In short, pitches that were not meant to be hit, were being hit in 2018, and Treinen has prevented that from occurring. Fundamentally, this is on the breadth of a slight mechanical edit observable with a release point grouping to the right. In the example provided, between 2017 and 2018, Treinen is releasing his pitches with more elevation, signifying a change to his release philosophy.

The Athletics somehow have tapped into Treinen to bring out the best of him; the only question they have to answer is whether he is trade-bait or a long-term staple to the bullpen.


Josh Tomlin Is Having the Worst Pitching Season in Major League History

Earlier this year, when my Clevelanders were facing the North Siders of Chicago, Josh Tomlin was facing off against noted walker Tyler Chatwood. I wondered aloud whether Tomlin would allow more homers, or Chatwood would allow more walks. Of course, this was mostly a joke. Walks are more common than homers, and so Chatwood, the worst (best?) walker in baseball, would walk more than Tomlin would allow home runs. Naturally, I made a comical bet with a Cubs fan friend of mine, and in the end, I scraped by: Chatwood would allow five walks, while Tomlin allowed a mere four dingers. How could it even have been that close?

Now I’m not here to trash Tomlin, or Josh as his family may call him. In fact, I feel for him. We humans have times of joy and times of suffering. And hey, Josh Tomlin is a very good pitcher, all things considered. He throws harder and more accurately than literally anyone I know personally. Even for an MLB pitcher, Tomlin has always been accurate. The problem is his opponents’ bats have been even more accurate.

There has been a trend going around in which people determine whether or not certain facts are “fun.” Some say a fact is fun if it limits the amount of qualifiers. Others believe it’s a fun fact if the reader cannot help but say wow in response. I think a notable omission is the consideration whom the fact is fun for. The following is fun for batters facing Josh Tomlin:

There have been 25,185 pitcher seasons since 1901 (min. 40IP).  Tomlin’s 2018 FIP is currently 8.26, which puts him in…25,185th place. Do you prefer league-adjusted stats? Tomlin’s FIP- is 199, 99% worse than average, and also the worst of all time. Maybe you think it’s unfair to use FIP, or even FIP- historically. After all, as you know, home runs are being hit at an all-time pace over the last 3+ years, so it’s not fair to look at Tomlin’s home run allowance on a historical level.

Let’s just look at this year. If you sort the FanGraphs leaderboards by HR/9, and set the minimum innings pitched to 40IP, you’ll find Tomlin right there at the top with 3.88. Without context, we can already surmise that this is an astronomical number. The average MLB pitcher is walking 3.28 batters per 9 innings–Tomlin is allowing .6 more homers per nine than the average pitcher walks per nine! But I think my favorite way of looking at this is the Jeff Sullivan special. Sitting in second in HR/9 is Wilmer Font with 2.45. The difference between Tomlin and Font is the same as the difference between Font and 128th worst Jon Lester. Josh Tomlin has been unthinkably bad at limiting home runs–he’s fourth in home runs allowed, and every single pitcher in the top ten has thrown double the amount of innings.

Even when he was a successful pitcher, Josh Tomlin had a home run problem. But he was able to make up for that by limiting walks with Kershawian skill, and miss just enough bats to scrape by some successful seasons. In 2018, his velocity has held steady, as have his contact and swing percentages. He’s walking a few more, and striking out a few less, but for whatever reason, when batters make contact this year, they aren’t missing. His barrel rate is 13%, and his Statcast xStats are even higher than his actual stats. Pitch values show that his secondary offerings have taken a major turn for the worse, but I don’t see why that’s the case. Maybe there are things we have yet to understand about baseball. More likely, maybe there are things I have yet to understand about baseball.

Tomlin is having the most terrible season of all of the terrible seasons. Maybe there’s some regression there, but even with positive movement, it’s certainly a mean to which one doesn’t hope to regress. The last piece of this regards his employers, the Baseball Club of Cleveland. The Indians are looking to make a run at the postseason this year, a run which many have considered to be all but a guarantee, considering the shambles of the AL Central. Perhaps Tomlin gets opportunities because it’s a foregone conclusion that Cleveland makes the playoffs safely, and the front office would rather not have a more instrumental piece of the Indians bullpen pitch in low-leverage situations, lest they become injured. But, one would think there is value in finding new arms, so that when the calendar reads October, Cleveland has more options out of the bullpen.

Even if this is not the case, it seems to this author that marching Tomlin out there makes manager Terry Francona look clueless, the front office careless, and Tomlin helpless. But most of all, the fans of the ball club deserve better.


Fine-tuning the Swing Based Upon Statcast Data

In this article I have researched the relationship between Batted ball direction and production. I found out that air balls are more effective if they are pulled than hit to center but especially hit the other way. That can be already seen on liners a little bit but especially on fly balls which are very dependent on batted ball direction.

However the downside is that pulling actually suppresses LA, especially low in the zone because you will roll over and topspin more balls when you try to pull them. I broke this down in this table LA by hit direction and zone

This shows that you can only pull certain pitches consistently unless you have a special talent. Generally the more down and away the harder to pull it off the ground and the more up and in the easier.

In this article  https://www.fangraphs.com/community/why-launch-angle-can-only-be-optimized-not-maximized/ I showed that most top hitters average around 12-18 degrees. That is interesting because the most productive LAs are around 25 degrees if struck perfectly. However this is only true if you strike the ball perfectly and also while batted balls are distributed more like a bell curve (looks different because it is a cumulative curve) around the median as Tom Tango shows here batted ball distribution the production really isn’t as production increases on a slower slope towards 30 degrees than it drops off after it. That means you want to shift more batted balls into that good 10-30 window even if this means losing some of the great 25-30 balls.

And also ideal production in relation to LA is not the same depending on batted ball direction.
production based on direction . You can see that pulled balls have the highest wOBA at 20-35 degrees, balls to center are best at 10-25 and oppo best at 5-20. Unfortunately the batted ball trend is exactly vice versa, as the LA on pulled balls is only around 5 degrees for the league vs 20 for oppo. That means you don’t need to spend much effort on lifting oppo balls as well as high pitches https://www.fangraphs.com/community/effect-of-pitch-selection-on-launch-angle-and-exit-velocity/

The goal of a hitter should be finding pitch locations that he can pull in the air which is also highlighted in the above linked article. Also the hitter should avoid rolling over into grounders by not pulling balls that he can’t pull (by either taking them or hitting them to other fields) and lastly he should try to avoid too high LAs on balls hit the other way.

But priority is clearly first to avoid the grounder, especially to the pull side as this ist he worst batted ball type, then secondly to try to pull the air ball (but this comes clearly second to avoiding the grounder) and lastly there is avoiding high LAs on oppo balls.

For this I suggested this chart in my prior article optimized batted ball direction by zone. It suggests to pull inside pitches and also high middle pitches which are easy to lift. It also suggests that low middle pitches are hit up the middle to get them off the ground and unsurprisingly low and away pitches hit the other way. This is pretty much conventional wisdom except turning on the high middle pitch. Where my optimized approach differs from „hitting where it is pitched“ is that it suggests hitting higher (and middle high) outside balls more up the middle or maybe very slightly to oppo than really to the outer third of the field. This is to push the LA down a little from the 25 degrees that high outside pitches hit to oppo yield.

To summarize this so far we have:

*Hit the ball where it is pitched except for the high middle pitch that should be hooked to pull field and the high outside pitch which should be hit more middle to oppo gap rather than straight oppo.

*Try to shrink the zone a little on the low outside (bad launch angle and absolutely not pull-able) and very up and in pitches (suppresses EV and could cause pop ups and whiffs).

*Ff you are a pull/FB hitter try to polarize your swinging a little toward the zones in which you can elevate to pull field.

Of course there is more to it. Some guys like Bautista made a living out of pulling balls in the air and other guys like Trout or JD Martinez are able to pull the ball but actually have slightly below average pull rates and have mentioned that their default approach is fastball center to oppo gap and then react in on inside pitches and some off-speed stuff. This has advantages too since the little deeper FB contact means you have a little more room out front if you are fooled on the breaking stuff. This approach sacrifices a little bit of power but maybe prevents more rolled over grounders, helps BABIP a little and of course Trout and JDM are strong enough to hit it out to the middle oft he field.

In contrast to that hitters like Brian Dozier need to pull the ball to do damage in the air. Dozier with his extreme pull/FB approach thus gets more out of his raw power than Trout and JDM but he does pay a BABIP price because he does polarize his z-swing Dozier heat map but still will pull some non pull-able pitches leading to pulled grounders despite his overall low GB rate.


What’s Wrong with Gary Sanchez?

To the shock of many around baseball, “The Kraken” has been tamed so far in 2018. Before hitting the shelf with a groin injury in late June, Gary Sanchez had been in the midst of an extended scuffle at the plate. While often at the forefront of critique for his lackluster defensive showing down the stretch in 2017, Sanchez’s offensive struggles have dumbfounded many in the baseball industry. After a historically dominant multiple-month power surge in his 2016 rookie season, Sanchez backed it up with an outstanding 2017 season, to the tune of a .278/.345/.531 line, and he clobbered 33 HR, despite only playing in 122 games due to injury. Sanchez also carried an elite .253 ISO and 130 wRC+ last season, which makes his struggles in this campaign all the more shocking. 2018 has been a disaster of a season so far for Sánchez; he’s slashing .190/.291/.433, accompanied by a decline in his HR/FB% from his stellar career average of 26.1% to 18.4%. Boasting a disappointing 97 wRC+ and .313 WOBA before the injury, Gary Sanchez has largely spent his season searching for answers.

When addressing a player’s stat-line it’s imperative to look at the big picture: Sánchez’s K% is slightly higher in 2018 (23.8%) than 2017 (22.9%), as one might expect from a large decrease in batting average, but this 3.93 % increase in K% doesn’t explain anything as astronomical as an 88-point Batting Average drop-off. Sanchez’s BABIP (Batting Average on Balls in Play) is unsustainably low, currently sitting at .194, despite has career average of .278. While BABIP is dependent on many variables, such as Exit Velocity, Launch Angle Composition, Hang Time, Type of Hit, Defensive Shifts, etc, much of the short-run variance of the metric can be attributed to chance. While Sanchez’s outputs for many of main variables have veered off par from the past in 2018, none of these changes should account for anything close to a 30.2% lower BABIP than what his career average is. Further evidencing the misfortune that has slandered Sanchez’s numbers is that the backstop is carrying an xwOBA of .368, still well above the MLB average of .317 in this category. Some of the Gary Sanchez extended slump can definitely be attributed to horrific luck. His Average Exit Velocity has undergone an insignificant 0.55% decrease— nothing to be too concerned with. However, I was alarmed by seeing that his Average Launch Angle is up from 13.2 degrees in ‘17 to 15.3 degrees this season, given his previously historic HR/FB rates, so I delved its composition.

The problem isn’t so much that Gary has seen his average Launch Angle rise, it’s that his launch angle has been all over the place in 2018: it deviates in all different directions from what it’s been the past two seasons. His ideal xwOBA seems to be somewhere in the range between 20 degrees and 35 degrees, but Gary has been hitting at launch angles that have produced poor xwOBAs (both lower and higher than his ideal launch angle range). Gary’s 2017 Launch Angle %/xwOBA reveals that he was hovering around this range with a large percentage of his swings (the 8 most frequent ranges of 5 Degrees for Sanchez’s swings also happened to be his 8 best xwOBAs and they connect to form the territory of the launch angles from 0 degrees through 40 degrees. Gary’s been below Launch Angles of 0 Degrees and above 40 degrees much more frequently this year, with his 45 degree mark (Sanchez hasn’t homered in his career on any swing with a Launch Angle in this range) being his most frequent range (8.1%), up from the 3.2% last season and 5.7% the previous year. The portion of Gary’s struggles in his control shouldn’t be attributed to his higher average Launch Angle, they should be directed to his increase in frequency of connecting outside his optimal range, which is the real difference between his stellar offensive track record and current output.

I was curious how Sanchez’s HR/FB% could be so much lower this season than from the rest of his career, so this Launch Angle dilemma immediately caught my attention. Accompanied by his altered Launch Angle composition has been an increase in FB% (from 36.6% in ‘17 to 45.0% this season) and a decrease in LD% (from 21.1% in ‘17 to 14.2%). Gary’s IFFB% is also way up from 10.8% last season to 21.1% so far in this campaign. Whether it was a conscious decision or not, there isn’t explanation for why this has happened to one of the games premier HR hitters, but it’s resulted in a significant drop off in Sanchez’s HR/FB%, and limited his production across the board.

Another factor in Sanchez’s extended ’18 slump may be his aggressiveness at the plate. While his BB% has jumped from 7.6% to 11.7% since last season, he hasn’t brought the same aggressive mindset into his at-bats, in general. Sanchez has been more tentative with ambushing pitches in 2018, as his 1st Pitch Swing Rate is down from 29.2% to 24.9%, and his overall swing rate (both O-Zone Swing% and Zone Swing% have been lower than last season) is down from 47.9% to 43.8%. For a player of his abilities, Gary Sanchez has some ugly offensive numbers to begin 2018, due to a combination of poor luck, an ill-fated change in his Launch Angle composition, and increased selectivity at the plate.


The Bahr Is Set High for Newly Acquired Rangers Prospect

On a quiet Sunday afternoon earlier in July, the non-contending Texas Rangers made a splash into the trading market, acquiring veteran outfielder Austin Jackson, reliever Cory Gearrin, and prospect Jason Bahr from the Giants, in exchange for cash considerations, or a player to be named later. At first glance, the acquisitions raise eyebrows, as the AL West cellar-dwelling Rangers added big-league talent to a roster that is highly expected to undergo a complete reconstruction at this year’s trade deadline, just over three weeks away.

The move was thought to add Jackson to an up-and-coming squad of outfielders, in a transaction that wouldn’t be conducive to regular playing time for the 31-year-old journeyman. Gearrin was an added bonus in the trade, representing an experienced quality middle-relief option for Jeff Banister, with 1 1/2 years of club control remaining. However, Rangers GM Jon Daniels immediately clarified any controversy over his intent behind the move, stating  “Our primary motivation in the deal was acquiring Jason Bahr. He’s a guy we look at (as) a little bit (of an) undervalued prospect.”

Daniels further emphasized the insignificance of the acquisition of Jackson to the Rangers’ future plans, saying “we’re looking at talking to other clubs about the possibility of a trade. We’re not yet certain when he will report, or if there is potential for a second move.” To even the most intense baseball fans and avid prospect enthusiasts, the name Jason Bahr might not ring a bell, but it’s clear that Daniels envisions a bright enough future for the right-hander that he was willing to take on the spare parts from the Giants. The move appears to be a salary dump for San Francisco, as well as a route to clear playing time for prospects Ray Black and Steven Duggar, who were both called up directly following the announcement of this transaction. The focus of the trade is clearly the 23-year-old Bahr.

Jason Bahr had a roller-coaster ride of a collegiate career at Central Florida, starting out as a Redshirt Freshman, before being given a dearth of innings in his second campaign, and ultimately being cut from the roster in the following season. Bahr was given a new lifeline when UCF underwent coaching staff changes, and he ran with the new opportunity to contribute, notching 98 strikeouts in 60.3 innings, while appearing mostly as a reliever for the Knights. In just one season, Jason Bahr’s professional baseball dreams had gone from a long-shot to reality, as he was selected in the 5th round of the 2017 draft by San Francisco. A lanky 6’5″ right-hander, the Rangers are gambling that Bahr will add some strength to his 190-pound frame as a late-bloomer, but it’d be abnormal for a pitcher to still be growing into his frame in his age-23 season. This move could pay off to be a savvy acquisition by Jon Daniels, as he is essentially buying an undervalued prospect while he is on the rise. A similar deal transpired back in June 2015, when the Diamondbacks shed the $9.5 million salary of Bronson Arroyo to Atlanta by packaging it with young pitching prospect Touki Toussaint, a 19-year-old fireballer who lacked control at the time, in exchange for utility infielder Phil Gosselin. Three years later, Toussaint has developed into one of the games’ top pitching prospects, and is now on the brink of his MLB debut, as the move seems poised to pay off for Atlanta.

Jason Bahr is a project for a Rangers organization that can afford to take a flier on such a raw pitcher. While he generally sits in the low-90s with his heater, Bahr has exhibited the propensity to fire into the mid-to-upper 90s with the pitch as a reliever. In 13 starts for Single-A Augusta, Bahr accumulated a 2.75 ERA/2.93 FIP, backed up by an exemplary 11.53 K/9, ranking him 1st among all qualified SP in Single-A, in addition to a quality 2.75 BB/9, before earning a promotion to San Jose (A+). Bahr continued his dominance with San Jose, earning a 1.69 ERA through three starts, but these numbers are likely skewed by a LOB % of 100 % and an unsustainably low induced BABIP of .209. The chart below chronicles Bahr’s combination of missing bats and avoiding free passes. Out of all 516 MiLB pitchers to throw 60+ IP in 2018, Bahr ranks tied for 15th in K-BB%, a likely reason Daniels was so enticed by his skillset. The white dot shows Bahr’s promising ranking among his peers, in terms of K-BB% and FIP.

With an athletic delivery, Bahr has a high ceiling that is heavily contingent on the improvement of his still-developing secondary offerings. The development of his changeup has lagged behind the curveball’s progress so far, but if Bahr is able to establish one that is even average, giving him three serviceable offerings, he should be able to stick in the back-end of a big-league rotation. Depending on how much Bahr fills out and develops over the next year or two, the Rangers could have anywhere from a middle-leverage reliever to a late-blooming middle-of-the-rotation arm on their hands.


Jon Gray Has a Pitch Strategy Problem

On the eve of July, the month of definitive do or die competition, the Colorado Rockies optioned their opening day starter, Jon Gray, to Triple A Baseball, putting a temporary halt to a season which should have been superlative. Gray was positioned to be the Rockies Ace pitcher, the de facto strike out machine. He did so, posting an MLB fifth best 11.64 K/9 with a WAR of 2.5, breaking most of his projections.

Yet, Gray’s demise and optioning is a reminder that a pitcher’s job, in the end, is to play the averages and get out of situational disaster to end innings with the formidable zero still on the board. Gray was pitiful at cleaning up the base path with a 63.1 percent left-on-base percentage. His 5.77 ERA was slowly flowing up since the beginning of the season. His MLB best 14.33 K/9 for June was met with only 27 innings of pitching, 62.2 percent left-on-base, and an ERA of six. Troubled outings and difficulty finishing starts were trending, not the outlier.

There is an odd note, however, on Gray’s optioning to Triple A. German Marquez, who finished eight innings of one-run pitching in a 3-1 win over the Los Angeles Dodgers last night, has even more developmental problems. Marquez had an even more troublesome June analytically, with an equal 62.2 percent left-on-base, an era of 6.75, a FIP of 5.26, and nine home runs allowed. Hypothetically, there are two reasons the Rockies have decided to option their ‘best’ pitcher instead of the more developmental Marquez. First, the Rockies may be admitting they are going to be sellers at the deadline, and this is the beginning to positioning certain pitchers for sale. However, this would be a very un-Rockies tact to take for a team who has been stubbornly boisterous about ‘competing’. Second, Gray may be more fixable than Marquez, with a quick stint in AAA allowing him to resolve fundamental mechanics away from the stench of scrutiny. (This hypothetical is what the remnant of the article will focus on). Or, it may be a mix of both hypotheticals, with time telling which carries more weight in organizational decisions.

Optioning Gray becomes a matter of establishing finishing touches, helping him to make his strikeouts effective. In a matter of plate discipline, batters are attacking zone pitches 5.8 percent more than last season, back to a career average of 65.8 percent. Yet, he is throwing less to the zone (43.8 percent) while batters are making drastically less contact (80 percent in 2017, 70.2 percent in 2018). All those numbers lead up to a compelling 13.2 swinging-strike percentage and the conclusion Gray ought to be even better than last season when he finished with a 3.67 ERA and a 3.18 FIP.

The pitch arsenal has seen some slight edits, with a cut to fastballs and a rise in slider percentage of five both ways. Velocity has remained mechanically the same, thus, batters should not be exploiting his pitches at this rate. The problem, however, becomes that batters are exploiting this edit by forcing perceptual chaos on Gray, in which he doubles down on throwing distinct pitches with little movement variation.

Gray’s slider placement, on a meta level, has not changed, nor has the contact basis. However, what has dramatically shifted between 2017 and 2018 is how batters are making contact. In 2017, there were three zones which batters had near .100 averages against Gray; in 2018, that rating has gone up to seven, with an egregious .250 to double down on the pain. Strategically, Gray attacks the shadow of the zone with his slider when ahead and moves up to inside the zone when behind. It is not so much a matter of controlling placement but controlling the count and situation.

A false sense of security in the slider has created situational derisiveness on Gray’s fastball. Gray has developed a distinction with his slider as his ‘shadow’ pitch (3.3 PITCHf/x movement rating, down from 5.4) while his fastball is his ‘heart’ pitch (8.7 PITCHf/x movement, down from 11.3). Thus, when in trouble, Gray’s intents become clear, and his fastballs have been straying more inside. The brevity in fastball movement has lead to batters grouping his fastball and hitting at a .172 average from the middle to right, lower portion of the zone.

In short, Gray’s problems result not from mechanical duplicity, but from strategic duplicity – a loss of confidence. Since Gray’s goal is to hit strikeouts, when bases are empty, he has a 13.84 K/9 rating; when runners are on, his K/9 falls to 8.61 while BB/9 raise to 4.19. With runners in scoring position, his FIP takes a jump to 4.94.

Situationally, the flop begins when situational leverage ebbs from low to medium with 96.6 and 61.8 percent left-on-base, respectively. Unfortunately for Gray, his troubles begin regardless of time through the order. He has allowed 21,19, and 21 runs through the first, second, and third time through the order, respectively. The underlying tact of how batters destroy Gray can be seen in slugging at a .390, .485, and .527 percentage through the order.

What can Gray fix in Triple A baseball? In two words, strategical variety. Despite being able to land more strikeouts, Gray has become less effective by staying stuck in a rut, unable (or unwilling) to hide his slider and fastball with movement. Situational aptitude and learning how to pattern his pitches will be essential to turning Gray into an effective strikeout machine.


Relievers who Will Matter in the Second Half

A slump-proof, lockdown bullpen doesn’t just win games. It can effectively end them before they’re over. But relievers are weird. Even when they’re not pooping their pants, they’re probably the most volatile players in all of baseball. They seem to represent only the foremost moment in any given season, making trying to project which ones will be good largely a fool’s errand.

But there is a tool that can help, maybe: SIERA. That’s Skill-Interactive ERA. It’s an ERA estimator like FIP or xFIP, but it’s better because it accounts for more of the noise that can result from batted balls. It also has a stronger correlation to predicting a pitcher’s future ERA.

It’s important to acknowledge that it isn’t an ERA projector, but can inform us of the quality of the skills a pitcher has demonstrated most recently. And now, as the season heats up, and as potential playoff teams show more urgency, and we’re in the foremost moment the season has to offer, we can use SIERA to see which of baseball’s oddest bunch could offer big benefits in the second half. Let’s dig in.

Juan Nicasio currently has a SIERA of 2.49. His ERA is a flat 6.00 through 34 appearances. Because SIERA is best used as a starting point for evaluating a player, the disparity between his results versus how he’s actually pitched pushes us to look further. One thing that jumps out is his strand rate, which stands at a homely 53.3%. That’s 20% worse than league average for relievers. It’s probably fueled by a .396 BABIP which is a whole hundred points worse than league average, and this is all happening while he’s striking out more and walking less batters than he ever has.

The thing about Nicasio isn’t any of those wonky stats, though. It’s that it’s hard to see him not getting better while playing on a team that’s been thriving in one-run games all season. The Mariners may effectively gain a lockdown arm for their bullpen as the ledger balances for him, and they’ve already had a top ten group by fWAR. What they’re doing is unprecedented and Nicasio is another reason it could keep happening.

Harris
Photo: Karen Warren/Houston Chronicle

Will Harris would likely elicit a shrug from anyone who peered at his 4.15 ERA. His FIP and xFIP are both sub-3.00, though, and his SIERA is an even tinier 2.40. Including him here might be considered cheating in two ways: he’s appeared in ten games over the last month with an ERA of 2.70, and he’s an Astro.

He was victimized by home runs earlier in the year and has been better at keeping the ball in the park, having allowed only one dinger over the last 30 days. It helps that he’s striking out a career high, too, with a reworked curveball that’s tighter and sharper than ever. Remarkably, he might only be the third-best Astros reliever behind Collin McHugh and Brad Peacock. Maybe it’s not cheating so much as it is just unfair that the Astros could get even better with a guy they’re already trotting out there.

And then there’s a pair of Phillies, Hector Neris and Tommy Hunter. Neris has become much maligned and was even sent to the minors to figure himself out. He’s given up a homer on nearly every third flyball allowed, which is bonkers. His fastballs have flattened out, which probably plays into his splitter playing down, too. While his 6.90 ERA is woof-worthy, his 2.95 SIERA is pretty nice and tells us his fastballs being worse shouldn’t make him this bad.

Phillies general manager Matt Klentak caught some flak on talk radio for recently saying that Tommy Hunter’s 2018 has actually been one of his best. His ERA is approaching 5.00 but his SIERA sits at 2.87, so maybe Klentak’s statement gives us a glimpse into the team’s beefed up sabermetric approach. Hunter has fallen victim to similar issues as the others above — high BABIP causing a lower strand rate.

Neris
Photo: Chris Young/CP

The thing about Hunter (25.1) and Neris (30) is they’ve accounted for 55.1 innings out of the Philadelphia bullpen. Positive regression for them could be critical for the team, as others like Edubray Ramos and Victor Arano are slightly outperforming their peripherals so far. They’re on pace for 88 wins, and every inning is going to be important for them in the second half as the team pushes for the playoffs for the first time since 2011.

Looking at a pitcher’s SIERA gives us a stronger sense of their most recent performance. It can also give us a sound starting point for where else to look to understand how the moment has treated them. Beyond that, it can also help us zoom out and examine a pitcher’s potential impact on their team while we move onward to October, no matter how weird they are or have been.


Data from FanGraphs.


Finding the Indians a Hand for the Pen

It’s no secret that the American League has been incredibly top heavy this year, with the playoff race having essentially been decided by the All-Star break (insert crying emoji for Angels’ fans). The Astros, Yankees, and Red Sox have been incredible, ranking first, second, and third respectively in total team WAR. The Mariners have been a pleasant surprise, parlaying a breakout season from Mitch Haniger and dominant pitching from Edwin Diaz and James Paxton with a ludicrous record in one run games (that almost certainly won’t be sustained over the course of a full season). Lurking just outside of the playoff picture are the exciting, young Oakland A’s, who have an interesting mix of young blossoming stars and seasoned vets, all who seem to be clicking at the right time.

Forgotten in all of the competitiveness that defines the AL West and AL East is the mediocrity of the AL Central. Much has been written about how historically bad the division is this year, which houses three rebuilding teams—the Tigers, White Sox, and Royals—and a vastly underperforming/fringy pre-season playoff contender in the Twins. As it currently stands, those four teams all project to finish below .500, with the White Sox and Royals both on pace to lose over 100 games. There is one bright spot, though; this team won 102 games in 2017, lost in extra innings of game 7 of the World Series in 2016, and is home to a two-time Cy Young award winner and the best SS/3B combo in the MLB. That team is the Cleveland Indians.

(Note: All statistics are current as of 07/02/18)

The Tribe have flown under the radar this year in terms of AL World Series contenders, partly because the Astros/Yankee/Red Sox have been so great, and partly because the Indians… well, haven’t been. Early on in the season, the lineup struggled mightily to score runs, couldn’t get reliable starts out of their 5th rotation spot (re: Josh Tomlin), and had a revolving door in the bullpen. As many expected, the offense snapped out of its funk, and now rank 6th in the MLB in total team batter WAR with 14.8, thanks to monster first halves from Francisco Lindor (.936 OPS, 153 wRC+, 21 HRs), and Jose Ramirez (1.007 OPS, 169 wRC+, 24 HRs). The rotation is now as formidable as ever, ranking 2nd in total SP WAR with 11.0, and replacing Tomlin with a combination of a serviceable Adam Plutko and top prospect Shane Bieber. Not to mention, Trevor Bauer and Mike Clevinger have taken massive steps forward, Corey Kluber has maintained his ace status, and 2017 4th place Cy Young finisher Carlos Carrasco hasn’t even found his stride yet. The team is positioned as well as anyone to make a deep postseason run… if their bullpen wasn’t still an atrocity. Take a look at this chart from Sunday’s game against Oakland.

View post on imgur.com

Going down the list, everything looks pretty good until… WOW. A bullpen ERA over 5, up almost 2.5 runs from a season ago. The bullpen might not be quite as bad as they appear on the surface, as they are running an abnormally low LOB%, as well as an unsually high HR/FB rate—which explains why their xFIP is 4.11 compared to their 5.17 ERA/4.64 FIP. The Tribe’s relief corp ranks nearly dead last in total team RP WAR, and their futility—combined with the excellence of the starting pitching—has led Terry Francona to only use his pen for 222.2 innings this year, good for dead last in the MLB. From 2016-2017, the Indians had the 4th best bullpen in baseball by WAR, including the best bullpen ERA and FIP, and the second best xFIP. What happened to this once formidable group? For one, the team lost bullpen stalwart Bryan Shaw via free agency, as well as mid-season acquisiton, Joe Smith. From 2013-2017, no relief pitcher threw more innings than Shaw, who carried a solid 3.11 ERA over those 5 seasons. In addition, superstar Andrew Miller has thrown just 14.1 innings, having been on the shelf for 52 days this season across two separate DL stints. Because of this, Francona has had to rely on closer Cody Allen much more than he would like to, with the results being slighly underwhelming. Allen’s ERA has jumped from 2.94 in 2017, to 3.62 in 2018, all while running an abnormally low BABIP of .233. This seems to suggest that there’s more regression on the way, which doesn’t bode well for a guy who’s K% has fallen almost three percent, and who’s out of zone swing rate has decreased while his out of zone contact rate (and overall contact rate) have increased.

Take a look at the motley crew the Tribe has run out this year (no bullpen carts yet in Cleveland, unfortunately).

View post on imgur.com

When two of the top three guys in innings pitched have combined for -0.5 WAR, you know things aren’t good. Oliver Perez and Neil Ramirez have actually been pretty solid over the last month or so, but those aren’t the guys you want coming in to face Aaron Judge, JD Martinez, or Carlos Correa in October. With both Cody Allen and Andrew Miller likely to be in different uniforms next season, it would greatly benefit the Tribe to capitalize on the team they have now by fortifying their biggest weak spot with pitchers controllable past this season alone. MLB Trade Rumors confirmed this idea, writing, “The Indians hope to acquire at least one quality reliever who’s under control past this season, per [Buster] Olney.”

So, who fits that mold? Obviously, we can rule out a few teams right off the bat:

  • Astros, Red Sox, Yankees, Mariners, Nationals, Braves, Phillies, Cubs, Cardinals, Brewers, Dodgers, Giants, Diamondbacks, Rockies, A’s, Twins, Tigers, Royals, White Sox

All of those teams in that list are firmly entrenched in playoff races, or have invested enough in their team that it would be tough to justify tearing it down right now. The A’s are interesting, given their penchant for selling off productive players at peak value. I think their recent success and competitive timeline will lead them to hold onto their stud closer Blake Trienen, though. I also added the other AL Central teams in there, given that it is unlikely they would like to trade within the division (which for the record, is stupid).

That leaves the following teams as potential trade partners:

  • Rays, Blue Jays, Rangers, Angels, Orioles, Padres, Pirates, Reds, Marlins, Mets

I find it highly unlikely that the Rays move another controllable bullpen piece, given their recent success with the “opener” and the fact that they already traded their former All-Star closer, Alex Colome. The Angels came into the year expecting to compete for a playoff spot, but injuries have derailed them this year. They will be looking to bounce back next year, and probably will only sell off short-term assets. The Mets don’t have anyone worth trading for, while teams like the Pirates and Blue Jays with ace closers (Vazquez and Osuna, respectively) probably will cost too much in prospect currency. The Orioles have relief pitchers with solid track records, but Britton/Brach are both free agents at the end of the year, and Darren O’Day is out for the year after hamstring surgery. Mychal Givens—who is a good reliever in his own right—is controlled through 2021, but probably isn’t the type of arm you can count on as the main guy in a bullpen.

That leaves four teams to choose from: Rangers, Marlins, Reds, and Padres. While each of the first three organizations possess quality, controllable arms, I think the Indians should be aggressive in obtaining Padres’ relievers Brad Hand (LHP) and Kirby Yates (RHP).

While Hand has been an above average reliever for a few years now, Yates really has broken onto the scene this year. Check out some numbers and rankings and see for yourself:

View post on imgur.com

Both rank in the upper echelon in K%-BB%, which shows an ability to miss bats while still maintaining command of the zone. Hand’s ERA and FIP look better, mostly because he had more success in previous years than Yates—although this season Yates is actually vastly outperforming Hand in this area. For those that don’t know what SwStr% means, it is calculated by dividing swings and misses by total pitches thrown by the pitcher, with league average being around 9.5%. Both Hand and Yates are well above average in this category, with Yates’ numbers bordering on elite. These two excellent relievers would fit in nicely in 2018 with a healthy Andrew Miller and a less overworked Cody Allen, and also would provide a sturdy base for the 2019 relief corps that are almost certainly going to lose the two aforementioned Indians.

Check out these two surplus value graphs that I calculated for both Padres relievers:

View post on imgur.com

View post on imgur.com

Let me briefly explain my methodology. When calculating surplus value on a contract, the goal is to figure out how much “extra” value the player is giving to his team by subtracting the market value for his production by the dollars he is actually owed via his contract. The $/WAR calculation for 2018-2020 were taken directly from an article written here on Fangraphs by Matt Swartz, and the expected WAR totals were generated by the generally accepted decline rates laid out by former Fangraphs’ editor and chief, Dave Cameron. Players on average perform at 90% of their previous year’s WAR output through age 30, 85% from 31-35, and 80% from 36 and up. For 2018 dollars owed, I divided each players’ contract by 3 to account for the fact that each would only be in Cleveland for about a third of the current season. Similarly, the 2018 final WAR calculation shown at the bottom of my charts uses 2016 and 2017 WAR totals added to each player’s current WAR, plus an average of what Zips and Steamer—which are Fangraph’s projection systems—think they will produce the rest of the season. Finally, that total is then divided by three to get the average of the three seasons, and then divided by three again, to account for the third of the season Hand and Yates would pitch for the Tribe. Using the previous two seasons WAR in addition to the current season will enable us to have a number that is less influenced by one particular season’s performance, thus giving us a sturdier baseline for which to calculate the next season’s WAR totals.

These charts aren’t perfect, and are meant to be used as simply a rough estimate to see how valuable each player would be over the course of their contracts. For example, Yates will head to arbitration in 2019 and 2020. It is tough to say how much of a raise he will get each season, so I kept the raises equal, and simply doubled his previous year’s salary. Arbitration pays for saves, as well as other counting statistics like strikeouts and holds. Since Yates probably will never do much closing, and really hasn’t become dominant until this season, I feel comfortable saying his salary won’t escalate too much the next few years—which is great for a small market team like the Indians.

Clearly, if we can ascertain how valuable Hand and Yates are, the Padres certainly know their value as well. What would it take to get both of these guys? Would it take a massive overpay? Is there a point where it becomes too expensive? The answer, in short, is “it depends.” The Padres have an absolutely loaded farm system, so they might have more specific desires when it comes to prospect returns. Of course, prized Tribe prospect Francisco Mejia’s name will most definitely be talked about first. I’ve seen him ranked anywhere from a 55FV to a 60FV on the 20-80 scouting scale, meaning some see him as an above average MLB contributor, while others see him as a potential All-Star. Using Kevin Creagh and Steve DiMiceli’s prospect valuation model, which according to Dave Cameron “looks at the level of expected performance and the expected cost of a player during the years before he reaches free agency, and then estimates a player’s value to his organization during that time,” here is how top prospects can be valued:

View post on imgur.com

As you can see, pitchers are valued less due to the fact that pitcher’s get injured much more than hitters, and thus are riskier over the course of their control years. Depending on how you value Mejia, there’s a 22-million-dollar difference in his estimated prospect value. To elaborate, if Hand/Yates combined are around 40 million dollars in surplus value by my model, Mejia’s value outweighs theirs by 20 million if he is a 60FV, while it actually is about 2 million less if he ends up a 55FV. Is there a lot more that goes into trades than simply surplus value? Absolutely. Teams all have their own ways of valuing MLB/MiLB players, and the value of a championship sometimes is the necessary boost to make a move that might be otherwise unadvisable (see: 2015 Kansas City Royals).

Based on what I’ve seen/read, it’s tough for me to value Mejia at a 60FV, mostly due to the uncertainty surrounding his long-term projectability behind the dish. Everyone knows he has an absolute hose, but it appears as if his footwork, blocking, and game-calling need work. Not to mention, he doesn’t have a traditional “sturdy” catcher’s frame, and there is legitimate concern that his body will not hold up after catching 110+ games a season. If he isn’t able to develop into an average to slightly above average catcher, it’s not as if his advanced barrel control from both sides combined with some sneaky raw power won’t play at a corner outfield spot or 3B. That profile will just will make him less valuable, because it is extremely difficult to find a catcher that can hit as well as Mejia is projected to.

Let’s construct two trade scenarios based on Mejia being a 55FV prospect. Because of the scarcity of dominant relievers on the trade market with team friendly contracts, and the fact that the demand for Hand/Yates will be high among contenders, the Tribe will probably have to overpay for their services.

Here’s two mock trades I think could work:

View post on imgur.com

View post on imgur.com

We’ve already talked in length about Mejia, but here’s some quick information on the other guys I included in this deal (note: all FV ratings are via Fangraphs). Talking about deal number one first, Willi Castro (45FV) is a slick fielding SS with solid contact ability, and would fill in nicely at SS if top Padres’ prospect, Fernando Tatis Jr., moves off of short like many are expecting. Quentin Holmes (40FV) is a plus runner with immense athleticism that will help him play plus defense in CF someday. The hit tool isn’t there yet, but if he develops the way the Tribe are hoping, he will be a key cog at the top of a lineup down the road. Julian Merryweather (NR) is a big, right-handed reliever that Fangraph’s prospect analysts Eric Longenhagen and Kiley McDaniel have up to 98MPH, with a plus curveball and changeup. He’s coming off Tommy John surgery, but is an interesting high-upside bullpen piece that could break camp with the team as early as 2019. In the second deal—not including aforementioned Mejia and Merryweather—there is Yu Chang (50FV), who probably has just enough athleticism/twitchiness to stick at short, but also could fill in nicely at 3B down the road. He has some swing and miss issues, but there’s legitimate raw pop in his bat, and he should be able to get to that power in game enough to be a valuable everyday regular. Jordan Milbrath (NR) is a massive 6’6” 215lb reliever that has what Longenhagen and McDaniel describe as a plus sinker and slider.

Will either of these deals be satisfactory to the Padres? Who knows. Will the Indians think that Mejia headlining a deal is too expensive? Who knows. These mock trades were meant to put out a framework of what could potentially move the needle on two relievers with justifiably high price tags, all while staying within the parameters of what a fair deal would be in terms of surplus value.

With the recent departure of LeBron James, and the consistent futility of the Browns (save us, Baker Mayfield) the Indians are Cleveland’s best chance at fielding a championship team over the next five years. Although the price might be steep, it’s impossible to put a dollar amount on what a World Series would mean for the city of Cleveland, even if it requires trading an arm and a leg for a Hand (and a Yates).


The Atlanta Braves Have no Fear of Swinging

The austere face of Freddie Freeman; the resounding crack of Dansby Swanson’s bat; Ozzie Albies brimming smile – these are the surprising Atlanta Braves whose description is no longer surprising, but partial to a definitive fun run through the National League East. The Braves are baseball joy with a mix of relaxed confidence, even brimming optimism. A brimming optimism that has little been partial to any of the Braves players in the past.

A sort of confidence is sweeping the organization as every player is contributing, allowing each player to be distinctly themselves. No longer does Swanson have to turn himself into an all-star, slugger defined hitter, but a second-year player still learning. Nick Markakis can take time to become more confident in a refinement of his mechanics.

The simple undertone is two-fold; the Braves batting lineup is simultaneously playing at a career high, which has allowed the Braves batting lineup to refine their optimal batting throughout the first half of the season. The dominoes fell right, and the Braves learned how to optimize, cutting their progression time in half through analytical chemistry. Second, the one point that defined their functional progression: they have no fear of swinging, second highest in the MLB at 48.6 percent combined with the third highest contact percentage at 79.6 percent.

The odd perception is that swinging this high would lead to inappropriate risk. And for most developing teams, it has. The Detroit Tigers, Kansas City Royals, Chicago White Sox, and Baltimore Orioles round out the top five in swinging percentage, each with a resulting high swinging-strike rate. The Braves, however, have a 9.9 percent swinging-strike rate, eighth best in the MLB. The magic is not accidental due to a combination of veterans who are more patient and, young, power hitters whose slugging means swinging more is appropriate. Nick Markakis has a 4.8 percent swinging-strike rate and Kurt Suzuki is at a mere 7.5. This does not excuse Swanson or Freeman posting 11.7 and 11 percent swinging-strike percentage, respectively, but it allows them to take those extra risks to optimize slugging opportunity.

Suzuki has been an enigma for the Braves, but one of the most important supporting pieces to their run creation. After going his entire career with only one season at a wRC+ over 100 (Minnesota Twins, 2014, 106), Suzuki is now on pace to break his 129 wRC+ and tie his 2.7 WAR from last season. There might not be a coincidence that these two seasons have also seen him break the 50-percent swing margin (52.8 and 53.6 percent) while maintaining a high contact rate, specifically in the zone (93.5 percent this season).

Suzuki’s resolution has come on the backward notion to stop attempts to hit the ball opposite (below 20 percent of hits) instead opting to pull the simply pull hits for apt run creation. His placement map dictates he is better at hitting sharp, pulling balls, and his hits to opposite field were traditionally drab and futile with long hang-time. Hence, an allowance to be better at playing Suzuki baseball and not a league meta-style.

While Suzuki has added value by changing his batting style, there is Nick Markakis who is playing the exact same baseball, just with better contact and providing better leverage. He is hitting well above his career average in ISO at .160 while striking out remarkably lower at only 10.2 percent of pitches. His batted ball profile remains the same, making Markakis a player benefitting from the simple adage of relaxed baseball and improving at tearing pitchers apart in high-leverage situations.

Ozzie Albies, in his second season for the Braves, has already blown away a good first season, posting a 2.4 WAR with a 118 wRC+ (1.9, 112 in 2017). Much like Markakis, Albies has been a run creating machine with high-leverage situation hitting. He doubles down on chaos creation by forcing pitchers to throw uncomfortably away from the zone, less he turns a pitch for a deep slug shot. Albies has refined his slap-shot hitting by achieving his best slugging percentage in the bottom of the zone; thus as pitchers throw breaking-balls and off-speed pitches to derive poor contact, and those pitches drift, Albies is not only able to make contact, but make derisive contact.

The macro change has come with a micro improvement on finding the changeup. He has starkly increased his contact percentage, now above 85 percent in all but two zones. Last season he was above 80 percent in only four of nine zones. Albies is sending more of that contact higher into the air, a bit of a downside to the slugging revolution, but at the same time, is expanding his placement map. He has placed more balls sharply under three seconds of hang time, specifically under 1.5 seconds, implicating an ability to send even soft contact for hits. The career-trajectory implication is Albies is developing an ability to be a rounded hitter, known for more than homeruns.

That then is how the Braves have become a team still fighting into the July trade deadline; a buyer and not a depressed seller. The sudden power from the veterans meant the younger players had time to relax and optimize their best ability, creating a waterfall effect. The Braves have the best high-leverage analytics in the MLB because they find ways to creatively get on base, and those veterans now have players to send home.


New Swing Brings New Struggles for Kyle Seager

Behind many high hopes for the 2018 Mariners was a quiet confidence in the continued performance of veteran players. Among those players was Kyle Seager. Although his offensive numbers dipped quite a bit in 2017, he was still viewed as a quality hitter going forward, but as we close in on the season’s halfway mark, Seager’s performance is still leaving something to be desired.

The power is still there. Twelve homers and 17 doubles put Seager on pace to finish around his typical extra-base production, but the strikeouts are way up, the walks are way down, and as a result, his OBP is a disastrous .270. Even though he has generally come through when the Mariners need him the most (.300/.333/.750 175 wRC+ in 33 PA in high leverage situations), Seager’s overall production has been a disappointment, as he’s slashing .222/.270/.408 (86 wRC+) on the year. Perhaps it all started last season when he curiously turned in his worst full-season performance (106 wRC+) immediately after a career-year at the plate in 2016 (132 wRC+), so let’s cozy up in our armchairs and play hitting coach for a few minutes.

First, we’ll get familiar with Kyle’s swing this year:

Note: There’s nothing wrong with your internet connection. The gifs are just in slooooowww moootiooonnnn.

swing2018 slow.gif

Pretty upright. Medium leg kick. A lot of pre-swing action and an obvious hitch before the hands load. There are a lot of moving parts here, but nothing jumps out as clearly flawed.

Back in 2014, things were much quieter though:

swing2014.gif

Here, Seager’s leg kick is more subdued with a quick toe tap and his hands are much quieter throughout.

In 2015, Seager adopted a more substantial stride, leaving the toe tap behind:

swing2015 slow

His hands start lower, but as they load, they come up to a position consistent with 2014. The camera angles make it difficult to tell, but there also appears to be greater separation between his hands and chest.

Moving onto 2016 (Seager’s career year), we start to see a more exaggerated pre-swing motion:

swing2016 slow.gif

But that extra motion is inconsequential because, once again, as his swing comes together, his hands return to a position consistent with the previous couple years. We also see the return of his toe tap.

Now 2017:

swing2017 slow.gif

His stance looks a little more open here with a slightly bigger stride, but Seager’s swing looks very much the same as it did in 2016. The bat waggle is there, the toe tap is there, but his hands seem to drop ever so slightly more and don’t return to their usual position.

Compare these two gifs from a different angle (from Baseball Swingpedia on YouTube):

side swing 2016.gif

side swing 2017

In 2016 (top), as his foot comes down, Seager keeps his left elbow up and his hands around chin high; however, in 2017 (bottom), his left elbow creeps down just a bit and his hands settle around shoulder high. For a clearer picture, check out these screenshots just as he plants his right foot:

Screen Shot 2018-06-20 at 1.15.27 PM


Screen Shot 2018-06-20 at 1.17.23 PM

Hopefully, this lower position is more obvious in these screenshots because it’s subtle in real time. Now, hand position isn’t everything, but it is hugely important, and Seager’s hands might be a prominent factor in his recent offensive woes and might partially explain why 2017 was a year of great change for him.

That change may be best illustrated in the following table:

Year LD% GB% FB%
2011 27.7 30.4 41.9
2012 21.9 35.9 42.3
2013 20.8 34.3 45.0
2014 22.2 36.7 41.1
2015 24.0 35.2 40.8
2016 21.9 36.1 42.0
2017 17.1 31.3 51.6

Whether it was the lowering of his hands that created more fly balls or the desire to hit more fly balls that lowered his hands, Seager’s fly ball percentage skyrocketed in 2017 and his average launch angle on line drives and fly balls combined jumped from 26.4° and 26.7° in consecutive years to 29.5°.

In theory, this wasn’t a bad idea. Seager does most of his damage in the air, and the quality of the fly balls he hit in 2017 (.412 xwOBA) was similar to that of his fly balls in 2016 (.434 xwOBA). A higher volume of fly balls should have meant more damage, but his altered swing may have caused his line drive rate to plummet. And with much fewer of those high percentage hits, Seager may have lowered what was an impressive offensive floor.Screen Shot 2018-06-20 at 1.43.35 PM
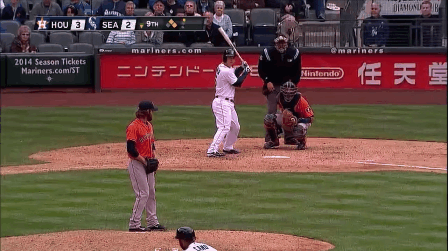
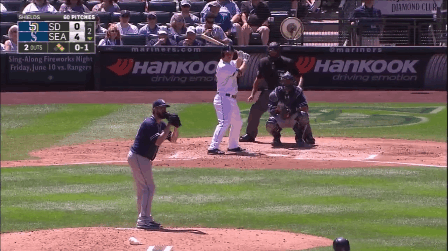
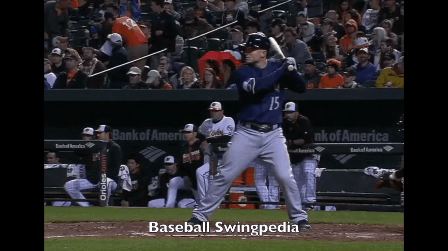
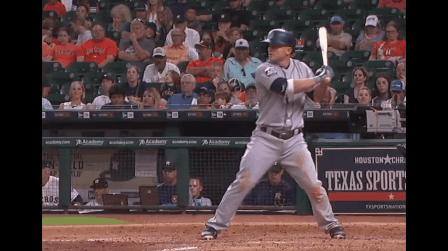
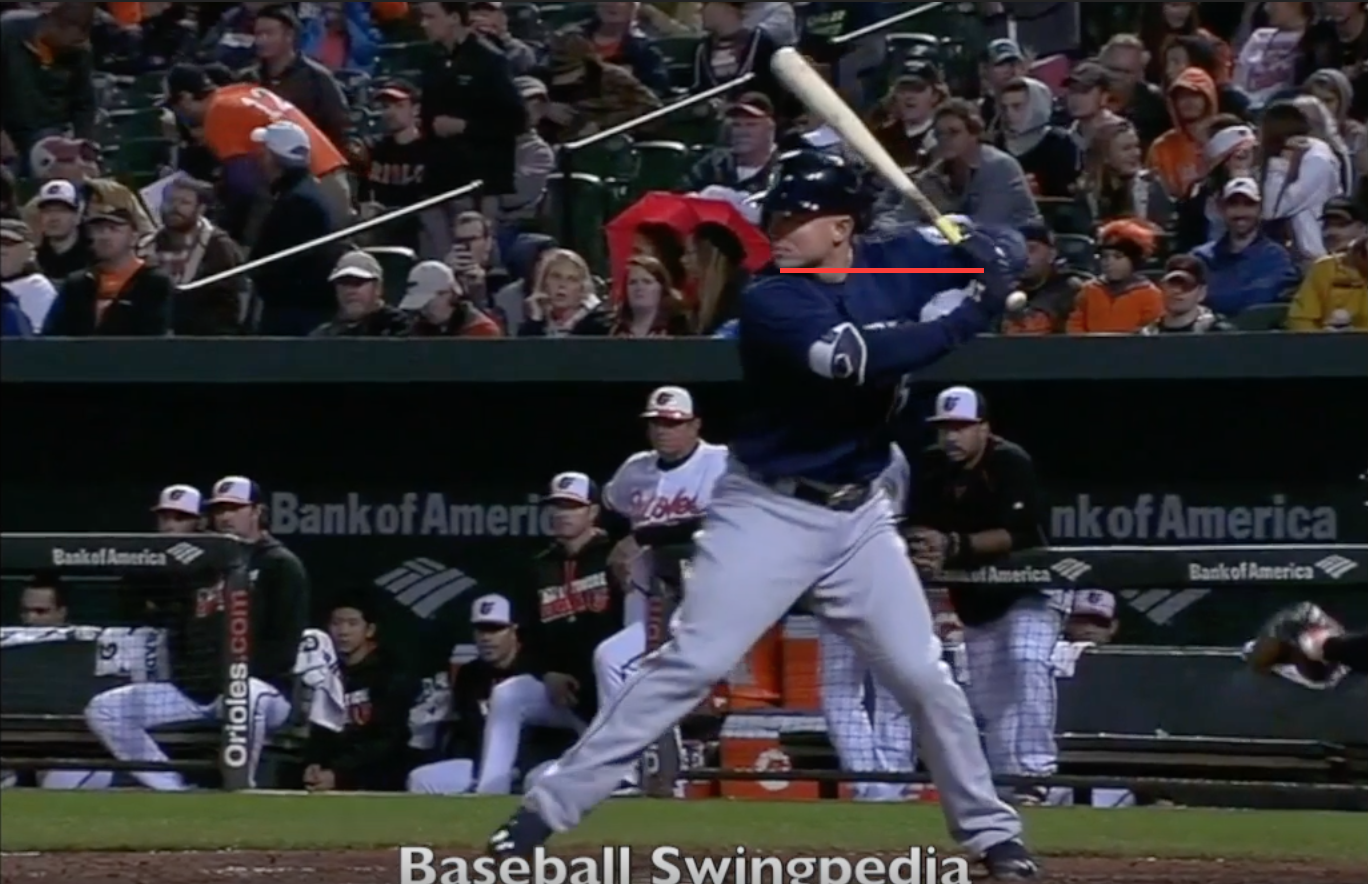
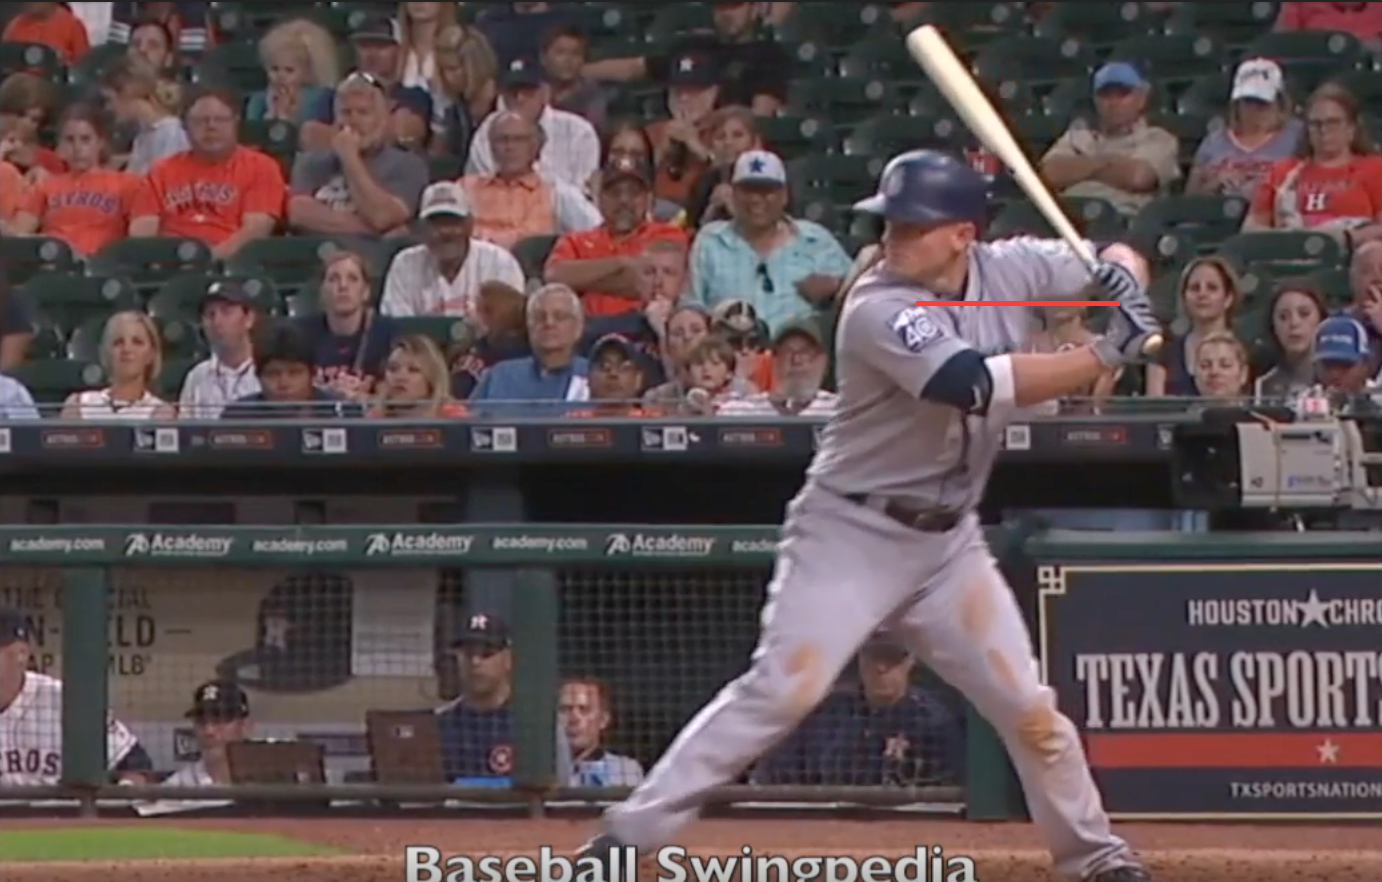
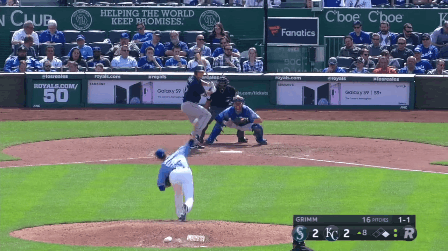
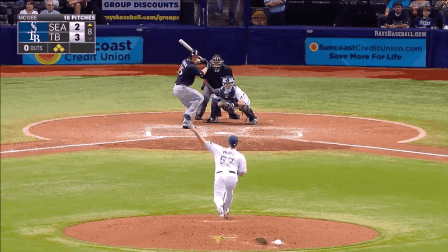
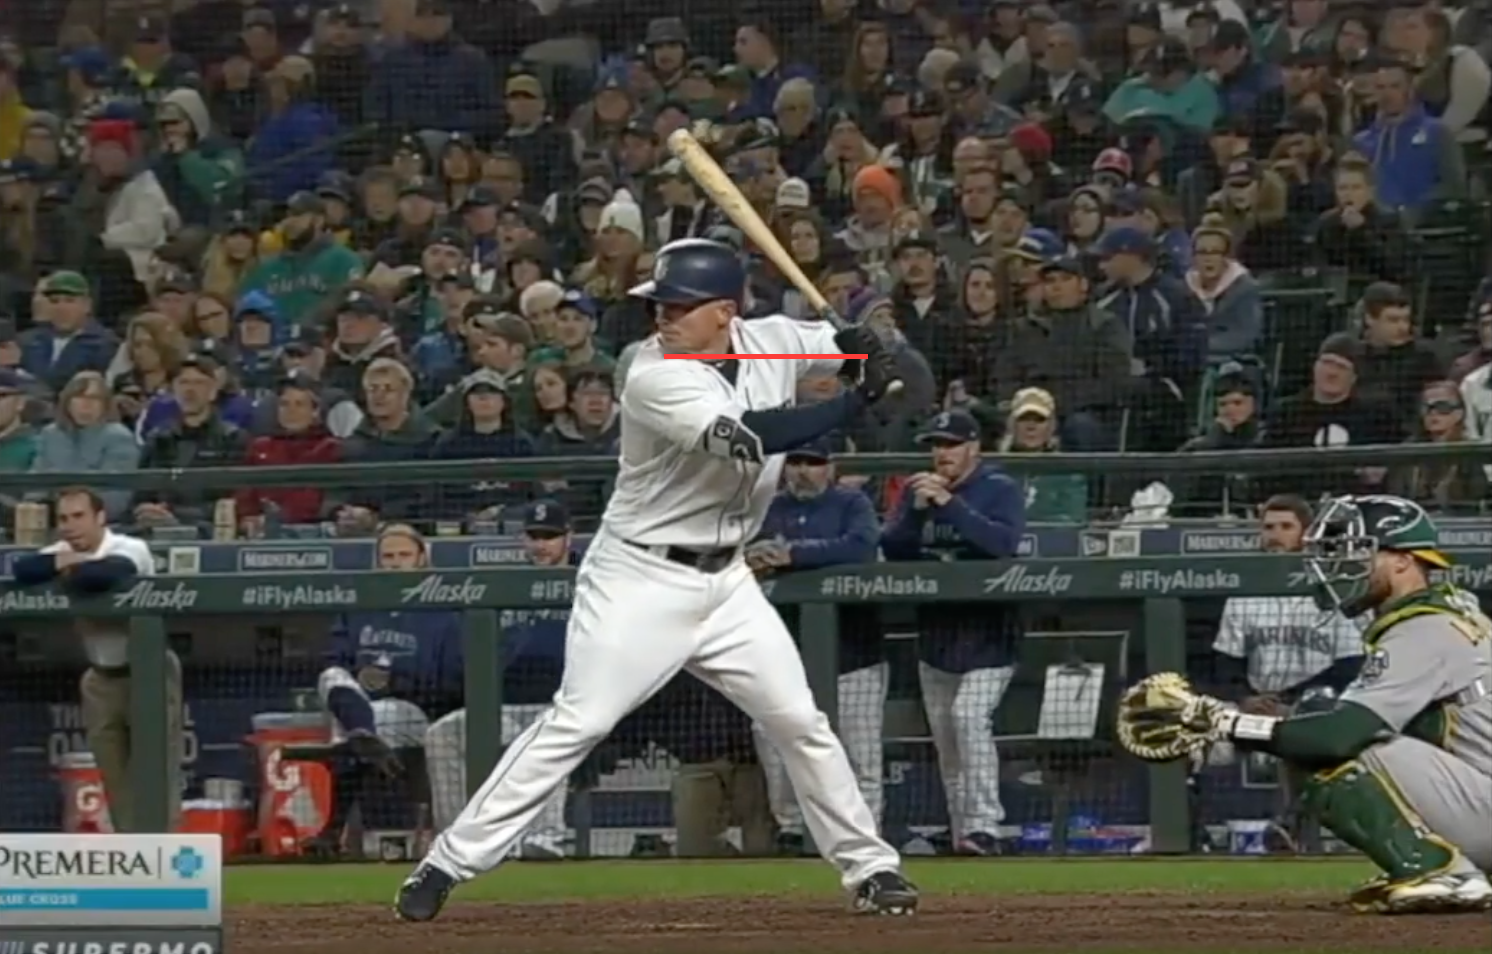
Seager’s hands appear much closer to their 2016 position. His average launch angle on line drives and fly balls combined is eerily similar to last year at 29.6° but his line drive launch angle has gone down while his fly ball launch angle has gone up, which appears to be a good thing based on his xwOBA on those batted balls. That’s not to say he’s 100% mechanically sound though (not that I would know exactly what that is but I digress). Currently, he’s on pace for a 44.7% FB% and a 19.2% LD% — the third highest and second lowest of his career, respectively — and that still-deflated LD% might be a “feel” or timing issue due in part to his hands’ tendency to drift as a pitch is coming in. Watch Seager’s hands closely in a couple examples from 2018:

Between the pitch being released and him getting his foot down, Seager’s hands are still drifting backward whereas, in previous years, he’s been surgically steady:

I promise these are the last two gifs.

2018:

split hands 2018

2015:

split hands2015

It’s a minute difference, but small disruptions in a hitter’s mechanics can have significant consequences. A diminished ability to square up line drives may be among those consequences and that problem has been magnified by the shift. Given that Seager is one of the more consistently shifted on batters in the league, his ability to hit line drives may be the crux of returning to normalcy at the plate.

Year PA with any shift on LD% GB% FB% wRC+
2013 47 19.6 34.8 45.7 75
2014 212 28.4 41.3 30.3 143
2015 280 27.5 39.9 32.6 86
2016 358 22.8 40.3 36.9 86
2017 374 18.8 32.4 48.8 56
2018 192 19.3 40.1 40.6 54

Generally, the higher Seager’s line drive percentage has been with the shift on, the better he has performed against it by wRC+. And although that doesn’t tell the whole story, it certainly makes a lot of sense. He’ll hit homers over the shift and he’ll poke some grounders through the shift, but if he can’t line balls past the shift a bit more, as we saw last year and are seeing this year, his offensive ceiling just won’t be the same.

Various little changes from one year to the next are what make the best players in the game the best players in the game, but in that quest to become the best, sometimes you can lose what once made you successful. Before you know it, square 1 isn’t where it was a few years ago. What is normal for Seager now is not what was normal when he was at his most successful, but considering that his power is still evident, he seems far from broken. For the majority of the season, his poor offensive performance has been buoyed by good teammates, yet the challenging past few games show that if the Mariners really hope to hang with the best of ’em, they need the Kyle Seager to show up on both sides of the ball.


All data from FanGraphs and Baseball Savant and referenced prior to games on 06/20/18.