Archive for Uncategorized

Analyzing the FanGraphs’ Mock Draft from an Outsider’s Point of View — 1B

As an avid reader of FanGraphs, I’ve been following the ongoing mock draft and thought it would be interesting to compare the results to the dollar value rankings I created using Steamer’s 2015 projections.

I downloaded the draft spreadsheet partway through the 16th round, just after pick 183 (Chase Headley). Here is a breakdown, position-by-position. I’ve included the overall pick and the dollar value for that player based on 2015 Steamer projections in parentheses.

First Base

Four first basemen were taken in the first round: Miguel Cabrera (4th–$48), Paul Goldschmidt (6th–$36), Jose Abreu (8th–$35), and Edwin Encarnacion (10th–$36). After Cabrera is off the board, the next three guys are almost identical in value, according to Steamer. At this point, it becomes the preference of the owner. Goldy and Abreu are younger than Encarnacion and should hit for a better average with similar production in the HR/RBI department, so it makes sense to see them go ahead of Edwin, but there really isn’t much difference among them.

In the second round, Freddie Freeman (18th–$24) went before Anthony Rizzo (21st–$29) in what could be considered a questionable selection. Steamer likes Rizzo over Freeman by $5 in value. Below are their respective projections for 2015:

560 AB, 81 R, 24 HR, 83 RBI, 3 SB, .284 AVG—Freeman ($24)

541 AB, 85 R, 30 HR, 89 RBI, 6 SB, .271 AVG—Rizzo ($29)

Rizzo has Freeman beat in every category except for average.

Let’s look at their average stats over the last two years (since Rizzo has only played full seasons over the last two years):

579 AB, 91 R, 20 HR, 94 RBI, 2 SB, .303 AVG—Freeman

565 AB, 80 R, 28 HR, 79 RBI, 6 SB, .258 AVG—Rizzo

This tells a different tale, as Freeman now has the edge in runs, RBI, and average, with Rizzo leading in homers and steals. Another factor is the outlook for their respective teams. The Cubs look to have a much better offense than the Braves, which should allow Rizzo to score and drive in more runs. I would have gone for Rizzo before Freeman.

Five more first basemen were taken in rounds 4, 5, and 6: Albert Pujols (47th–$22), Victor Martinez (48th–$26), Adrian Gonzalez (53rd–$22), Joey Votto (61st–$16), and Prince Fielder (72nd–$23).

Based on past history, I believe you have to take Pujols, Martinez, and Gonzalez before Votto and Fielder. Votto played in just 62 games last season and doesn’t have the power you’d like to get from a first baseman. Fielder played in just 42 games and is coming off major surgery that included having his neck bones fused together. His production was already dropping before the injury, so he really is a question mark for 2015.

Back to Pujols, Martinez, and Gonzalez: Steamer likes V-Mart the best of the three and he is coming off a terrific season (.335, 87 R, 32 HR, 103 RBI), but is also heading into his age 36 season (Pujols will be 35, Gonzalez will be 33).

Let’s look at what they’ve done over the last three seasons (seasonal averages):

544 AB, 74 R, 25 HR, 91 RBI, 5 SB, .273 AVG—Pujols

569 AB, 77 R, 19 HR, 96 RBI, 1 SB, .321 AVG—Martinez

601 AB, 76 R, 22 HR, 108 RBI, 1 SB, .290 AVG—Gonzalez

It’s close. There’s enough of a range of outcomes with all three hitters that they could finish the season in any order.

Rounds 7 through 9 saw four more first baseman get drafted, starting with Carlos Santana, taken with the 77th pick. Here I’m not sure of the league specifications. For my dollar values, I have Santana only eligible at first base (94 game played in 2014) or third base (26 games played). He did play 10 games at catcher. If he’s only eligible at first base or third base, I have him worth $8. If he’s eligible at catcher, his value jumps to $21 based on positional scarcity. Anyway, the four first baseman taken here were Santana (77th–$8), Chris Davis (79th–$13), Lucas Duda (105th–$5), and Steve Pearce (106th–$17).

Steamer 2015 projections:

490 AB, 74 R, 21 HR, 73 RBI, 4 SB, .245 AVG—Carlos Santana ($8)

483 AB, 71 R, 30 HR, 79 RBI, 3 SB, .242 AVG—Chris Davis ($13)

534 AB, 69 R, 24 HR, 75 RBI, 3 SB, .234 AVG—Lucas Duda ($5)

514 AB, 77 R, 23 HR, 74 RBI, 6 SB, .270 AVG—Steve Pearce ($17)

Again, Santana is much more valuable if you can slot him at catcher. Davis is a big risk considering he had by far the worst year of any of these players in 2014 (.196, 65 R, 26 HR, 72 RBI, 2 SB), but he also has the highest ceiling, having hit 53 homers with a .286 average in 2013. Duda had a breakout 2014 season, hitting 30 homers and driving in 92 runs last year. Steamer sees regression to 23 and 74 in 2015. Of these four players, Steve Pearce had the best rate stats in 2014 (.293/.373/.556) and best wRC+ (161). He’s projected for a career-high 586 plate appearances in 2015. Consider the Orioles have an open spot for him to be an everyday player after losing Nelson Cruz and Nick Markakis in the offseason, if you expect Pearce to get the playing time, he’s your guy. My order for these four players would be Pearce, Davis, Santana, and Duda (unless Santana has catcher eligibility).

The next four first basemen could be right up there with the previous group, based on Steamer projections: Ryan Zimmerman (120th–$11), Mark Trumbo (135th–$12), Justin Morneau (163rd–$14), and Eric Hosmer (166th–$17). The projections:

508 AB, 70 R, 19 HR, 71 RBI, 3 SB, .275 AVG—Ryan Zimmerman ($11)

526 AB, 67 R, 29 HR, 81 RBI, 4 SB, .246 AVG—Mark Trumbo ($12)

479 AB, 68 R, 19 HR, 74 RBI, 2 SB, .295 AVG—Justin Morneau ($14)

573 AB, 76 R, 19 HR, 77 RBI, 7 SB, .278 AVG—Eric Hosmer ($17)

With Zimmerman, you have to worry about his health, as he only played in 61 games last year. He also had the lowest HR/FB% of his career, at 7.8%. In 2012 and 2013, he hit 25 and 26 home runs, so he could bounce back and be just fine. Trumbo played in just 88 games last year and hit 14 homers after back-to-back seasons of 30 or more. Steamer expects him to bounce back to 29 homers, albeit with a low batting average. Morneau is the oldest of this bunch, at 34 years old, but has the Coors Field advantage and should hit for the best batting average. Hosmer is the youngest of this bunch (25), but is also coming off a bad year rate-stat wise (.270/.318/.398).

The interesting thing to notice is that this group of four, taken in rounds 10-14, is projected to be similar to the previous group of four, taken in rounds 7-9. There’s a difference of 90 picks between Santana at 77 and Hosmer at 166, but little difference in their projections, with Hosmer actually projecting better.

Final Notes: The top four of Miggy, Goldschmidt, Abreu, and Encarnacion are a tier above Freeman and Rizzo. Then you have Pujols, Martinez, and Gonzalez, with the wild cards of Votto and Fielder fitting in just below them. Beyond that, I’d expect diverse opinions when it comes to Santana, Davis, Duda, Pearce, Zimmerman, Trumbo, Morneau, and Hosmer. Davis is the most volatile. Pearce could be a late-bloomer, like Jose Bautista. Santana is likely the most predictable but is much more valuable if he can be played at catcher than first base, while Zimmerman and Trumbo are coming off injury-shortened years.
Matter of Import: The Padres’ Strange Roster

It may have been John Steinbeck who said that everyone in California is from somewhere else. Or it may have been some other dude. In any case, the San Diego Padres’ roster exemplifies the melting pot that is the Golden State. Ten of their 14 core major leaguers (where I’m defining “core” to mean the 14 players that make up the starting lineup, starting rotation, and closer) are trade acquisitions:

C     Derek Norris

1B   Yonder Alonso

2B   Jedd Gyorko

3B   Will Middlebrooks

SS   Alexi Amarista

LF  Justin Upton

CF   Wil Myers

RF   Matt Kemp

S1   Andrew Cashner

S2   Ian Kennedy

S3   Tyson Ross

S4  Odrisamer Despaigne

S5   Brandon Morrow

CL   Joaquin Benoit

The Padres core is as heavily dependent on trade imports as any I’ve ever seen. And while this may be a recipe for cooking up a world championship, it hasn’t been, at least not recently. No world champ in the last ten years has had that many core players (including DHs for the AL teams) acquired by trades:

White Sox (2005)    7

Cardinals (2006)     5

Cardinals (2011)      5

Red Sox (2007)       4

Giants (2012)           3

Phillies (2008)         2

Yankees (2009)       2

Giants (2014)           2

Giants (2010)           1

Red Sox (2013)        1

It’s possible that a couple of home-grown Padres could replace two of their trade imports – Cory Spangenberg might effectively discard Middlebrooks (either by winning the hot corner himself or by pushing Gyorko to third). Free agent pickup Clint Barmes could displace Amarista, one of the few major league players whose job Clint Barmes genuinely threatens. But even if the Padres close the numerical gap, they are still pursuing what is at best an unusual route to victory.

The top four trade-dependent world series winners listed above had established superstars around which to build: Frank Thomas for the White Sox; Albert Pujols for the Cards; and Dustin Pedroia, David Ortiz and MannybeingManny for the Sawx. (In the White Sox’ case, all the activity indeed produced a championship for the prophetically-monickered Big Hurt, but too late. A foot injury sidelined him at the end of July, and he would never again take a swing in anger for the south-siders.) The Padres roster has no such anchor tenant – their only established home-grown regular is Jedd Gyorko, he of the 2.5 career WAR.

While new general manager A. J. Preller’s hyperactivity has generated much of the hot stove heat this winter (and the best hot stove headline thus far), the wheeling and dealing began before he took over. Alonso, Amarista, and the top three starters all arrived under the previous administration. So while Preller’s moves look like a radical restructuring of the roster, they can also be seen as simply finishing the grim task that his predecessor Josh Byrnes started.

Because this is what happens when prospects degenerate into suspects. (Younger or more sensitive readers may wish to avert their eyes now.) This list goes a long way toward explaining why Preller has been treating his roster like a cat treats a new sofa. Not one of the top ten players on it is with the Padres major league club today; indeed, only the not-yet-immortal Logan Forsythe is even in the majors. Donavan Tate’s tire fire has been well-chronicled – the reboot failed, and he did not play organized ball in 2014. Nor did Simon Castro or James Darnell. Wynn Pelzer pitched for the Camden Riversharks. Cory Luebke’s had two more Tommy John surgeries than you’ll ever have. The rest of that erstwhile top ten are tilling the soil of other teams’ farms, generally without significant yield. (Ok, younger and sensitive readers, you can open your eyes.)

None of this is Preller’s fault (or Byrnes’, for that matter – these were Kevin Towers picks), but this is the hole out of which Preller must dig, and they don’t make many shovels this large. Preller had essentially two choices on assuming the helm of the S.S. Friar: (a) put a motley cast of young low ceiling players and affordable, declining vets on the field and wait for the farm to resprout; or (b) make trades like Jim Bowden on Red Bull and hope to field a competitive team in a division with two perennial playoff contenders.

Preller chose the latter, ill-advisedly in my view, until I read a recent Joe Sheehan newsletter (yes, you should subscribe). Sheehan made a number of points about the Padres current situation; the one relevant here is that the Pads are stuck with a relatively bad TV deal, and thus are unusually dependent on attendance for revenue. Preller needs to get butts in the seats, and that won’t happen if he puts a AAA team on the field, even if he distracts the fans with dollar beer nights and kazoo-playing clowns shooting T-shirts into the sparsely populated upper deck. Sheehan believes that  in order to fund a sustainable scouting and development-based franchise, Preller paradoxically needs to increase the age and cost of the major league roster in the short term.

I don’t like Preller’s odds. Look at the Padres’ core again – there isn’t a single position player on it that doesn’t have either injury or on-base issues, except Upton. The rotation doesn’t have a #1 starter, although perhaps Ross can develop into one. On the other hand, he’s already 27. The Padres play in the same division as the Los Angeles Dodgers, who may bolster their farm system by purchasing Cuba once the messy embargo-lifting details are sorted out. The Giants don’t have the Dodgers’ financial resources, but they remain one of the consistently best run organizations in the game, with two franchise players (Posey and Bumgarner) who are still a long way from old.

But Preller presumably knew the job was dangerous when he took it, and at least he has attacked his task with vigor and focus. Sometimes guys don’t get hurt, and sometimes the batted balls find grass rather than gloves. That’s why they play the games, and San Diego’s 2015 campaign promises to be more interesting than most, whether it’s ultimately successful or not.


Offering a Solution to the fWAR League Adjustments

This article is a response to Noah’s thought inspiring articles about a modification to the FIP-based pitching  fWAR and  his issues with the fWAR league adjustments in which I want to lay out a possible solution to the somewhat “flawed” league adjustments currently used. My method could be applied to a divisional context as well therefore I won’t address it specifically.  I am not a native speaker therefore please do not take any offense in grammar or spelling mistakes.

Let’s start with the basics of the current concept. 1,000 WAR has to be given out each year to all players implying a replacement level of .294. Even if for some reason every player on all the current 25-man rosters happened to be abducted by aliens this would not change. Even if both leagues consisted entirely of “replacement” players, 1,000 WAR would be handed out. This is our model and it is a great one because it includes context so beautifully and effortlessly.

Here is a little thought experiment: Say these aliens are huge fans of the NL for some reason and decide to abduct the entire league’s player population. We would be left with the untouched AL (we assume the AL and NL are of exactly equal strength for this thought experiment). Again, 1,000 WAR has to be distributed among all big league players. If our current model is handling league adjustments correctly we would expect to see 0 WAR in the NL and 1,000 WAR in the AL. Unfortunately, the current fWAR model wouldn’t spit out a result coming close to this.

Here is why: Even in a reality where about 88% of all games are played internally in a given league a great portion of the fWAR calculation is based on treating MLB as being ONE league instead of two rather independent leagues. The consequences can be strongly seen in my thought experiment. Because every player in the NL would be a replacement player we could hardly find a hint of the changed talent level in the NL’s stats. This is because replacement level hitters are facing replacement level pitching and my guess would be that the NL’s overall batting line and R/G would barely change – even if the talent changed dramatically. Now wOBA is calculated using both leagues and the offensive output by these replacement hitters would be weighted as if they put up these numbers against actual major league competition. Thus, the NL would be undeservedly credited with batting runs and run prevention for the pitchers (again versus replacement hitters).

This is certainly an exaggeration but it is still true with one league being weaker. The only way we would notice the changed talent level would be the interleague record against the AL. In a perfectly balanced world with two equally strong and talented leagues we were to see a .500 record and our 1,000 WAR could be handed out 50/50 between the AL and NL and 57/43 between position players and pitchers. What would the interleague record be? What would it have to be? The answer is pretty easy: .294 aka replacement level. Now this is interesting and it seems like we are going somewhere. Here seems to lie the key for the proper league adjustments because how much WAR should be handed out to a league that wins at a replacement level against a “true” major league? Sounds pretty darn like a league full of replacement players which are by definition worth 0 WAR. And this 0 WAR should be the correct answer based on our assumptions in this thought experiment.

How do we get there?

1) Calculate every aspect that goes into WAR (R/PA, wOBA, FIP, etc) separately for both leagues. In fact we have to treat both leagues as independent. This would mean 500 WAR for each league per default, distributed 57/43 between position players and pitchers.

2) Figure out the interleague record. I would suggest using something like a 3 year regressed rolling average (Just like the 5 year rolling regressed park factors on FG that can actually change a player’s WAR retroactively if his home park happens to play very hitter – or pitcher friendly in the immediate future) I will use a .525 record in favor of the AL for an example later on.

3) Based on the “true” replacement levels of .294 for teams, .380 for starters and .470 for relievers we calculate an “artificial replacement level” for the weaker and the stronger league via the odds ratio.  Using the .525 interleague record for the AL as an example this will come out to an artificial replacement level of

.315 for NL teams / .274 for AL teams

.404 for NL starting pitchers / .357 for AL staring pitchers

.495 for NL relievers / .445 for AL relievers.

To help interpret these numbers think about it this way: The .475 NL is the weaker league. A “replacement team” would have a .294 record in the NL (forget about interleague for a moment). If this team plays against a .294 AL team, we would expect a .500 W% IF both leagues are equally strong. But we already established that the AL wins at a .525 clip when two teams with “equal” records IN their respective leagues match up. The .315 “artificial” replacement level for the NL means that we expect a .315 NL team to win 50% of all games a against a .294 AL team. Thus, we can conclude that the replacement level bar to clear should be put a little higher in the NL because it seems easier to accumulate value in the weaker league. On the other hand the opposite is true for the AL, where the replacement level bar should be put a little lower for the same opposite reasons and to be consistent with handing out 1,000 WAR each year.

4) Derive  the correct distribution of WAR for both leagues based on the artificial replacement levels. In my thought experiment at the beginning we would have a 0/1,000 WAR distribution, because replacement level would actually be .500 for the NL using my methodology in 3). A balanced league would have a 500/500 WAR distribution with a replacement level of .294 for both leagues. With the AL winning at a .525 clip against the NL this means a WAR distribution close to 450/550 in favor of the AL.

The WAR distribution for 2014 on FG was 472/528 in favor of the AL.

Conclusion

There are really some beautiful and elegant side effects. The independence of both league’s calculations would mean interleague adjustments are not necessary at all. This is because even if there are about 12% interleague games, pitchers and hitters are only compared to the stats that other players in the same league have put up – interleague included. The adjustment takes place when we evaluate the interleague record because this is the only direct way to measure difference in strength/talent. The current league adjustments are a little bit flawed in my opinion because wOBA and the run environment is calculated for the entire MLB and interleague records are not taken into consideration at all. Therefore a stiff replacement level is used for all years. My methodology addresses these problems and scales an artificial replacement level for each year and league based on a multi-year regressed interleague record while still keeping the overall replacement level for all of MLB to .294 and 1,000 WAR each year.

To be honest with you I am not a huge fan of divisional adjustments because of small samples and differing opponents. In an entire season’s interleague schedule there should be a lot more signal. I think when applying divisional adjustments we would have to regress heavily. I am not entirely sold yet to include a possibly very complicated divisional adjustment when its heavily regression doesn’t give us much to learn from anyway. But I am open to be sold the other way.

Look forward to a follow-up in which I walk through some real life examples and present some of the changes my methodology brings. Feel free to comment and discuss! Prost!


A Quick and Easy Way to Rank Starting Pitchers for Fantasy Baseball

There are different ways to rank players for fantasy baseball. These rankings will depend on the league settings and your personal beliefs as to what is the best method. Currently, there are two main methods that immediately come to mind. Here at FanGraphs, Zach Sanders has posted his method to determine rankings and dollar values using z-scores, which takes into account the standard deviation for that player’s statistics compared to the set of players in the sample. Others prefer a method called Standings Gain Points. With Standings Gain Points, you will need to have an expectation of the end-of-year standings in the different categories based on previous year’s data.

I wanted to find a quick-and-easy way to rank starting pitchers and I remembered reading a post at Tom Tango’s site about the usefulness of “strikeouts minus walks” for pitchers (K-BB). Similarly, some writers here at FanGraphs have begun to use K%-BB% in their posts. I decided to look at a few options to see which is the best “quick-and-easy” way to rank starting pitchers.

For each of the last three seasons, I used the z-scores method to determine the top 100 starting pitchers for comparison purposes. More specifically: I found the sum of the standard deviations for four traditional categories for starting pitchers: wins, strikeouts, ERA, and WHIP (saves were not included because I was just looking at starting pitchers). I’ll use Clayton Kershaw as an example. I divided Kershaw’s wins (21) by the standard deviation of all pitchers’ wins in this sample (3.5) to get the z-score for Kershaw in the wins category (6.0). I did the same for strikeouts (239/41.9=5.7).

For ERA and WHIP, I had to do a little more work. Again, using Kershaw as an example. I took the ERA of the group of pitchers (3.27), subtracted Kershaw’s ERA (1.77), multiplied by Kershaw’s innings pitched (198.3), then divided by nine. The result was 33. This gave me Kershaw’s number of runs saved (runs allowed below what a pitcher with a league average ERA would allow in that many innings). This may be confusing to some. That number, 33, is how many more earned runs Kershaw would have to allow to have a league average ERA. In 2014, Kershaw pitched 198.3 innings and allowed 39 earned runs for an ERA of 1.77. Had he allowed 33 more earned runs, he would have allowed 72 earned runs. Allowing 72 earned runs in 198.3 innings would give him an ERA of 3.27, which is the average of this group of pitchers I’m working with.

I did a similar thing for WHIP. I took the WHIP of the group of pitchers (1.18), subtracted Kershaw’s WHIP (0.86), then multiplied by Kershaw’s innings pitched (198.3). This gave me the number of base runners saved for Kershaw (64). This means had Kershaw allowed 64 more base runners (walks or hits) in the same number of innings pitched, his WHIP would have been league average.

Once I found runs saved and base runners saved for each pitcher, I found the standard deviation of the group of pitcher for each metric. I then divided that pitcher’s runs saved and base runners saved by the standard deviation of the group of pitchers to get the z-scores for ERA and WHIP. Because I was only dealing with starting pitchers, I did not use saves, but if relievers had been included, saves would be done the same way as wins and strikeouts. Once I found the z-scores for wins, strikeouts, ERA, and WHIP, I added them together to get a total number for each pitcher. The pitchers were ranked by this total number for fantasy purposes.

Once I had this total for each pitcher, I ran correlations with each pitcher’s total number based on z-scores and some potential “quick-and-easy” methods to rank these pitchers. I started off with four potential methods: raw strikeouts, K-BB, K%, and K%-BB%. The following shows the correlation for these four methods with the total number figured above (the sum of the z-scores for the four fantasy pitching categories for starting pitchers).

For 2014:

0.80    K-BB

0.72    Strikeouts

0.65    K%-BB%

0.58    K%


For 2013:

0.78    K-BB

0.72    Strikeouts

0.67    K%-BB%

0.56    K%


For 2012:

0.77    K-BB

0.71    Strikeouts

0.55    K%-BB%

0.44    K%


Of these four methods, K-BB has the highest correlation, followed by raw strikeouts. This makes sense because starting pitchers in fantasy baseball get some of their value from the innings they pitch. They need to pitch to get those wins and strikeouts. The other two options (K% and K%-BB%) don’t factor in playing time, so it’s not surprising that they don’t correlate as well as K-BB and raw strikeouts.

With this in mind, I took K% and multiplied by innings pitched for an additional metric, along with (K%-BB%)*IP for another. Below, I’ve included these two options.

For 2014:

0.83    (K%-BB%)*IP

0.80    K-BB

0.78    K%*IP

0.72    Strikeouts

0.65    K%-BB%

0.58    K%


For 2013:

0.81    (K%-BB%)*IP

0.78    K-BB

0.77    K%*IP

0.72    Strikeouts

0.67    K%-BB%

0.56    K%


For 2012:

0.80    (K%-BB%)*IP

0.77    K-BB

0.76    K%*IP

0.71    Strikeouts

0.55    K%-BB%

0.44    K%


As you can see, (K%-BB%)*IP comes out on top, but the more simple K-BB is close and the point is to find a “quick-and-easy” method. The next idea I had was to incorporate home runs allowed. Keeping it simple, I created K-BB-HR and compared it to the others.

For 2014:

0.83    (K%-BB%)*IP

0.82    K-BB-HR

0.80    K-BB

0.78    K%*IP

0.72    Strikeouts

0.65    K%-BB%

0.58    K%


For 2013:

0.81    (K%-BB%)*IP

0.81    K-BB-HR

0.78    K-BB

0.77    K%*IP

0.72    Strikeouts

0.67    K%-BB%

0.56    K%


For 2012:

0.80    K-BB-HR

0.80    (K%-BB%)*IP

0.77    K-BB

0.76    K%*IP

0.71    Strikeouts

0.55    K%-BB%

0.44    K%


This method (K-BB-HR) is right there with (K%-BB%)*IP. It’s not quite as simple as K-BB, but it is quite simple. Using K-BB is very simple and will get you close to the more complex methods to rank starting pitchers. If you want to take it one step farther, use K-BB-HR.

So, without further ado, here are the top 20 pitchers ranked by K-BB-HR using Steamer projections for 2015:


  1. Clayton Kershaw (164)
  2. Chris Sale (152)
  3. Max Scherzer (151)
  4. Felix Hernandez (141)
  5. Stephen Strasburg (137)
  6. Yu Darvish (136)
  7. Madison Bumgarner (135)
  8. Corey Kluber (132)
  9. David Price (123)
  10. Matt Harvey (121)
  11. Zack Greinke (118)
  12. Jon Lester (116)
  13. Masahiro Tanaka (111)
  14. Cole Hamels (110)
  15. Adam Wainwright (106)
  16. Johnny Cueto (106)
  17. James Shields (105)
  18. Jeff Samardzija (102)
  19. Jordan Zimmermann (101)
  20. Ian Kennedy (100)


That’s a pretty good-looking list and easy to figure using three basic statistics and subtraction.


Prepping You for an Ottoneu Initial Auction

If you are a Fantasy Baseball fan and read FanGraphs, you are probably contemplating joining an Ottoneu league, if you have not already. Three years ago, I was in the same boat. I had experience with snake drafts and was looking for something different. Ottoneu provides that. Dynasty, minor league players and owners must win a player through an auction. I took the plunge three years ago and was not prepared for the initial auction and wanted to share my experiences with some advice sprinkled in.

For the initial auction, make sure you can devote the ENTIRE DAY and probably some of the night. With 12 people and 40 players to roster, that is 480 auctions. Not to mention the inevitable mistakes (wrong Raul Mondesi) and an owner’s internet problems (it will happen to at least one person) and someone showing up late. Oh and those sweet, sweet bathroom breaks. This was my first auction, and if you have never done a real one before, you are in for a treat.

In a snake draft, if you pick ninth, there is only a slight chance you will get the stud you want. In an auction, you WILL get him. Just be prepared. If you pick Trout for example, be prepared to be in a bidding war with several other owners. Popularity comes in to play here. There are some players that are first-rounders that just aren’t as popular because they play for a team that everyone in your league hates, or they play on the west coast and your league is filled with east coast snobs. Once you have a player identified, keep bidding until you win him. You are thinking, “But what about the budget? It’s only $400 and there are 40 positions on my roster!” Do not worry about that now. Now is your chance to get the player YOU WANT. Not the player who is the best available based on your random draft position.

So now, you got the player you wanted. The power is coursing through your veins. You feel like you have already won. Snap out of it! That is only one spot filled. You have to start 22 players in total and bench another 18! That stud represents less than 5% of your total starting lineup. A thought will cross your mind that you just spent a big portion of your payroll on less than 5% of your team! What have you done?! If he gets hurt, you are screwed right? Wrong. Do not freak out and sit out bidding for the next several picks to let everyone else’s remaining budgets catch up. Why? Because you will be surprised on the caliber of players won for a buck or two during the final rounds, after everyone has spent most of their money.

It is within the next few rounds where you can still get top-notch talent, but for a lot less than what the first round players went for. Popularity comes into play again here. Ottoneu owners favor young players because they can be kept year-to-year. Use this to your advantage here. It is in these rounds where you can get older studs at a discount. In addition, other owners’ pocketbooks are still stinging from their first round purchase. You can get some very good, post peak, players for around half of what players went for in the first round. Three years ago, I got Beltre and Konerko for less than $20 each. Within these next few rounds, still go after players you want, knowing that the final price will not hit nearly the same astronomical levels as the first round.

After 3 or 4 rounds, you have a nice nucleus of top-notch talent on your squad. This is when you can start looking at the tiers of players within your positional rankings. Also, start paying attention to how many owners are actively bidding up a player you want. You will see many owners bidding small amounts, looking for a bargain. Ignore them. Pay attention to how many owners are bidding as if they really want the player. If several owners are actively bidding, bow out, and go after the next player within the same tier. That next player should have one less owner bidding on him and he should come cheaper.

During the later rounds, start focusing on those high-upside starters, sleeper types. Do not bid on players who might fall to the waiver wire. If your sleepers do not pan out, the waiver wire will have plenty of serviceable players. Furthermore, it is better to see what a players is doing in April before bidding on him. Again, you will be amazed at the player that is won for a few bucks during the last rounds. This is where you will start prospecting. Remember, they are prospects! Do not spend a ton on prospects. The flameout rate is just too high. Another losing endeavor is taking the heir apparent to an older star you got. I took Mike Olt thinking once Beltre hangs them up; Olt will take over and not miss a beat. Minor league prospects change hands more than a $20 bill at a white elephant gift exchange. This combined with their high flameout rate is a doomed strategy. Focus on guys with an ETA of current year + 1 and don’t spend more than a few dollars on each one.

Finally, keep some powder dry for free agents. Every year, players come out of nowhere and surprise everybody. There are less owners actively bidding during the regular season than during the initial auction so the player should cost less. Throughout the season, you can monitor players off to fast starts and check FanGraphs to know when those small sample sizes can start to be taken seriously.


Alex Wood Poised to Be NL Version of Chris Sale

As the Braves enter the 2015 season, the roster is expected to be extremely pitching-heavy. In John Hart’s first offseason as the Braves’ President of Baseball Operations, he has made two huge moves by sending outfielders Justin Upton and Jason Heyward to the Padres and the Cardinals, respectively. While the return in the Upton trade was primarily made up of lower level prospects at least a few years away from helping the big club, the Braves did land RHP Shelby Miller in the Heyward/Cardinals trade. Although the Braves lost two key pieces to the offense, the pitching staff could be very strong, especially if Miller can bounce back to 2013 form (3.06 ERA, 3.67 FIP). Miller will join a rotation that returns three starters in Julio Teheran, Mike Minor, and Alex Wood. 

Minor enters the 2015 season in a very similar situation to Miller’s. After a breakout year in 2013 (3.21 ERA, 3.5 WAR), Minor was worth just 0.2 wins in 25 starts in 2014. While Teheran is considered to be the budding star ($32M contract extension and a 3.2 WAR for his age 23 season), Wood could be the pitcher that steals the show.

Following a three-year stint at the University of Georgia (one of which shortened by Tommy John surgery), the Braves drafted Wood in the 2nd round of the 2012 draft. Wood would go on to make his MLB debut less than one year later, after starting just 23 minor league games. Wood would appear in 16 games as a reliever, before transitioning into a starting role in the second half of the 2013 season. Wood’s final numbers for his age-22 season looked very similar to those numbers of another funky-delivering 22-year-old southpaw, Chris Sale:

Pitcher    Inn          K/9          BB/9        GB%        FIP

Sale            71            10.01        3.42           49.7%         3.12

Wood        77.2         8.92          3.13           49.1%         2.65


Unlike Wood, Sale spent the entire 2011 season working out of the bullpen, and had even pitched in 23 innings in the 2010 season, joining Chicago’s bullpen less than two months after signing with the White Sox. Following Sale’s strong 2011 season, the White Sox decided it was time to move Sale to the rotation. The Braves had similar plans for Wood in 2014, although the club planned to limit his innings in his first full year with Atlanta, and Wood would only make 24 starts for the season, along with 11 more relief appearances. For the age-23 seasons, the numbers look very similar, yet again:

 Pitcher    Inn          K/9         BB/9       GB%        FIP

 Sale            192           9.0            2.39          44.9%       3.27

Wood         171.2         8.91          2.36          45.9%       3.25

Another key factor for both pitchers is the durability later in the season. While many young pitchers wear down later in the year, both pitchers got stronger as the year went on. Sale’s strikeout numbers increased (9.41 to 10.64), and his walks and FIP saw a significant decrease as well. The same would hold true for Wood, as his K/9 rate went from a first half 8.61 to a second half 9.21, with a decrease in walks and a 3.05 second half FIP. The midseason move to the pen (to help limit innings) could have given Wood a fresher arm for his full-time return to the rotation in the second half, but whatever the reason may be, he was one of the top NL starters down the stretch.

As for Sale, his improving performance went well beyond the second half of the 2012 season, as the lefty would go on to post back-to-back 5+ WARs over the next two seasons, as well as finishing in the top 5 for the AL Cy Young Award in both 2013 and 2014. The key for Sale was his ability to continue to improve his strikeout numbers, while also cutting down on his walks. Sale’s 1.97 BB/9 over the last two years has been good for 7th among all American League starters. During that same time frame, Sale’s 10.06 K/9 rate trailed only Yu Darvish and Max Scherzer. Only 14 pitchers were able to top Wood’s 3.25 FIP as well as his his 3.78 K/BB in 2014. If he can push the FIP closer to 3.00, as well as the K/BB over 4.00, we could be looking at another Chris Sale.


Big Winners of the Offseason So Far: AL

As all of baseball convened in San Diego this past week, there were a lot of holes to fill. There are some teams that have been very active in free agency and trades over the past weeks and this article means to look at three teams in the American League that have enhanced their rosters over that span of time.

These teams did not make the playoffs in 2014 and they added players that may make them playoff caliber teams in 2014.

CHICAGO WHITE SOX
2014 Regular Season Record (73-89)

There has been a lot of pressure on the White Sox to build a winner as the Detroit Tigers and Kansas City Royals have made the World Series in the past three years and the Cleveland Indians made the playoffs in 2013. The White Sox made a couple big splashes this offseason to boost their profile in the AL Central.

A bit before the Winter Meetings, they inked Adam LaRoche to bolster their weak lineup and provide left-handed power to match Jose Dariel Abreu’s right-handed power in the middle of the lineup. LaRoche has averaged 27 home runs per 162 games in his career and twice in the past three years has had an OPS over .800. LaRoche may not be an All-Star caliber player, but, other than an awful 2011, LaRoche has consistently been a strong performer with an OPS+ of 114 for his career.

The White Sox have an ace in Chris Sale, with a 9.8 K/9 and a 2.76 ERA since entering the league in 2010. He had a 2.17 ERA over 26 starts last season, but the Sox needed a second top pitcher to compliment Sale in the rotation. They did just that by moving prospect Marcus Semien, along with other minor league prospects, for Jeff Samardzija. The 29 year old veteran has struck out 200 or more batters in each of the past two years and posted a sub-3.00 ERA last season. His ERA went up and strikeouts went down as he went from the Cubs in the National League to the Athletics in the American League, but did see his WHIP drop strongly to beneath 1.00 and struck out 99 while walking only 12. The White Sox now have two top-25 starters coming into the 2015 season, as Sale will be top-5 starter and Samardzija will comfortably sit in the 22-24 range.

The White Sox needed some help in the bullpen as Zach Putnam or Jake Petricka were set to be the closer for 2015, so they dipped into their pockets, signing two former All-Stars to multi-year contracts. Zach Duke signed a bit before Winter Meetings and the former All-Star starter has a 2.20 ERA in his last 88 appearances and the White Sox needed a left-handed relief option as the entire bullpen was right handed before signing Duke. The big splash for the White Sox, though, was signing former Yankee All-Star closer David Robertson. Since 2011, Robertson has a 12.3 K/9 and from 2011-2013, had no higher than a 2.67 ERA. He only has 46 saves in his MLB career, as he was the setup man for Mariano Rivera coming into 2014. But Robertson had 39 saves last year, and has seen his BB/9 go from 4.7 in 2011 to a 2.8 average from 2012-2014. Duke will provide left-handed relief help that the White Sox were devoid of and Robertson will be the All-Star caliber closer that the White Sox have been without since Bobby Jenks left.


TORONTO BLUE JAYS
2014 Regular Season Record (83-79)

The Blue Jays play in the most active division and have been active in the market. They signed a Gold Glove caliber catcher, an MVP candidate at third base, and freed up space on the roster for a top prospect.

Russell Martin is a highly underrated player who is very strong in intangibles, like his blocking of pitches and elite game calling skills, and will bring his veteran experience to Toronto. Martin’s game calling abilities are well known; his catching abilities will enhance the entire Blue Jays staff, as he led a Pirates staff to back-to-back playoffs with top five ERAs in each season. Martin may never steal double-digit bases again, as he did each season from 2006 to 2009, but he had a .832 OPS last year and hit 39 home runs in his two previous seasons in the AL East, both with the Yankees. His .402 OBP of 2014 may be a bit of a misnomer of his abilities; he had a .332 OBP in the previous five seasons, but he will have much more than 45 runs as a top of the lineup hitter in a lineup with three MVP candidates behind him. Martin may be in a lineup with MVP caliber talent, but could end up being the most vital piece of a playoff run for the Blue Jays.

Josh Donaldson is the newest MVP candidate in the Blue Jays lineup, adding to the already formidable combination of Edwin Encarnacion and Jose Bautista. The Blue Jays had to trade three prospects and starting third baseman Brett Lawrie to get Donaldson, but Donaldson is well worth the investment. He has been the starting third baseman for the Athletics for two years and over that time he hit 53 home runs and was a top-10 MVP finisher in both 2013 and 2014. Donaldson broke out in 2013 with a .883 OPS and 64 XBH and had a bit of a letdown in 2014; he still finished with 29 home runs and 98 RBI in 2014, even though he struck out 20 more times and saw his OPS drop to .798.  There are not many power hitting third basemen in baseball and the Blue Jays are fortunate to have Donaldson, a top five 3B option.

The Blue Jays saw a couple needs in the offseason and two were filling a gap in the outfield left by free agents Melky Cabrera and Colby Rasmus, as well as finding a place in the rotation for top prospect Daniel Norris. By trading fifth starter J.A. Happ for Michael Saunders, and allowing Norris to slide into the rotation, both gaps were filled. Norris is the #25 ranked prospect according to MLB.com, with a 2.53 ERA last year and a 10.7 K/9 over his three minor league seasons. He may struggle a bit earlier in the season, but he could have a similar impact to 2014 rookie star Marcus Stroman with his power fastball and a strong slider/changeup combination. Norris may not have a huge impact to start the season, but could be an impact player later in the season.

Saunders was a bit undervalued in Seattle, but has a very interesting profile. He slots into the bottom of the projected Blue Jays lineup and has a little bit of a better profile than the man he is replacing, Colby Rasmus. Saunders is a very good defensive outfielder, but has had two seasons with more than 10 home runs and steals, while also posting three consecutive seasons with an OPS above league average. The only season where Saunders had 500 or more at bats, 2012, he posted 19 home runs and 21 steals; his OBP has risen from .306 in 2012 to .341 in 2014, so there is potential for Saunders to be even better with more opportunity in Toronto. Saunders was obtained for a very movable piece in Happ; if the Blue Jays are able to fill a major need in the outfield and only have to give up a fifth starter to do so, this would be a huge victory for the Blue Jays.


BOSTON RED SOX
2014 Regular Season Record (71-91)

The 2013 champion Red Sox bore no resemblance to the 2014 team that finished last in the AL East. As the Red Sox are a financial juggernaut, they were able to flex their muscles adding two former All-Stars and then traded for two All-Star pitchers in San Diego.

Pablo Sandoval has been an instrumental part of three Giants World Series and, after disappointment from Will Middlebrooks, will bring his talents to the Red Sox in 2o15. Much has been written about Sandoval’s streaky play and his free swinging ways, but Sandoval is a .294 hitter over his seven MLB seasons and averaged 44 extra base hits over the past four seasons. The switch hitting Sandoval will get a serious boost from the left side by hitting doubles off of the Green Monster; this is a needed boost as Sandoval has not had 30 or more doubles in a season since back-to-back 30 double seasons in 2009 and 2010. Only once in his career has Sandoval had more than 80 RBI and twice has he had 20 or more home runs; Sandoval’s value comes from his postseason experience and is a top 15 3B in a weak 3B crop.

Rick Porcello was a top prospect coming through the Tigers system, but really never broke through as a stable pitching option until his 15 win 2014 season where he had a 3.43 ERA. The Red Sox need a lot of pitching help, as they finished 10th in the AL in ERA, and Porcello’s ground ball tendencies may fit the Red Sox well. Xander Bogaerts will be more prepared at shortstop this season and Dustin Pedroia‘s defense up the middle will absolutely suit Porcello’s skills. Porcello is coming off of his first 200 inning season and has seen his WHIP go from 1.41 in his first four seasons to 1.25 in the last two seasons. He has seen his K:BB ratio rise over 3 as well and he is only 26 years old going into his seventh MLB season. That experience should be great for him coming into the grinder that is the AL East. Porcello has a career FIP that is 30 points less than his career ERA, showing that the talent is there for Porcello; look for him to breakthrough as an All-Star caliber pitcher this year.

Hanley Ramirez was the top hitter available and has been one of the most polarizing players over the past five seasons. Coming into 2010, he was the top fantasy baseball prospect, but saw his OPS go from .853 in 2010 to .742 combined in 2011 and 2012; he then posted a .907 OPS in 2013 and 2014, including a white hot 1.040 OPS in 88 games of 2013. Ramirez has twice before been a 50+ SB player and led the NL in BA in 2009, so the talent is there. But Ramirez has averaged only 121 games played since 2010 and has had two seasons where he played in less than 100 games.

Ramirez will also move to left field this season which should be a very interesting move for fantasy purposes; had Ramirez stayed at third, or even shortstop, he may have been a third round pick, but as an outfielder it is very questionable. There is a chance that Ramirez has less wear and tear in the outfield and becomes a top-10 hitter again, but a .282/.358/.467 slashline in the outfield is not worthy of a top-10 OF spot. A lot will be expected from Ramirez, but this may be the season that he is able to play 150 games of All-Star caliber play in the outfield, regaining his reputation as an MVP candidate.


Using Gifs to Visualize Curveballs on the Scouting Scale

After reading Kiley McDaniel’s articles on explaining the scouting scale, I thought that I would take a different approach in trying to explain it–namely the approach of gifs.  Although the scale is normally reserved for players who haven’t lost their rookie status in the majors, perhaps a visualization can better illustrate what “major league average,” “plus,” or “below average” looks like.

To show the differences between curveballs in different positions along the scouting scale, major league curveballs must first be graded.  To do this, I pulled up Baseball Prospectus’ pitch f/x leaderboard and set it to filter for pitchers who threw at least 100 curveballs in 2014.  The way in which pitch movement is measured and the fact that lefties’ curveballs’ horizontal movement appeared to be measured lower than righties forced my methodology.

I split up righties and lefties into separate groups for analysis.  Pitch movement was recorded based on the inches a pitch broke more than the the pitch with the least break.  Total movement was recorded as the square root of the combined horizontal and vertical movement squares (C2 = A2 + B2).  Z Scores were recorded for each curveball’s velocity and movement, and then were added (with movement receiving a 1.5 times greater weight) to form a grade.  The grades were then transferred into Z Scores with a median of 50 and each standard deviation being 10.  Finally, the righties and lefties were combined to make a final scouting scale.

Name / Throws / Total Movement Z Score / Velocity Z Score / Scouting Grade

Garrett Richards R 2.081 0.289 73.4
Drew Pomeranz L 0.882 1.398 69.0
Tyler Skaggs L 1.757 0.047 68.8
Blaine Hardy L 1.356 0.410 67.1
Gio Gonzalez L 1.406 0.317 66.9
Alex Cobb R 0.907 0.948 66.0
Roenis Elias L 0.949 0.771 65.3
Sonny Gray R 0.589 1.187 64.4
Jarred Cosart R 1.125 0.289 63.8
Felix Hernandez R 0.812 0.712 63.5
Jake Arrieta R 0.972 0.428 63.2
Charlie Morton R 1.191 0.066 63.0
Carlos Torres R 0.973 0.350 62.7
Craig Kimbrel R -0.474 2.430 62.1
Sean Marshall L 1.795 -0.970 62.0
Yoervis Medina R -0.471 2.330 61.5
Joe Kelly R 0.852 0.341 61.4
Mark Melancon R 0.312 1.116 61.2
Stephen Strasburg R 0.633 0.612 61.0
Justin Grimm R 0.404 0.915 60.8
Robbie Erlin L 1.711 -1.022 60.7
Jamey Wright R 0.958 0.057 60.6
Adam Wainwright R 1.731 -1.106 60.6
Wandy Rodriguez L 1.401 -0.639 60.1
Kevin Jepsen R -0.315 1.861 59.9
Jeremy Hellickson R 1.367 -0.664 59.9
Clay Buchholz R 1.007 -0.166 59.6
Scott Atchison R 0.429 0.683 59.5
Will Harris R 0.538 0.518 59.5
Michael Bolsinger R 0.524 0.521 59.3
John Axford R 0.857 0.015 59.3
David Robertson R -0.245 1.619 59.0
Jeremy Affeldt L 1.197 -0.497 59.0
Ian Kennedy R 0.943 -0.186 58.8
Yu Darvish R 0.941 -0.182 58.8
Eric Surkamp L 0.624 0.320 58.7
Nick Masset R 0.680 0.182 58.6
Tom Koehler R 0.551 0.360 58.5
Marcus Stroman R -0.189 1.455 58.4
Zack Wheeler R 0.604 0.263 58.4
Jose Fernandez R -0.255 1.532 58.3
Scott Downs L 1.405 -1.064 57.2
Edinson Volquez R 0.240 0.609 57.1
Felix Doubront L 1.093 -0.629 56.9
Juan Gutierrez R 0.110 0.744 56.7
Jesse Chavez R 1.076 -0.731 56.5
Jeremy Jeffress R 0.264 0.476 56.4
Danny Duffy L 0.446 0.272 56.4
Cody Allen R -1.180 2.630 56.4
Mike Leake R 0.210 0.515 56.2
Dellin Betances R -0.552 1.635 56.0
Trevor Bauer R 0.416 0.147 55.8
Jose Veras R 0.924 -0.638 55.6
Adam Warren R -0.220 1.022 55.2
Clayton Kershaw L 1.119 -0.906 55.2
Chris Tillman R 0.987 -0.828 55.0
Cole Hamels L 0.142 0.517 54.9
Miles Mikolas R 1.158 -1.093 54.9
Jeff Locke L 0.268 0.317 54.9
Gerrit Cole R -0.845 1.884 54.7
Josh Fields R 0.233 0.257 54.7
Nick Tepesch R 0.370 0.018 54.4
Brandon Workman R 0.743 -0.544 54.4
Carlos Carrasco R -0.275 0.954 54.2
Cesar Ramos L 1.941 -2.290 54.2
Tom Wilhelmsen R 0.309 0.034 53.9
Jenrry Mejia R 0.117 0.308 53.9
Trevor Cahill R 0.202 0.153 53.7
Odrisamer Despaigne R 0.813 -0.770 53.6
Collin McHugh R 1.350 -1.635 53.2
Jesse Hahn R 1.150 -1.345 53.2
Phil Hughes R 0.573 -0.502 53.0
Samuel Deduno R -0.389 0.906 52.8
Brett Cecil L -1.373 2.483 52.8
Ian Krol L -0.094 0.555 52.7
Wade Davis R -1.260 2.184 52.6
Jordan Zimmermann R -0.034 0.308 52.3
Andre Rienzo R 0.052 0.170 52.3
Junichi Tazawa R 0.731 -0.857 52.2
Jason Hammel R 0.477 -0.512 52.0
Wesley Wright L -0.302 0.764 52.0
Mike Fiers R 1.376 -1.890 51.8
Nathan Eovaldi R 0.542 -0.644 51.8
Alex Wood L -0.385 0.851 51.7
Jake Buchanan R 0.570 -0.709 51.6
Dillon Gee R 0.926 -1.261 51.5
Trevor May R 0.298 -0.328 51.4
David Buchanan R 0.247 -0.263 51.3
Hyun-jin Ryu L 1.074 -1.395 51.3
Rick Porcello R 0.171 -0.189 51.1
Yordano Ventura R -1.045 1.603 50.9
Anthony Ranaudo R 0.136 -0.195 50.7
Aaron Loup L -0.110 0.282 50.6
Brad Hand L -0.491 0.851 50.6
Brandon McCarthy R -0.757 1.116 50.5
Will Smith L -0.282 0.526 50.5
Vidal Nuno L 0.094 -0.043 50.5
Justin Verlander R -0.301 0.415 50.4
Tommy Hunter R -1.053 1.539 50.4
Santiago Casilla R -0.726 1.038 50.3
Brad Peacock R 0.257 -0.447 50.2
Madison Bumgarner L 0.013 0.043 50.2
Fernando Abad L -0.223 0.397 50.2
C.J. Wilson L 0.077 -0.066 50.1
Francisco Rodriguez R 0.334 -0.586 50.1
A.J. Burnett R -0.847 1.167 49.9
Erik Bedard L 0.572 -0.842 49.9
Tanner Roark R 0.889 -1.455 49.8
Kevin Quackenbush R 0.264 -0.531 49.7
Casey Janssen R 0.767 -1.287 49.7
Yovani Gallardo R -0.366 0.376 49.5
Matt Cain R -0.007 -0.173 49.4
Cory Rasmus R 0.332 -0.683 49.4
J.P. Howell L -0.488 0.652 49.2
Shelby Miller R 0.046 -0.328 48.9
Joba Chamberlain R -0.417 0.331 48.7
Mike Minor L -1.028 1.373 48.6
Lance Lynn R -0.505 0.441 48.5
Josh Beckett R 0.835 -1.587 48.4
Daisuke Matsuzaka R 0.510 -1.109 48.3
Chase Anderson R -0.043 -0.318 48.1
Jorge De La Rosa L 0.397 -0.845 48.0
Danny Farquhar R 0.214 -0.725 47.9
Nick Martinez R 0.107 -0.599 47.7
Jerry Blevins L 0.348 -0.825 47.6
Matt Garza R 0.444 -1.141 47.5
Franklin Morales L 0.340 -0.874 47.2
Craig Stammen R -0.732 0.563 47.1
Javy Guerra R -0.179 -0.266 47.1
Scott Feldman R 0.326 -1.041 46.9
Anthony Varvaro R -0.810 0.638 46.8
Hector Noesi R -0.910 0.741 46.5
Miguel Gonzalez R -0.144 -0.428 46.3
John Lackey R -0.520 0.128 46.3
Kevin Correia R -0.427 -0.015 46.3
Kyle Kendrick R -0.313 -0.186 46.3
Tyler Thornburg R -0.364 -0.118 46.2
Colby Lewis R -0.216 -0.344 46.2
Donn Roach R 0.008 -0.683 46.2
Tim Lincecum R 0.226 -1.022 46.1
Chris Capuano L -0.013 -0.507 46.0
Josh Tomlin R -0.062 -0.618 45.9
J.A. Happ L -0.568 0.275 45.7
James Paxton L -1.519 1.643 45.3
Vance Worley R -0.360 -0.289 45.1
J.J. Hoover R 0.093 -0.973 45.1
Tim Hudson R 0.007 -0.854 45.0
Wei-Yin Chen L 0.065 -0.809 44.7
Marco Estrada R -0.419 -0.286 44.5
Kyle Lohse R 0.091 -1.109 44.1
Vic Black R -1.482 1.248 44.1
Gavin Floyd R -1.285 0.951 44.1
Bruce Chen L 0.405 -1.421 44.0
Phil Coke L -1.232 1.003 43.8
Jon Lester L -0.249 -0.478 43.7
Paul Maholm L 0.340 -1.492 42.8
Jose Quintana L -1.420 1.134 42.7
David Phelps R -1.211 0.622 42.7
Zach Duke L -0.491 -0.288 42.5
Brett Oberholtzer L -1.197 0.751 42.4
Homer Bailey R -1.197 0.538 42.2
Jon Niese L -0.078 -0.954 42.2
Alfredo Simon R -0.751 -0.179 41.9
Jim Johnson R -1.275 0.605 41.9
Zack Greinke R 0.308 -1.903 41.0
Scott Carroll R -0.685 -0.431 40.9
Jason Vargas L -0.469 -0.562 40.8
Travis Wood L 0.088 -1.443 40.5
Heath Bell R -1.696 0.948 40.0
David Price L -1.564 0.954 39.9
Doug Fister R 0.071 -1.726 39.8
Jordan Lyles R -1.731 0.961 39.7
Michael Wacha R -0.378 -1.112 39.4
Masahiro Tanaka R -0.204 -1.413 39.2
Joel Peralta R -1.008 -0.208 39.2
James Shields R -1.514 0.518 38.9
Jake Odorizzi R 0.579 -2.759 38.0
Andrew Heaney L -1.515 0.568 37.7
Max Scherzer R -1.307 -0.163 36.5
Anibal Sanchez R -1.676 0.357 36.2
Julio Teheran R -0.450 -1.539 35.9
Scott Kazmir L -1.244 -0.124 35.7
Yusmeiro Petit R -1.253 -0.402 35.4
Mat Latos R -1.151 -0.586 35.2
Jacob deGrom R -1.879 0.473 35.0
Tommy Milone L -0.975 -0.626 35.0
Joe Nathan R -2.412 1.271 35.0
Edwin Jackson R -1.821 0.370 34.9
Matt Shoemaker R -1.126 -0.802 34.0
Drew Smyly L -1.762 0.330 33.4
Dan Haren R -1.545 -0.292 33.2
Hector Santiago L -1.609 0.069 33.2
Grant Balfour R -2.631 1.274 32.8
Ryan Vogelsong R -1.631 -0.405 31.6
Mark Buehrle L -0.593 -1.691 31.5
Erasmo Ramirez R -2.280 0.528 31.3
Jeremy Guthrie R -1.384 -0.854 31.1
Jacob Turner R -2.033 0.102 31.0
Hiroki Kuroda R -1.637 -0.528 30.7
Johnny Cueto R -2.591 0.880 30.6
Jake Peavy R -2.414 0.573 30.3
Josh Collmenter R -0.839 -1.884 29.7
Sam LeCure R -1.215 -1.461 28.7
Bronson Arroyo R -1.320 -1.416 28.0
Aaron Harang R -1.461 -1.319 27.2
John Danks L -1.548 -1.051 25.9
Eric Stults L -0.448 -2.837 24.9
Fernando Salas R -3.656 1.613 24.8
Carlos Villanueva R -2.102 -0.718 24.8
Jered Weaver R -0.725 -2.840 24.4

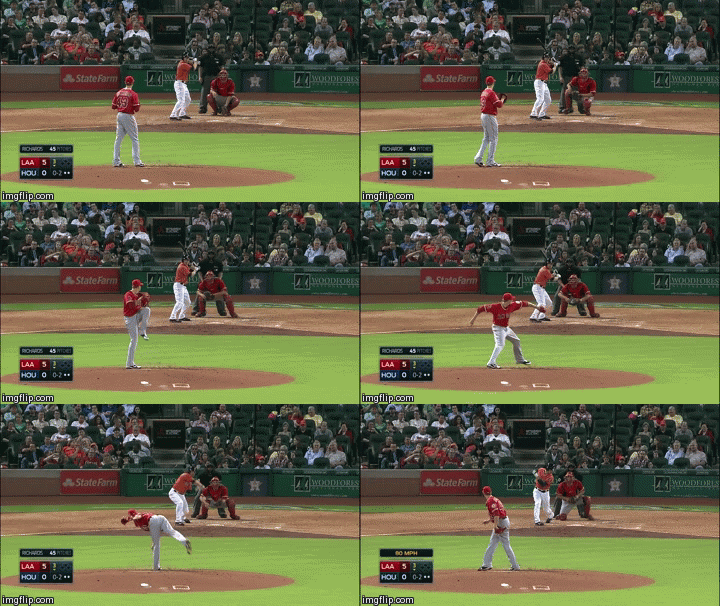
For our first gifs, we’ll look at two of the top curveballs on the by-the-numbers scouting scale.  At an slightly above average velocity of 79.7 mph with the highest amount of break above than the baseline (sorry, Fernando Salas), Garrett Richards’ curveball is a sight to behold and grades out as a 73:

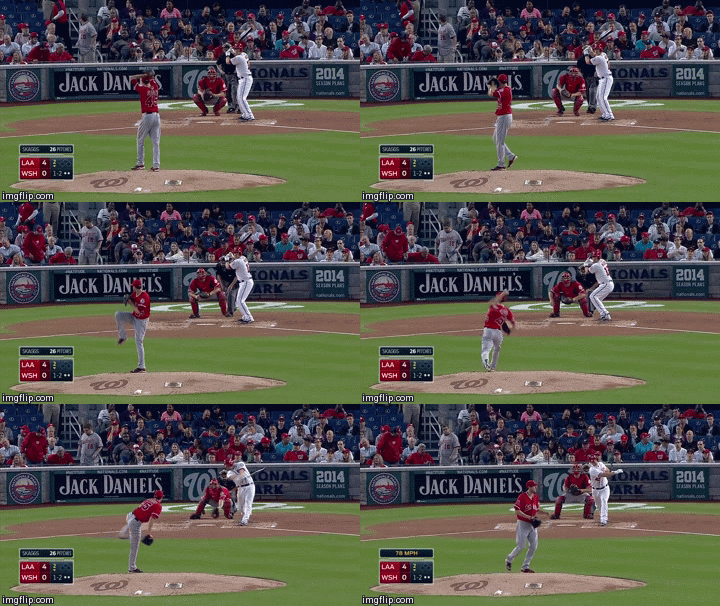
Next, we’ll look at Tyler Skagg’s curveball, which, features great horizontal and vertical movement while maintaining average velocity.  It grades out as a 69:

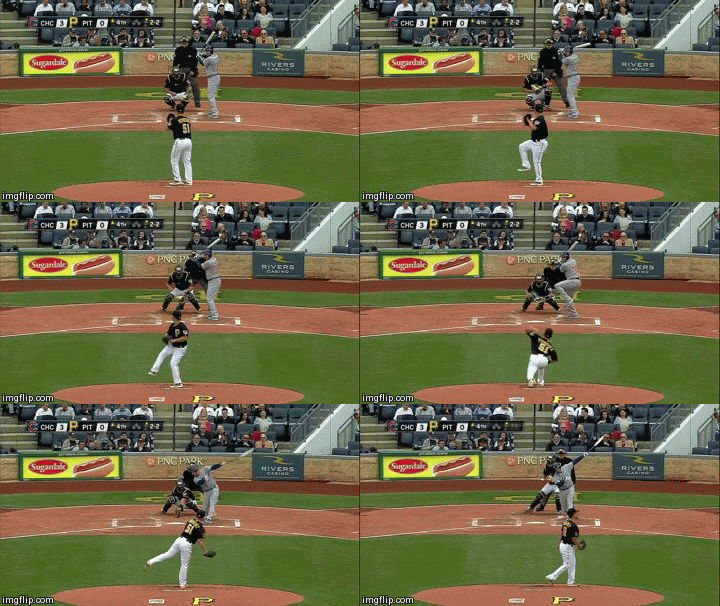
With the plus-plus-type (70) curveballs out of the way, we’ll take a look at some plus (60) curveballs.  Wandy Rodriguez fits this category.  His curveball has slightly less, but similar, movement as Skagg’s but it’s lesser velocity makes it a lesser-quality pitch.  Notice how it has defined break, but it appears a bit loopy due to its velocity:

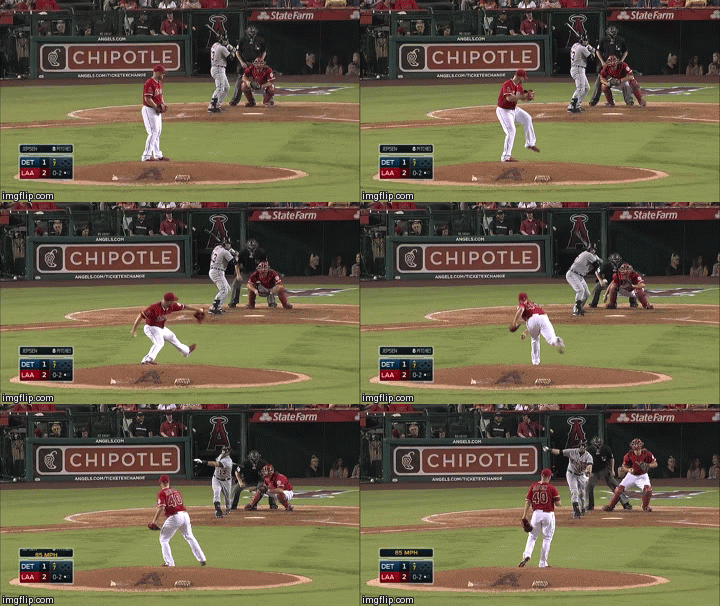
With Kevin Jepsen, we see a curveball that is graded similarly but looks much different than Wandy’s.  Although its break looks sharp because of its velocity, the total movement is slightly below average.  This pitch may actually be a slider, but Jepsen’s breaking pitches tend to run together so consider it a representative picture of his curveball.

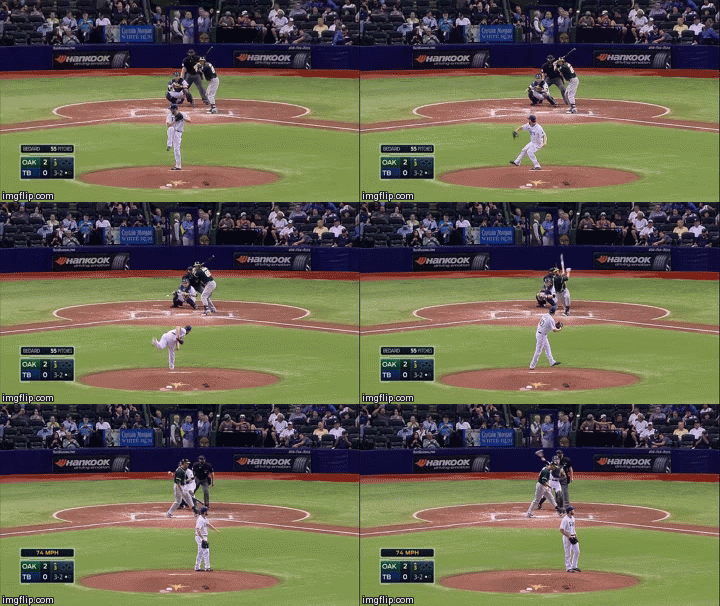
Next, we’ll look at an average (50 on the scale) curveball.  Erik Bedard gets slightly above average break, but with below average velocity.  It has solid two-plane break, but it doesn’t look very sharp:

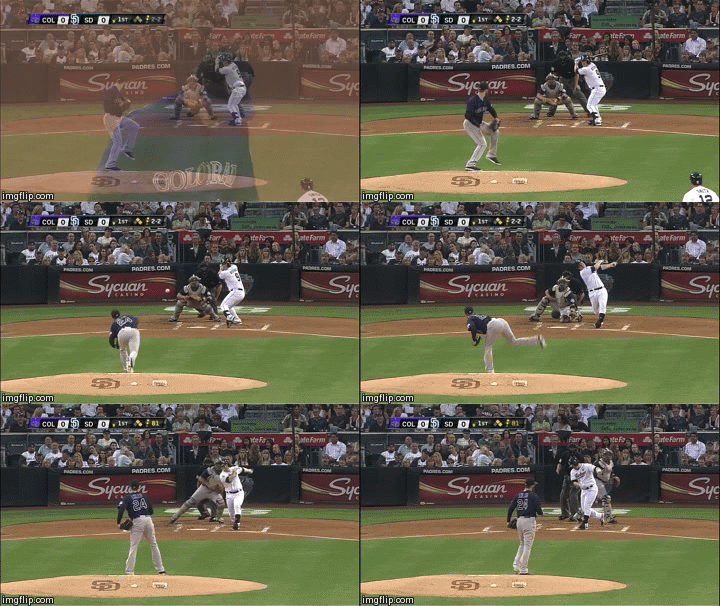
Next, we’ll look at a below average (40 on the scale) curveball.  Jordan Lyles has good velocity on his curveball, averaging 81.75 mph, but he also averages nearly two standard deviations less break than an average curveball in this sample.  The following is a tough angle to see the break, but it lacks the sharp break of a better curveball.

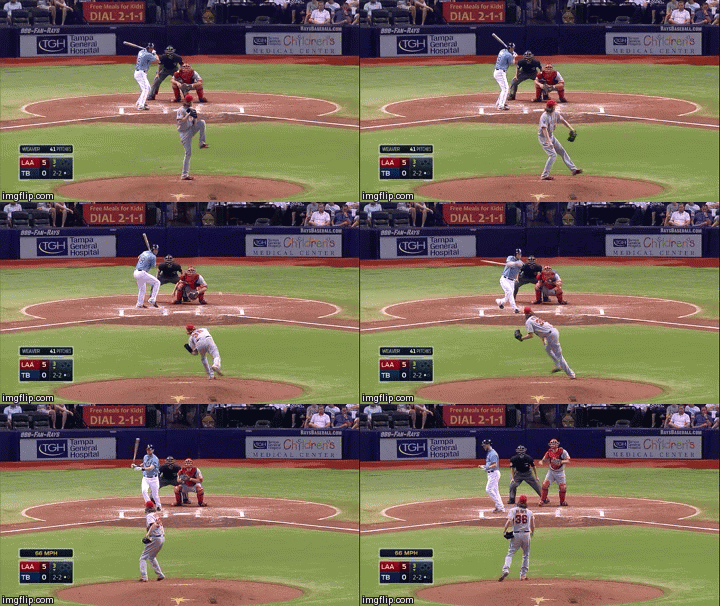
Finally, we’ll look at Jered Weaver’s well below average (24 on the by-the-numbers scale!) curveball.  His curveball was the slowest in the sample and also featured below average break (much of the perceived break is from its low velocity).  It’s still an effective pitch for him, but it’s probably a result of his height and delivery combination than his curveball.  With just about any other pitcher, it would likely be ineffective.


Seth Smith Would Be Great Fit for Mariners

With Wil Myers headed to San Diego, and only a clean bill of health keeping Matt Kemp from joining him (which may or may not magically appear of LA is willing to pay a larger portion of Kemp’s remaining $105 million on his contract…), the San Diego Padres find themselves with an opportunity to move 2014 right fielder Seth Smith. Kemp’s days as an everyday center fielder have long passed, and Myers is likely better suited for a corner outfield spot as well. This leaves nowhere to play Smith, and the Padres could deal Smith to acquire some help at a spot other than the corner outfield.

The biggest issue with Smith has always been his splits. No matter how you slice it, Smith should relegated to a platoon role.

Smith’s splits:

                  RHP          LHP

wRC+     123              63

wOBA   .362            .274

ISO         .204           .109

A team that has been in the hunt for a corner outfielder this offseason is the Seattle Mariners. So far we’ve seen Seattle add Nelson Cruz to serve as the everyday DH, and over the past month we’ve seen the Mariners linked to names like Melky Cabrera, Dayan Viciedo, Justin Upton, and Kemp. The big hangup with Kemp, as well as Upton, was the issue with teams trying to pry away young pitchers like Taijuan Walker and James Paxton. Fortunately for the M’s, a player like Seth Smith would not cost them these young arms.

With Kemp and even more cash expected to head to San Diego, Upton will likely become the top corner outfielder available this offseason. Upton has just one year remaining on his current contract, and will make nearly $15 million in 2015. Meanwhile, Smith will make nearly $13 million over the next two years, and his contract contains a club option for the 2017 as well. Now we all know that Justin Upton is a better baseball player than Seth Smith, but is one year of Upton (and no Walker or Paxton for the next 6 years) better than two years of Smith and Justin Ruggiano (with Walker and Paxton still in Seattle for the next 6 years)?

Earlier this week, the Mariners acquired Ruggiano from the Cubs for minor league reliever Matt Brazis. Ruggiano is two years removed from a career year in Miami, in which he posted a 2.6 WAR in just 91 games. Even though his WAR over the last two seasons combined for just 1.3, he still profiles as an excellent platoon player. In 2013, Ruggiano posted a 130 wRC+ vs LHP, as well as a .362 wOBA. For 2014, Ruggiano’s numbers were nearly identical, posting a 129 wRC+ and a .362 wOBA vs LHP. Take a look at the career numbers below, with Smith and Ruggiano’s being their career splits:

                     Upton     Smith     Ruggiano

wRC+         121            123           128

wOBA        .359         .362          .360

ISO             .202         .204          .241

Whether or not the Mariners add Justin Upton, or Seth Smith, or go with some sort of Brad Miller/Ruggiano platoon that we’ve seen rumored, they will get solid production from that right field spot. Smith would cost them some value, and the Smith/Ruggiano platoon may not be the sexiest, but Smith would not cost them a Walker or Paxton.


Under the Radar: John Mayberry

Amidst the expensive December fireworks being set off by Andrew Friedman and Theo Epstein, the cash-strapped New York Mets quietly took another step towards correcting a major 2014 deficiency with the addition of John Mayberry for $1.45 million.

Removing the historically bad hitting performance of their pitching staff (they started the season with a major league record 0-for-64), the often maligned Mets lineup actually generated a respectable 104 wRC+ against right-handed pitching in 2014, good enough for 5th best in the National League.

Their offense vs. left-handed pitching was another story however as an 89 wRC+ (14th NL) and 22 HR (MLB worst) left the Mets scrapping to find runs in the late innings of games against deep lefty-heavy bullpens.  Leading the struggles vs lefties were Eric Young Jr (84 PA, 60 wRC+), Lucas Duda (125 PA, 54 wRC+), and Chris Young (83 PA, 51 wRC+).

I prepared for this first FanGraphs Community article of mine by studying Mayberry a little closer.  As a fan who has witnessed plenty of NL East action over the years, I was well aware of Mayberry’s established platoon splits.  What I wasn’t aware of was the massive amount of growth he had in 2014.

John Mayberry Splits vs LH Pitching

2011 – 6.7 BB%, 15.0 K%, 0.44 BB/K, .288 ISO, .306 BABIP, 157 wRC+
2012 – 5.6 BB%, 17.8 K%, 0.32 BB/K, .223 ISO, .289 BABIP, 116 wRC+
2013 – 7.4 BB%, 15.7 K%, 0.47 BB/K, .220 ISO, .244 BABIP, 106 wRC+
2014 – 13.4 BB%, 12.2 K%, 1.10 BB/K, .329 ISO, .214 BABIP, 151 wRC+

After 3 seasons with respectable peripherals, Mayberry took his platoon game to another level in 2014 with career-best numbers across the board except for an inexplicable .214 BABIP.  Over 534 career plate appearances against LHP, Mayberry carries a .269/.324/.533, 30 HR, 130 wRC+.

In addition to Mayberry is the aggressively acquired Michael Cuddyer (career 132 wRC+ vs LHP), and the Mets are now in position to be significantly strengthened vs. left-handed pitching without making headlines or gutting their very deep farm system.