Archive for Uncategorized

Help With the Physics Behind PITCHf/x

I’ve been digging into the PITCHf/x data over the past few weeks and stumbled across something I can’t quite figure out. When I first started using the data, I didn’t realize that px and pz were where PITCHf/x is mapping the final location of the ball; undeterred I set out to Google to jog my memory on the basics physics formulae that can map time using initial velocity, final velocity, distance and constant acceleration.

Step 1 was to calculate final velocity for every pitch from -50 feet to 0 feet. This was a simple formula that is SQRT(vy0^2-2*50*ay). Initial velocity squared less acceleration * yo2 * distance. Based on y0 being 50 feet from home plate.

Step 2 was to calculate time based on initial velocity and final velocity. I cross-checked my numbers to using the Start_Speed and End_Speed (which don’t match up to to vy0 for some reason) and got basically the same number.

Step 3 was to calculate xFinal based on Time, ax and x0 (ditto for zFinal). Strangely, my zFinal was a little lower (about .17 feet) than the PITCHf/x pz value and .015 more to the right than the px value. That might mean that they are measuring z and x 50 feet from release point, rather than at home plate.

I need to know if (a) my math is wrong (b) pz and px are wrong (c) ax and az are wrong.

Any help would be appreciated!


BatCast: Bat Flip Tracker

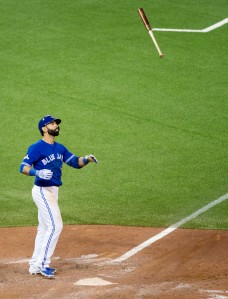
I love bat flips. I would have no problem if bat flips became a more theatrical experience. By the power of inference, or by simply reading the first sentence, I’m certain you can accurately predict how I feel about Jose Bautista’s bat flip.  While anyone with an incorruptible soul has been nobly spewing self-righteous significations about how disrespectful Bautista’s bat flip was, I’ve been primarily concerned with one thing: the trajectory of that bat flip. It was a huge exclamation point on a huge moment and it was a pretty significant departure from more “conventional” bat flips.

Most bat flips do not exceed shoulder height. Think about the bat flips that you have mimicked the most in your life.  For me it’s been Griffey Jr,  SosaMcGwire, Ortiz, and McGriff. One could argue that what those players possessed were, by definition, closer to bat drops rather than flips, but you’ll still find these players featured in various “best of bat flips” videos on YouTube. Bautista’s bat flip diverges from the norm immediately upon release, in that it actually started at his shoulders. While this is awesome, it didn’t break new ground. Yasiel Puig flips his bat from above his head on fly outs and triples. Yoenis Cespedes had a triumphant bat flip of his own on Monday night, but for a superabundance of reasons that you already know, Bautista’s bat flip has hogged the limelight. In lieu of this, we’ll focus on breaking down Bautista’s bat flip into some tangible numbers and simply apply that same method to Cespedes’ for a comparison.

MLB debuted Statcast this year, and among its nifty features was the home run tracker. The home run tracker allowed viewers at home to process new data on home runs — specifically, exit velocity, the angle of the home run, and distance. The data I’m about to bring to you is based on this exact premise, but it studies the bat flip.  BatCast: The Bat Flip Tracker™.

Disclaimers:

  1. There is no ™ on BatCast, I just thought it was funny and hope that it’s not illegal to falsely claim a copyright.
  2. I am not an engineer, mathematician, or a numerically-inclined vampire. The last math class I took was trigonometry during my junior year of high school 13 years ago.
  3. I’m about to present some very inexact numbers based on frozen images I’ve gathered from the internet to bring you the BatCast data on Jose Bautista’s bat flip.

Without further ado:

bautJOSE BAUTISTA

7th Inning – ALDS Game 5

Rangers @ Blue Jays

Score: 3 – 3

BATCAST

Initial Launch Velocity 14.63 mph (23.54 km/h)
Total Horizontal Distance 6′-6″ (1.98m)
Launch Angle 78.6 Degrees

Here is the freeze frame of the moment in time that somehow is already emblazoned across purchasable T-shirts. Following the majestic shot will be the explanation of the method I used to come up with the rough, ROUGH BatCast numbers (also featured in metric to honor the Blue Jays and the soil, or turf, of Canada where it all went down).

(Darren Calabrese/The Canadian Press via AP) MANDATORY CREDIT

You didn’t think I’d forget the GIF(s), did you? (GIF sources: FS1 + mlb.com) 1475063766308945444               101415_tor_bats_batflip_lowres_gjvlzoc9


The numbers:

Launch Height: 5′-2″ (1.57m)

Jose Bautista stands exactly 6′-0″ tall (1.83m). In the image I printed out and measured hastily, he is about 3.33″ tall. If you’re disappointed in my measurements already, I did warn you that it would be rough, and you have every right to stop reading. If we measure up to his shoulder/trap area, where he released the bat, we get 2.87″. After we apply some simple algebra: 3.33/2.87  =  72/x we come up with 62″ or 5′-2″ (1.57m) for the launch height. This also works with the idea that the head and neck comprise 10.75% of our total height.

Horizontal Distance: 6′-6″ (1.98m)

Bautista hurls the bat across his body with his left hand from his right shoulder, which at point of launch, was pretty much on the inside corner of home plate for a right-handed hitter. The bat lands just outside the left-handed batter’s box which we know is 4’ wide. Given that the plate is 17” wide and there is a 6” cushion between the batter’s box and the plate, we can estimate the horizontal distance that the bat traveled to be right around 6.5’ (1.98m).

Hang Time: 1.52 seconds

I derived this number from watching the video and using my phone as a stop watch.  After 10 runs, I had an average time of 1.52 seconds. There is no metric conversion for time (winky face).

Parabolic Trajectory Calculator

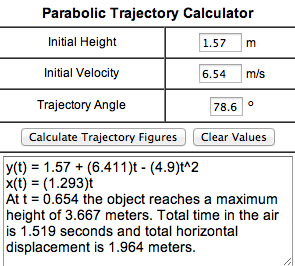
This online calculator was paramount to finding the rest of the data provided. Once I had the initial height, the hang time, and the horizontal distance, I tinkered with numbers for the initial velocity and trajectory angle until everything jived with the rough numbers I had figured.
trajectory

Launch Angle: 76.8 Degrees

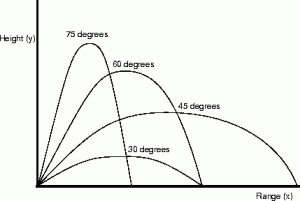
Jose launches this bat pretty tight to his body, as evidenced by where the bat lands (at the outside edge of the left-handed batter’s box).  A rough/convenient measurement of the launch angle gives us 76 degrees. But after manipulating the numbers in the calculator, we have a more accurate launch angle of 76.8 Degrees.


launch angle

Launch velocity: 14.63 mph (23.54 kmh) and Apex: 12′-0.36″ (3.67m)

I had actually tried to measure the apex using the same method I performed to figure the launch height, but it would be a disservice to us all had I used the 10.5′ number that produced. Jose Bautista flips the bat in such a manner that he would have thrown it over himself STANDING on top of himself – or twice his height. In the trade of bat flipping, this is probably considered light-tower power.


Cespedes vs Bautista

Using the same method let’s look at, what we can figure to be at least a pretty similar and recent comp.

First, Cespedes’ flip.

THIS_Cespedes_launches_NLDS_home_run_into_the_night

Yoenis Cespedes’ bat flip came in the 4th inning of game 3 of the NLDS with the score already 7 – 3 in favor of the Mets.  The tension in this game was obviously very high as the series was tied at 1 – 1, but circumstantial tension also built differently as there had been a day between this game and the game that saw the Utley v. Tejada incident.

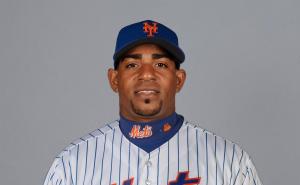
yoenisYOENIS CESPEDES

4th Inning – ALDS Game 3

Dodgers @ Mets

Score: 7 – 3

BATCAST

Initial Launch Velocity 12.08 mph (19.44 km/h)
Total Horizontal Distance 10’-8.1″ (3.254m)
Launch Angle 60 Degrees


yoenis

By the numbers, these are two fairly similar bat flips. What Cespedes’ flip lacked in height (8.5 ft; 2.6 m), it made up for in sheer distance (reference table above). But judged by context (inning, game, score), isn’t Cespedes’ bat flip actually more wrong? Of course I’m saying that with my tongue in my cheek – a bat flip is neither wrong nor right. A bat flip is really just like adding an exclamation point to a moment instead of a period. How would you write it?

Home Run.

or

Home Run!

Part II: (preachy commentary)

In the end, people only start talking about a bat flip in context of right or wrong if it’s offensive to a player on the opposing team. Well, it was. It was offensive to Sam Dyson, who, without coincidence, was the pitcher who had just given up the home run to Bautista that spurred the bat flip. Dyson’s reaction seemed to be more of an unhinging; a singular representation of the collective mind of the Rangers. As history now goes, the Rangers were the beneficiaries of strange fortune in the top half of the 7th, nudging them ever closer to the Championship Series. The following half inning saw the Rangers’ 167-game journey and bid for a championship suddenly unravel in a strange, beautiful, sad, and unpredictable sequencing of events. Dyson’s cortisol levels were no doubt already higher than usual, having inherited three baserunners and tasked with getting two outs against the middle of baseball’s most potent offense that features the near certain American League MVP winner and MLB’s leading home-run hitter over the better part of the last decade — oh and these would also be the first two players he would be facing. These facts about the the situation and the prowess of the hitters are somewhat minimized in a pitcher’s mind that is focusing on executing his game plan, but I felt compelled to catch a glimpse into Dyson’s psyche before it all went down.

And then it went down (refer to GIFs of Bautista above).

Dyson will have to internalize the experience, if he’s not/hasn’t already, and I don’t know what that will be like for him. But immediately following the Bautista home run was not the time for that since Dyson still needed to get one more out in the inning. In the moment, amid all the pandemonium, he needed something he thought he had some semblance of control over and he found it, eventually, supposedly, in the bat flip. In fact, the bat flip was something that would, in some strange way, vilify the hero and deflect the attention away from the fact that he just gave up the home run that would eventually be the nail in the coffin (purely from a runs standpoint) for his team’s season (of course it’s more complicated than that). I’m not saying Sam Dyson consciously thought of all this; we’re animals and we’re not always aware of, or able to keep up with the torrid pace of our physiological states – and BELIEVE that Dyson was going through some stuff. However, to believe that Dyson acted above the bat flip, or any of it, is to ignore the fact that he too reacted instinctively to the situation. He made things worse by misinterpreting gestures and pointing fingers at inconsequential things like bat flips.

Dyson’s reaction, while not as grandiose as Bautista’s, was a reaction that was just as impulsive as Bautista’s bat flip, and yet, somehow, it seems like a lot of people deem his reaction to be more acceptable. Is it because he did his best to feign composure through it all? Do you really think he wouldn’t have approached Edwin Encarnacion in the midst of all the mayhem if the bat flip didn’t happen? I don’t. There is a Great Repression in this country, and I hate the way I phrased that, because it sounds so cheesy and adolescent, and really, what do I know? But it does feel like there is a sweeping under the rug of emotions, of feelings, and of truth. This is just how we’ve structured things; to be poised in all circumstance so that no one can see how truly horrible or beautiful we really are. Newscasters delivering horror stories; politicians admitting to affairs; talking about something you did that you’re extremely proud of but don’t want to seem too proud of — there are guidelines right down to accepted cadences, gestures, tones, and expressions for delivering each of these like they each came from an acceptable social norms textbook. Big, real emotions tend to make other people feel uncomfortable because conduct says we repress them and stay status quo. If I seem to be disgusted by it all, I’m not…as much as I used to be. But that’s probably because of anger management, finding love, and the birth of my son — three things I can talk in restricted excitement about because I’m starting to well-adjust…obviously, I’m not there yet if I’m ranting about all of this because I’m caught up in the debate of whether or not a bat flip is acceptable.

Sam Dyson said, in a post-game interview, “he (Bautista) is a huge role model for the younger generation coming up playing this game and he’s doing stuff kids do in wiffle ball games and backyard baseball, it shouldn’t be done”. First of all, Sam Dyson has been teammates with Jose Bautista, Giancarlo Stanton, and bat-flipper extraordinaire, Jose Fernandez. Do you think he was appalled at their flips when he was their teammate? Also, Sam Dyson literally just said, it’s a game, and that’s the point anyone who has ever played the game has been hammered with — “never stop having fun! Remember why you play! It’s just a game!”

I understand the game Dyson and Bautista play is also their job. I understand that to play the game professionally means having to work harder than you ever thought you could work, and that that probably has a tendency to mute and mature the game a bit — and like with anything, sometimes it’s a struggle to remember why you do it. But for Jose Bautista, everything culminated in that one swing. In that one moment after he connected with the pitch from Dyson, every swing he ever took, every time he tried out for a team, every early morning and every late night spent training made perfect sense to him. He was experiencing the moment most people, including himself up to that point, only conjure up in back yard wiffle ball games. So please, in a world where we’re forced to repress so much, don’t take the humanity out of the game, and don’t try to take away anything from Jose Bautista’s moment. Given everything in his life that led Bautista to that immensely emotional game 5, given the gravity of the situation, the no doubt distance of the home run, the do-or-die premise of the game, I’d say that bat flip was absolutely, spot-on, 100% perfect.


What If Prior Playoff Success Were the Only Thing that Mattered?

Ed. note: this was probably intended for a few days ago, but it just showed up, so, enjoy!

Determining playoff success ain’t like predicting outcomes during the regular season. Smaller sample sizes, emotions, momentum, and magical realism have been blamed for seemingly unexplainable outcomes in baseball’s postseason. Common knowledge about predicting success doesn’t add up, “shouldn’t the best teams win the World Series every year?” It might depend on what we call, “best”.

It’s not always the best regular-season teams that win the World Series; in the last 20 years only four teams that had the best record in baseball have gone on to win the World Series (20%). Even momentum heading into the playoffs doesn’t seem to amount to much World Series success either; the 10 best September records heading into the playoffs haven’t amounted to a World Series victory during the Wild Card Era[1].

Despite these results we still can’t get away from favoring the best teams every single year — after all, “nothing succeeds like success.” There is something to be said about previous playoff success within the wild-card era, and whether it is maintaining the rosters of successful teams or a cultural revitalization within these teams, previous playoff success has paid off. In fact, 13 of the last 20 years of World Series championships (65%) belong to only 4 teams: Yankees, Red Sox, Cardinals and Giants.

A new study on previous success by Rosenqvist and Skans (2015)[2] may have shed some light onto this phenomenon. Their experiment compared golfers of seemingly equal skill and ability: golfers who marginally made the cut for a golf tournament vs. golfers who marginally missed the cut for the same tournament. They found that golfers who made the cut showed an increase in performance in subsequent tournaments compared to those golfers who missed the cut. Early luck leads to increased confidence, which later leads to more success.

Success, either accidental or otherwise, seems to be contagious. Baseball, however, isn’t golf (unless you’re Brandon Belt). Baseball is comprised of teams of individuals, each with their own history of success or failure, confidence or doubt. However, using this theory, could it be the case that teams that are comprised of players with more playoff success have the confidence to do it again?

I totaled all of the playoff experience for every player on the 8 playoff teams in the ALDS and NLDS. To have contributed to previous playoff success, a player had to have played at least once during a previous playoff run (pitched at least one pitch, come in to pinch-run, come in to play defense, or taken at least one at-bat). Below, each team has an “average player profile” that defines each team’s average postseason player. The profile is comprised of the average experience and success across five variables: years that a player has contributed to a playoff team, total playoff games won with each contributed team, playoff series won with each contributed team, World Series appearances with each contributed team, and World Series victories with each contributed team.

Kansas City Royals

Average years contributed Average playoff games won Average playoff series won Average World Series appearances Average World Series victories

Average age

1.48

8.16 2.08 0.72 0.08

29.4

Though the 2015 Royals have carried their 2014 playoff experience with them, it’s not last year’s remaining players that are most intriguing. In some savvy acquisitions the Royals have padded their already experienced squad with some playoff warhorses. The 2015 acquisitions of Joba Chamberlain, Ryan Madson, Franklin Morales, and Jonny Gomes all come with some serious playoff success – each have a World Series ring.

Yet, despite the playoff experience added by this year’s Royals, their 2015 playoff roster doesn’t include Joba Chamberlain or clubhouse glue-guy Jonny Gomes, each with a ring. Omar Infante was also left off, who had the second-most World Series appearances across all 8 teams, tied with Matt Holliday with 3. Despite the youth-driven movement from last year’s team, the 2015 Royals are surprisingly the second-oldest team in this year’s postseason. Their age comes with some success – the average 2015 Royal has been to the playoffs, won an average of 8 games, won at least 2 series, and been to a World Series.

Houston Astros

Average years contributed Average playoff games won Average playoff series won Average World Series appearances Average World Series victories

Average age

0.64

1.56 0.28 0.04 0.00

28.3

Young teams with no playoff experience can play like they have nothing to lose; they’re young, they’re talented, and there’s a belief that if they’re this good now, they’ll be able to make the playoffs again in the future. It runs counter to the success-confidence-success theory, but this could be the story for the 2015 Astros who could propel themselves to an accidental World Series appearance.

The only player on the 2015 Astros to have been to a World Series is Scott Kazmir with the 2008 Rays. Overall, the pitching staff is older (m = 30.1 years old) and more successful (m = 2.27 games won) compared to their position players (m = 26.9 years old, m = 1.00 games won). This composition is counter to the 2015 Mets, who have pitching youth paired with position-player experience. The Astros are a young team; they’ll be looking to pull a 2014 Royals on the 2015 Royals.

Royals in 5

Toronto Blue Jays

Average years contributed Average playoff games won Average playoff series won Average World Series appearances Average World Series victories

Average age

1.12

3.72 0.80 0.24 0.00

29.3

When the majority of a team’s playoff experiences comes from a duo of former Rockies, you know two things: 1) It’s been a long time since the Blue Jays have reached the playoffs and 2) the current team lacks playoff experience. The only player who knows what it takes to win a World Series is Mark Buehrle, and apparently his late-season implosion was enough to leave him off the postseason roster. The Blue Jays sport the second-oldest average player (m = 29.3) including the oldest player in this year’s postseason to be in the playoffs for the first time – the 40-year-old R.A. Dickey. The Blue Jays join the Mets and the Astros to field a team without any players who have won a World Series.

This is the opposite of playing with accidental confidence, where a young or inexperienced team suddenly finds themselves in the playoffs and plays the game like they’ve got nothing to lose, “there’s always next year”. Well for these Blue Jays, next year isn’t a guarantee. They may not be playing with a blithe spirit of reckless abandon but the fleeting dreams of older players who may never reach the playoffs again. But who knows, maybe the exuberance of being in the playoffs for the first time is enough to spark a youthful movement? The theory disagrees.

Texas Rangers

Average years contributed

Average playoff games won Average playoff series won Average World Series appearances Average World Series victories

Average age

1.60

7.28 1.56 0.64 0.08

28.9

The average Texas Ranger profile is a bit deceptive – heavily weighted by those that have previously been to the playoffs. The average Texas Ranger who has previously been to the playoffs has won 15.2 games, has won 3.9 playoff series, and has been to almost 2 World Series (m = 1.78). In fact 36% of the 2015 Rangers’ postseason roster have been to a World Series. The Rangers have very quietly maintained many of the players who got them to the back-to-back World Series’ in 2010-2011 (Lewis, Holland, Moreland, Andrus, Napoli, Hamilton).

This team will be overlooked for their lack of pitching, but their postseason success cannot be ignored. With the average Texas Ranger having nearly double the success of winning playoff series than the average Blue Jay, we might expect this series to be a cakewalk for the Rangers. Then again, it’s a five-game series, and the Blue Jays have some serious star power.

Rangers in 4.

Chicago Cubs

Average years contributed

Average playoff games won Average playoff series won Average World Series appearances Average World Series victories Average age
0.92 3.76 0.92 0.20 0.12

28.4

In “the year of the rookie” it only makes sense to have two young teams representing each league in the postseason. If you removed Austin Jackson, the 2015 Cubs start to look a lot like the 2015 Astros. The pitching staff is older (m= 29.9 years old) and more successful (m = 4.73 games won) compared to the Jacksonless position players (m = 27.1 years old) and (m = 1.92 games won). The Cubs are lucky to have both a position player (David “Dad bod” Ross) and a pitcher (Jon Lester) with World Series rings, along with 16% of postseason players with World Series exposure. So, maybe the Cubs are a slightly more seasoned version of the 2015 Astros.

The Cubs are also deceptively successful in the playoffs. Despite an average of only 1 year in the playoffs, the average Cub has won almost 4 games and 1 series. Compare this to the New York Mets who have relatively the same amount of experience, but with far less success.

Between the minds of Theo Epstein and Joe Maddon are some great ideas about utilizing leadership, team chemistry, and plenty of other intangibles. Count on the Cubs to take advantage of the balance between youth and experience during this year’s playoffs.

St. Louis Cardinals

Average years contributed

Average playoff games won Average playoff series won Average World Series appearances Average World Series victories Average age
2.64 14.6 3.56 0.84 0.32

28.6

The average Cardinal has some serious playoff success. The average Cardinal has been to the playoffs at least 2 years, won at least 14 games, and won at least 3 series. The 2015 postseason Cardinal has not only been to the World Series, but 25% of the 2015 postseason Cardinals have won a World Series; all of this playoff success and still a relatively young team. The Cardinals have the 2015 player with the most postseason experience in Yadier Molina, who has appeared in 4 different World Series and won 2 of them. The saddest part about the 2015 Cardinals is the absence of Randy Choate, who won a World Series with the 2000 Yankees (2 World Series rings in 16 years would have been a cool story).

The Cubs might give the Cardinals some fits, but the theory says that the Cardinals shouldn’t have a problem disposing of the Cubs. Count on the Cardinals making it back to the World Series.

Cardinals in 4

New York Mets

Average years contributed

Average playoff games won Average playoff series won Average World Series appearances Average World Series victories

Average age

0.96 2.32 0.40 0.04 0.00

28.0

If there are counters to the success-confidence-success theory it’s the 2015 Mets, who are basically the 2010 San Francisco Giants: loaded with young talented pitching and complemented with older, experienced position players. The Mets are in fact the youngest of the 8 playoff teams, though their youth comes with a price. In fact, the Mets’ pitching staff is so young and inexperienced, if you removed Bartolo Colon, you’d only have 1 pitcher with playoff experience (Tyler Clippard with the hapless 2012 and 2014 Nationals).

Quite similar to the 2010 Giants, the only player on the 2015 Mets to have won a World Series is Juan Uribe (2005, 2010) who did so with the Giants in 2010, yet due to injuries isn’t on the playoff roster. The Mets will have some decent playoff success with Curtis Granderson, David Wright, and Michael Cuddyer who can describe to young players what it’s like to lose in the playoffs. The only player to have even been to a World Series is Granderson when he was on the Tigers who lost to the Cardinals in 2006.

Los Angeles Dodgers

Average years contributed

Average playoff games won Average playoff series won Average World Series appearances Average World Series victories Average age
2.04 6.64 1.28 0.24 0.08

29.6

Chase Utley + Jimmy Rollins + Good Starting Pitching = 2007-2011 Philadelphia Phillies. The Dodgers are hoping they get the 2008 version, though by the looks of things, it may resemble more of the 2010 version. The average Dodger has been to the playoffs, won a few games, and won at least 1 series. It’s really a smattering of success and experience despite being the oldest team in 2015 postseason (m = 29.6 years old).

Their playoff success says that the Dodgers should be able to handle the Mets, though the real test will be whether this older group of players will take to the leadership and previous success of Utley and Rollins. If the Dodger players are smart, they’ll humble themselves as much as possible, hone in, and play as a team.

Dodgers in 4


Conclusion and Caveats

  1. Yes, skill and ability is obviously something to take into consideration. Though, players who are highly skilled tend to find themselves on more successful teams, so the two may be related. The same can be said for age: the older you are, the more playoff experience you’re likely to have. However, if you look at this year’s teams, average age and average playoff success don’t seem to be related at all.
  1. Yes, in recent memory, the 2010 Giants and the 2014 Royals have been successful in the postseason despite a lack of playoff experience and success. However, in the playoff era, how many have actually won the World Series? Few come to mind.
  1. Yes, skill seems to be valued more that experience. Most managers tend to stick with their highest-performing players, and you can’t blame them. However, if this theory holds true, maybe you can blame them. The second season might benefit from previous playoff success. The counter to this is to picture a 2015 postseason team with 67-year-old Johnny Bench, 84-year-old Willie Mays, and “Mr. October” 69-year-old Reggie Jackson (all have some serious playoff success, right?). Recall from #1 that skill and ability obviously count, but the theory states that previous success might count too.


[1] http://www.sportsonearth.com/article/152528108/mlb-playoffs-momentum-best-septembers

[2] Rosenqvist, O. & Skans O.N. (2015). Confidence enhanced performance? – The causal effects of success on future performance in professional golf tournaments. Journal of Economic Behavior & Organization, 117, 281-295.

Young Guns: 2015’s Top Eleven Rookie Pitchers

The 2015 season featured the emergence of a whole passel of top-flight young arms. And these pitchers weren’t just appearing on rubble-clearing franchises like the Phillies. Five of the top 11 rookie pitchers (by bWAR) are on playoff teams. Let’s go to the list (thanks to Baseball Reference’s Play Index):

1. Lance McCullers   2.5 WAR     121 IP     80 ERA-     Age: 22

McCullers has been a key engine in the Astros relaunch, turning in 11 quality starts in 21 attempts since his arrival in the majors on May 18. He’s been the third most valuable pitcher on the ‘Stros, behind Cy Young contender Dallas Keuchel and Colin McHugh. While his innings load has been a concern, McCullers has thrown over 100 pitches in just 8 of his starts, and went over 110 just once. He throws the hardest curve in the charted universe, which probably accounts for his astronomical strikeout and walk rates in the minors.

_________     K/9         BB/9

Minor Lance     10.7           4.5

Major Lance       9.2           3.1

McCullers shaved 1.4 walks per 9 after his promotion, at the cost of 1.5 strikeouts, a trade probably worth making given the success he’s had so far.  Major-league starting pitchers with a walk rate of at least 4.5/9 are rare, and mercifully so. By FanGraphs’ count, there have been 58 such pitchers since the beginning of divisional play in 1969. As you can see, these are generally the guys you’ll find in your grocery’s frozen-rope section. McCullers may yet revert to his minor-league form, in which case he can still be a bullpen force (where his many doubters thought he would end up), but right now he looks like a top-of-the-rotation starter.

2. Eduardo Rodriguez     2.5 WAR     122 IP     91 ERA-     Age: 22

Acquired by the Sawx from Baltimore in July 2014 in exchange for reliever Andrew Miller … well, let’s stop there. How good would E-Rod look in the Fighting Showalters rotation? Hey, that’s a question that can be answered with research!

Orioles Starters            WAR          ERA-

Wei-Yin Chen               3.5             81

Ubaldo Jiminez           2.5             94

Kevin Gausman           1.3             97

Miguel Gonzalez         0.6           119

Chris Tillman               0.6           123

Orioles fans are unlikely to curse Andrew Miller in the same way Cubs’ old-timers curse Ernie Broglio, but this trade left a bruise. Chen is likely to depart in free agency this winter, and putative rotation saviors Dylan Bundy and Hunter Harvey will need maps to find their way back to the mound after spending years exploring the further reaches of America’s medical-industrial complex. It’s unclear whether even he can save the Birds from dropping in 2016.

3. Cody Anderson     2.5 WAR     91 IP     76 ERA-     Age: 24

It’s been a forgettable year in Cleveland, but the Indians have quietly assembled a decent pitching staff. Anderson is their 4th best pitcher by bWAR, and something of a surprise. Drafted in the 17th round by the Rays in 2010, Anderson did not sign, instead returning to Feather River College in Quincy, California. The move paid off, as the Spiders drafted him the next year all the way up … in the 14th round.

It’s hard to believe the kind of run suppression Anderson displayed this year can last. The only qualifying starter this season with fewer strikeouts per 9 than Anderson’s 4.3 is Mark Buehrle (4.1). But if Anderson can find a way to edge his strikeouts up to the 6.8/9 he displayed in the minors, he could carve out a solid career as a back-end starter. He’s already accumulated more WAR than anyone else from Feather River College.

4. Carson Smith     2.1 WAR     69 IP     61 ERA-      Age: 25

Carson Smith was 12th in the majors this year in K/9 (11.83). Carson Smith was 109th in the majors this year in average fastball velocity. There is only one possible conclusion: the velo thing is hype. You heard it here first.

5. Nate Karns     2.1 WAR     147 IP     95 ERA-     Age: 27

In another questionable trade of a young starter, the supposedly pitching-rich Nationals sent Karns to the Warehouse by the Bay in exchange for Felipe Rivero, Jose Lobaton, and former first-round RF Drew Vettleson, whose on-base skills were last seen floating down the Schuylkill. Karns has trouble keeping the ball in the yard but his other rate stats are solid. At age 27, there’s probably not a lot of upside here, but Karns will remain a useful rotation piece as long he’s still cost-controlled. At just 5.65 IP/start, he puts pressure on his bullpen; more efficiency would help.

6. Noah Syndergaard     2.0 WAR     143 IP     90 ERA-     Age: 22

Syndergaard’s 5.2 K/BB would put him 8th in the majors if he qualified. Yet another traded prospect, Thor came to the Mets from the Blue Jays in exchange for R.A. Dickey and a crate of Jerry Grote bobbleheads. The Jays are steamrolling toward the World Series, and Alex Anthopolous’ hyperkinetic roster manipulations have a lot to do with that, but you have to believe this is one he’d like to have back.

(And no, I don’t really believe Karns is better than Syndergaard – for purposes of this post I’m just taking the bWAR list as it stands.)

7. Aaron Nola     1.9 WAR     78 IP     91 ERA-     Age: 22

Doug Melvin and Ruben Amaro, Jr. sailed away from GM Middle Earth this year, but they each left their respective teams at least 2/5 of a good young starting rotation. The Phillies moved Nola to the majors quickly, but he was an advanced prospect when drafted and faced no serious resistance at any minor league level.

There are some signs of danger: lurking menacingly behind Nola’s 3.59 ERA is a 4.04 FIP, mainly the product of a high HR/9 rate of 1.3. Nola kept the ball in the minor-league yards, so there’s reason to believe he’ll figure it out in the majors, but Citizen’s Bandbox is notoriously unforgiving of hanging curves. The one down side of Nola’s quick ascent to the majors is that he didn’t have time to develop a changeup. The good news is that, given the Phillies dilapidated state, his next 150 innings will be low leverage.

8. Jerad Eickhoff    1.9 WAR     51 IP     67 ERA-     Age: 24

Not nearly as prospect-y as Nola, Eickhoff is former 15th rounder acquired by the Phillies in the Cole Hamels trade. (So that makes 4 guys on this list who were obtained by trade. Perhaps reports of the death of the prospect trade have been somewhat exaggerated.) Like McCullers and Anderson, Eickhoff is beating his minor league rate stats in the majors, but, as with Anderson, some of this may simply be fruits of the dreaded small sample size.

It may be reasonable to expect strikeout regression, but at least Eickhoff gives some hope to Phillies fans who wake up with night sweats after witnessing serial arsonists like Jerome Williams, David Buchanan, and Sean O’Sullivan. Nola and Eickhoff are the only two current Phillies starters with a bWAR over 1.0.

9. Roberto Osuna     1.9 WAR     69 IP     57 ERA-     Age: 20

Selected K/9 rates from pitchers in Toronto’s minor-league system by the end of 2011:

Noah Syndergaard          10.37

Drew Hutchison          10.31

Nestor Molina              10.22

Aaron Sanchez               9.28

Deck McGuire                8.90

Roberto Osuna                   5.49

Okay, Osuna was only 16, so maybe this isn’t entirely fair – he threw just 19 2/3 innings in the Mexican League in 2011 before being acquired by the Blue Jays in August. But it’s highly unlikely that you would have predicted in 2011 that of the pitchers on this list, Roberto Osuna would make the most significant contribution to the Blue Jays in 2015 unless you are a close relative of Roberto Osuna.  No Carson Smith he, Osuna cooks with 95.5 mph gas, and has never struck out fewer than 9 per 9 at any level since 2011. And he’s only 20.

10. Luis Severino     1.8 WAR     55 IP     68 ERA-     Age: 21

A tough case of an obviously talented pitcher badly needed on a contending team, but who also probably could have used a bit more work in the minors. His ERA (2.89) is shiny, but his FIP (4.37) is less impressive. This mainly stems from the relatively high walk rate (3.2 – the AL average is 2.6), and a slightly high homer rate (1.3 – the AL average is 1.1). On the bright side, eight of his eleven starts were quality, with only one being of the faux (6 IP, 3 R) variety. That start came against the deadly Jays lineup, who incinerated him the next time he faced them, but did little against him the third and final time. In short, he fought the best lineup since vitamin B-12 to a draw; a mighty impressive accomplishment for someone who has yet to log 100 innings at any one level.

Still only 21, Severino has a better chance than anyone on this list of developing into a #1 starter (with the possible exception of McCullers) but Yankees fans should probably temper their expectations slightly for the immediate future. Girardi deserves credit for careful usage (just two starts over 100 pitches, none over 107), and this plan should probably continue until Severino can more consistently minimize the Two Bad Outcomes.

11. Andrew Heaney     1.8 WAR     106 IP     92 ERA-     Age: 24

Acquired in a trade … what, that’s like 5 now, right? … from the Dodgers in exchange for Howie Kendrick, Heaney righted the ship this year after an ugly 2013 in Loria Land, largely the product of bad home-run luck. His 8.9 K/9 in the minors has shriveled to just 6.5 in the majors, and he’s been a fly-ball pitcher this year, so there could be some risk here that the homer bug will return. Heaney has the amazing Mike Trout in center, so as long as the flies stay in the yard, a lot of them will be outs.


Final Month Fantasy Fun With Excel

The Major League Baseball season is just past the three-quarter mark, which means just under one-fourth of the season is left to be played. If you play fantasy baseball, you should know by now whether you have a chance to win this year. If you’re still in contention, now is the time to really take a good look at the important categories for your team. If you’re not in contention, don’t be a chump and just give up. At the very least, play an active lineup each day as a courtesy to the other owners in your league.

By this point, trades may no longer be an option. Most leagues have trade deadlines set before late August, so you are more likely looking at waiver-wire additions and setting your lineup in a way to optimize the points you can gain and minimize the points you can lose.

The vast majority of fantasy baseball leagues have both counting stat categories (runs, home runs, RBI, stolen bases, wins) and rate-stat categories (batting average, ERA, WHIP). In general, it’s easier to see how many points you can gain or lose in the counting categories. With so much of the season done, some of the counting-stat categories have taken on greater importance. Perhaps steals is a very tight category in which you have room to move up or down and could gain or lose a few points. It’s clear that you have to make add/drop moves and set your lineup to address steals, while also keeping an eye on any other hitting categories that would suffer with the addition of a low-power basestealer.

With rate-state categories, it’s a bit trickier than just looking at the standings and making an estimate of how much you can move up or down. I’ll use pitching as an example. In my standard 12-team Yahoo league, there is an innings limit of 1250 innings. In this league, the top team in innings pitched has used up 1037 innings (83% of the limit), while the bottom team has just 932 innings (75% of the limit). Moving forward, this will make a difference in the counting-stat categories of wins and strikeouts. It will also make a difference in ERA and WHIP.

I like to have an idea of how much my team can move in ERA, WHIP, and Strikeouts, so I created a spreadsheet to track this. Even though this leagues uses raw strikeouts, I want to figure out my K/9 so I can more easily compare my strikeouts to teams with different innings pitched totals (you could also use K/IP).

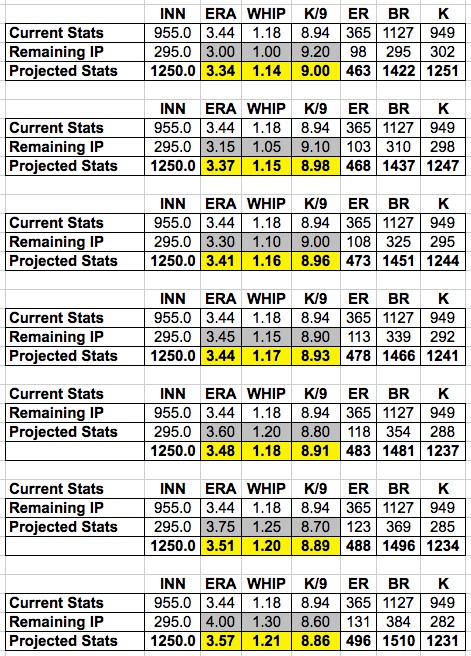
Below is my spreadsheet. In this spreadsheet, ER stands for “Earned Runs,” BR stands for “Base Runners,” and K stands for “Strikeouts.” I plug in my current innings total (955), with my current team ERA, WHIP and Strikeouts, then calculate ER [(ERA x IP)/9], BR [WHIP x IP], and K/9 [(K/IP)*9].

In the row labeled “Remaining IP,” I use the same formulas as above for ER and BR, then use this formula in the K column: ((K/9)*IP)/9.

For the “Projected Stats” row, I add up the INN, ER, BR, and K columns, then use formulas to figure projected ERA, WHIP, and K/9 (the yellow squares).

This gives you the framework of the spreadsheet. Now it’s time to get an expectation of how your team’s pitching numbers will play out.

In the grayed-out cells, I put in various projected ERA, WHIP, and K/9 numbers. I start with an optimistic view of my team’s future pitching abilities and work down to a pessimistic view. My team currently has a 3.44 ERA, 1.18 WHIP, and 8.94 K/9. In the top of the chart, I put in 3.00, 1.00, and 9.20 in the grayed out cells for ERA, WHIP, and K/9. This tells me that if my team puts up a 3.00 ERA, a 1.00 WHIP, and a 9.2 K/9 from this point forward, my final ERA will drop to 3.34, my final WHIP will drop to 1.14, and my final K/9 will rise to 9.0. This could be considered a best-case scenario.

On the other hand, if my pitchers post a 4.00 ERA, a 1.30 WHIP, and an 8.6 K/9 from this point forward, my final ERA will be 3.57, my final WHIP will be 1.21, and my final K/9 will be 8.86.

Here is the spreadsheet with various levels of projected performance:

The main idea is to get an estimate of how much your ERA, WHIP, and K/9 can change over the final five weeks of the season. If I use the numbers from this example, I can expect my final ERA to be between 3.34 and 3.57, while realizing a more realistic estimate would be between 3.40 and 3.50 unless I’ve made some big changes to my pitching staff. It’s a similar story for WHIP, with a likely estimate being a final WHIP of 1.16 to 1.20. The range for K/9 would be from 9.0 to 8.85. As you can see, there isn’t much movement available in these pitching categories. The particulars of your league’s standings will tell you how many points you can gain or lose based on rest-of-season expectations.

Once you’ve created the spreadsheet, you can take a closer look at ERA, WHIP, and K/9 and make the moves that will help you the most.


Analytics Are Good, But Psychometrics Can Make Them Great

This is not about a relief pitcher resting horizontally on a comfy couch as he spills his deepest darkest secrets to a furrowed, bearded psychologist, nor is this about prescribing medication to a team’s severely depressed kicker who just missed the game-winner. We’re talking about sports psychology, but not the kind of stereotypical psychology you’re used to. Instead, we’re talking about psychometrics – how to measure the ways that a player’s psyche (thoughts, feelings, opinions) relates to the most important thing imaginable for sport teams: performance.

Seeing is believing

Counting the yards that a running back gains after contact or the runs prevented by pitching independent of defense are advanced numerical methods of breaking down a player’s performance. Most of the traditional analytics work the same way; a player’s previous performance is charted, observed, and dissected to make a projection about how that player will perform in the future. A team’s forecasted performance is usually the sum of the individual players’ projected performances. This is (generally) the state of analytics in a nutshell.

Not only have analytics shown that previous performance predicts some level of future performance, it also just makes sense. Watching a player hit a 3-point shot, scoring pad-side against the goalie, and hitting a home run are visible to everyone; it’s what makes sports, sports. You know that Mike Trout is a good baseball player because you can see his performance. You can see him make ridiculous plays in the outfield and then watch him hit a home run into a fishing net in the center-field bleachers. You can check the box score the next day and you can see the numbers immediately reflect his awesomeness. You can visit FanGraphs and read about a sabermetric stat that further corroborates Trout’s awesomeness, and then you can use that same stat to find out about another obscure player’s performance and realize he’s kind of awesome as well. Analytics makes sense because most of it is overtly visible – above the surface, leaving everything else that can’t be seen as “intangible”.

What lies beneath

 Even if analysts were to measure more “intangible” characteristics, like a player’s leadership, grit, or mental toughness, they don’t seem to amount to the same numerical accessibility as traditional performance metrics, nor do they seem to be relatable to future performance. However, with carefully designed tools, psychometrics can not only measure these “intangible” characteristics, but can help predict future performance in the same way as traditional analytics. Ideally, psychometrics from players and teams can help complement performance analytics that are now readily being used.

In fact, measurement of the human mind and behavior isn’t anything new – over 100 years of psychological research has shown that the human psyche is quantifiable in the same way that previous performance is quantifiable. Psychologists have measured and quantified aggression across different cultures[1], charismatic leadership in managers[2], intrinsic motivation in children[3], and team cohesion within collegiate and recreational sports teams[4]. What’s more, these numbers can even fit nicely into the same models, projections, and predictions that have been used with traditional analytics. Yet despite the depth and breadth of this research, professional sports teams have been slow to tap into this area of study, pooh-poohed by pundits as “intangibles,” unseen and unrecognized by professional sport team brass.

You won’t know unless you try

If the results of these measurements help to win more games, what do teams have to lose? Teams should not fear the minuscule amount of time that their players would spend filling out a carefully designed survey if it means understanding more about them – and, ultimately, understanding more about their team. Teams should not fear the analysis of dugout, sideline, team bus, or hotel conversations between players, all of which include rich amounts of data that can help to explain the relationships between players. Teams should not fear the measurement of a player’s comments, quotes, tweets, or posts, their spoken or written words might reveal hidden emotions or intentions. The analytics movement is far from over, and if teams are looking for more numerical insights, look no further than psychometrics.


[1] Ramirez, J.M., Fujihara, T., & Van Goozen, S. (2001). Cultural and Gender Differences in Anger and Aggression: A comparison between Japanese, Dutch, and Spanish students. Journal of Social Psychology. 141, 119-121.

[2] Conger, J.A., Kanugo, R.N., & Menon, S.T. (2000). Charismatic leadership and follower effects. Journal of Organizational Behavior. 21, 747 – 767.

[3] Marinak, B.A. & Gambrell, L.B. (2008). Intrinsic motivation and rewards: What sustains young children’s engagement with text? Literacy Research and Instruction, 47(1), 9 – 26.

[4] Carron, A.V., Colman, M.M., Wheeler, J., & Stevens, D. (2002). Cohesion and performance in sport: A meta analysis. Journal of Sport and Exercise Pscyhology. 24, 168 – 188.


A Theory and A Challenge

I love this site. It covers the full spectrum of baseball, from classical scouting all the way to the most esoteric of baseball analysis. At times I envy the analytical abilities of our writers, as well as their access to granular data, that I likely lack the technical competence to gather. Today, I would like to propose a a theory, as well as a challenge to the numerous writers on this site to put the theory to the test. It is also likely that this has been proposed before and answered before, in which case, point me in that direction please.

THE THEORY:

We can measure command by compiling a pitcher’s xISO and xBABIP based solely on where they locate their pitches, in the context of the hitter’s preference to location. In other words, the ability to “pitch to the corners” is only valuable if one is pitching to corners that the hitter can’t get to, which is batter-specific. An 80-command pitcher will be able to maximize the xISO of his pitches, simply by pitching to “cold” areas of the hitter’s strike zone.

There are a few of ways to approach this (I’m sure more than three, but I digress). The first question is what sample size to use to estimate the player’s preference within the strike zone? Evidence suggest certain players make rapid adjustments (Trout) which would indicate a SSS would be ideal, whereas other players exhibit strong long-term tendencies (Dozier? just a guess, not founded in data) that would indicate a LSS would be ideal.

The second axis would be to evaluate a player’s effective strike zone, i.e. if we looked at the hitter’s swing probabilities, what type of strike zone would we construct, given only data concerning the hitter’s propensity to swing. We could then tease out whether the pitcher is maximizing the player’s effective strike zone (pitchers only throwing balls to Vladdy Guerrero comes to mind). This analysis may be redundant, as this can probably be captured if we are able to incorporate the third axis:

What are the thresholds for considering a pitch well-located? I.e. if a pitcher throws a ball way outside, but the hitter swings, then this is a well-placed pitch, thus at what probability of swing% is a ball a well-commanded pitch?

THE CHALLENGE

Test it! (or show me where this has already been fully fleshed out.) I’ve always wondered if there was a way to build up a command ERA to see if a pitcher is able to put it where hitters have to swing but don’t want to and I look forward to reading about it.


Don’t Sleep On These Post Hypers

NL West Edition

We’ve all been there and done that, our dynasty/keeper league(s) haven’t gone as planned. Perhaps you went for it in the offseason, ditched your prospects for grizzled productive vets and it all went south from there. No matter your story, the rebuild can be difficult in the sense of valuing the players you want. You could fall into the “shiny new toy trap” and end up with a bust or broken player (envision a Joc Pederson type in an AVG league instead of OBP). In this upcoming series, I will be highlighting players based on positions and pointing out whether I’d go for them in separate leagues (NL/AL only) or mixed.

So without further ado, here’s the first segment.

Read the rest of this entry »


Falling Starlin

He could be playing (Saturday). I’m not sure yet. I want to see how it plays today, but I wanted to be upfront with him and just let him know it’s not just a day off.

— Joe Maddon

And with those words on Friday, August 7th, the Castro Regime fell in Chicago. Starlin Castro has earned the pine, posting an abysmal .268 on-base, around 50 points worse than the MLB average. Power has been even more of a problem; Castro’s ISO of .068 is sixth worst in MLB among qualifying hitters. It is also the worst of Castro’s professional career. Maybe he contributes with speed? Nope, not since 2012, when Castro stole 25 in 38 tries. He’s had only 23 ineffective attempts since then. His defense, long and loudly criticized, hasn’t been all bad; the metrics differ on him, but add them all up (metaphorically, anyway) and he seems to grade out about average.

Castro is striking out only a bit more this year than he has in his career (16.8% vs. 15.7%), but he’s making weaker contact. His infield fly percentage is at a career high of 12.9%, a full 5% higher than his career average. It was high last year, too, but he made up for it with a line-drive rate of over 22%. The line drives are gone this year, with Castro hitting a career low of 15.8%, which is, like his ISO, sixth worst among qualifiers.

Castro isn’t obviously being pitched differently this year. He’s seeing a few more strikes, but that’s probably an effect of his power outage rather than a cause. It doesn’t seem that pitchers have found some sort of secret recipe to deprive him of hits. Rather, it appears that fastballs are simply overwhelming him. According to his PITCHf/x data, Castro’s done pretty well against most offspeed pitches, but he has a league worst -2.70 runs above average/100 against four-seamers, and he’s 4th worst against two-seamers (-2.74). There are some decent hitters who have struggled with one of those pitches this year, but no one has been as bad as Castro at both.

Castro has been known to travel with a rough crowd, and more recently there’s been some ADD speculation. The Cubs organization is hinting that conditioning is a problem, which would explain the loss of power and his inability to hit the fastball. Perhaps, but Castro is 10th overall in total plate appearances since 2012. Whatever his problems may be, durability hasn’t been one of them.

And it’s worth remembering that Castro plays the most difficult position in what is arguably the most difficult team sport. He’s still only 25 years old, and by the standards of young shortstops, Castro has done quite well so far. He’s 29th in career bWAR (8.1) in the divisional era for shortstops through age 25. There are some great players in the top 50, and some not-great players, but there’s only one real disaster: Bobby Crosby at #40. (Ok, Rafael Ramirez at #39 was pretty bad too.) So Castro could have a Crosby-Ramirez future, in which he rapidly descends into mediocrity and irrelevance. But the vast majority of players with achievements similar to his at age 25 did not.

This suggests that either patience or a change of scenery could help Castro, as Grant Brisbee suggested in refuting the ADD speculation in the post linked above. Patience would not, however, seem to be the right move for the Cubs at the moment. Theo Epstein correctly eschewed the splashy megamove at the trade deadline: the wildcard game isn’t worth surrendering prospects. But it makes sense to to take less costly steps to improve this roster for the stretch run, and Castro is easily the biggest hole on the 25-man roster, with arguable exception of the 5th starter slot, now filled (for the moment, at least) by Dan Haren. The Cubs have been more than patient with Castro, and the performance hasn’t been there. Maybe they can give him more at-bats if they fall out of contention, but right now the team’s immediate future matters more than Castro’s.

That said, maybe the Cubs could spend a few minutes rethinking their approach to Castro. He’s has had three different managers in the last three years, each using a different approach with him. Dale Sveum’s tough love didn’t work, and Maddon’s zany zen isn’t working either. It was Rick Renteria’s more personal approach that seemed to get the most out of Castro. The karmic wheel spins in unpredictable ways, and Castro’s collapse may simply be the earthly price the Cubs are paying for Renteria’s defenestration, but it also suggests Castro can be reached, because someone was able to do it. Maddon is intelligent enough to realize this, and flexible enough to recognize that the shtick that works for most players doesn’t work for all. If Castro’s benching is coupled with some creative efforts to get him re-engaged, the Cubs may still be able to get value out of the player.

Diets, workouts, Ritalin, and perceptive coaching will be for naught if Castro is in fact the second coming of Rafael Ramirez. At some point his relatively reasonable contract will begin to look like an albatross, and the Cubs will cut him loose or trade him for minimal return. It would be helpful if players came equipped with little red crystals in their palms that glowed when the player reached his ceiling, but that won’t happen until at least the next renegotiation of the CBA.  So yes, it is possible that Castro has plateaued, and neither he nor the Cubs have figured that out yet.

But the Cubs have a little time. They can jury-rig their infield until they’re ready to press Javier Baez (or even Arismendy Alcantara) into service. They can see how the rest of the season develops, and how Castro progresses as they attempt to rebuild him in place, much like they’re doing with Wrigley Field.  As many have observed, his trade value can’t get much lower, so it doesn’t hurt the Cubs to take a little more time to see what they have. Burning a valuable roster spot on an unproductive player is dangerous, but the biggie-sized September roster is nigh.

If I had to bet, I’d bet that Castro will be moved in the offseason in exchange for someone else’s disappointment (Jed Gyorko, anyone?). But it’s not impossible that, in the top of the 12th inning of Game 7 of the 2015 World Series, Castro comes in from the end of the bench to hit the game-winning homer.  On what started as a day off.


Career Opportunity With the Atlanta Braves

Position: Analyst
Reports to: Director of Baseball Operations

The Analyst position will provide systems analyst functions for the Baseball Operations department’s statistical & technology-related initiatives.

Responsibilities include but are not limited to the following:

  • Oversee the in-house technological efforts associated with the development of Braves’ new internal player evaluation application
  • Daily maintenance and continued development of internal applications, including a robust Microsoft SQL Server database
  • Development and on-going adjustment of proprietary statistics and systems
  •  Understand internal baseball processes in order to develop functional requirements (specifications) for outside vendors and application developers—includes requirements, system impact, data flow diagrams special considerations, etc.
  • Must have a good understanding of the back-end data structures in order to make sure any front-end Tool/Application changes will meet the needs of Baseball Operations
  • Identify and diagnose data quality issues and provide recommendations
  • Translate unstructured baseball data into valuable analytical information
  • Maintain and expand upon the current Baseball Operations analytical strategy including developing and supporting new reports, dashboards, and data integrations
  • Develop and support ETL mappings, procedures, schedules etc. This includes the integration of multiple data sources (internal and key 3rd party external data sources) into a single data repository
  • Provide data management expertise to the Baseball Operations team by evaluating requirements and developing solution design proposal
  • Troubleshoot and resolve data/ system/application issues
  • Discuss technical issues with the software and hardware vendors
  • Continue to advance the department’s use of technology and analytics
  • Additional duties as assigned by Director of Baseball Operations

The ideal candidate will possess the following:

  • BA or BS degree in CS, IS, or an Engineering/Technical Major
  • A minimum of 5 years professional experience in a technical role
  • Strong knowledge of Data Warehousing, Data Modeling and Reporting
  • Experience with creating and understanding SQL concepts
  • ETL knowledge is a plus
  • Previous experience working with Microsoft products preferred
  • Database system knowledge and proficient SQL skills.
  • Experience in the use of the Microsoft SQL Server Platform tools (Integration Services, Analysis Services, and Reporting Services) is a plus.
  • Logical and Physical Data modeling experience using data modeling tools.
  • Relational and Data Warehousing design and development.
  • SQL Server Database Administration skills, including performance and query tuning, debugging.
  • Candidate should have strong communication, organization, project management, and problem solving skills.
  • Experience architecting KPI’s and Performance Management solutions for Baseball Operations users.
  • Strong customer facing skills and ability to manage multiple challenging projects simultaneously
  • Ability to interact professionally with all branches of Baseball Operations department in fast-paced environment
  • Must successfully pass a criminal and credit background check


Qualified candidates can should submit an application and salary expectations online at www.braves.com/employment.
Please note that no phone calls or emails will be accepted regarding application status.

ANLBC, Inc. is an Equal Opportunity Employer