Final Month Fantasy Fun With Excel
The Major League Baseball season is just past the three-quarter mark, which means just under one-fourth of the season is left to be played. If you play fantasy baseball, you should know by now whether you have a chance to win this year. If you’re still in contention, now is the time to really take a good look at the important categories for your team. If you’re not in contention, don’t be a chump and just give up. At the very least, play an active lineup each day as a courtesy to the other owners in your league.
By this point, trades may no longer be an option. Most leagues have trade deadlines set before late August, so you are more likely looking at waiver-wire additions and setting your lineup in a way to optimize the points you can gain and minimize the points you can lose.
The vast majority of fantasy baseball leagues have both counting stat categories (runs, home runs, RBI, stolen bases, wins) and rate-stat categories (batting average, ERA, WHIP). In general, it’s easier to see how many points you can gain or lose in the counting categories. With so much of the season done, some of the counting-stat categories have taken on greater importance. Perhaps steals is a very tight category in which you have room to move up or down and could gain or lose a few points. It’s clear that you have to make add/drop moves and set your lineup to address steals, while also keeping an eye on any other hitting categories that would suffer with the addition of a low-power basestealer.
With rate-state categories, it’s a bit trickier than just looking at the standings and making an estimate of how much you can move up or down. I’ll use pitching as an example. In my standard 12-team Yahoo league, there is an innings limit of 1250 innings. In this league, the top team in innings pitched has used up 1037 innings (83% of the limit), while the bottom team has just 932 innings (75% of the limit). Moving forward, this will make a difference in the counting-stat categories of wins and strikeouts. It will also make a difference in ERA and WHIP.
I like to have an idea of how much my team can move in ERA, WHIP, and Strikeouts, so I created a spreadsheet to track this. Even though this leagues uses raw strikeouts, I want to figure out my K/9 so I can more easily compare my strikeouts to teams with different innings pitched totals (you could also use K/IP).
Below is my spreadsheet. In this spreadsheet, ER stands for “Earned Runs,” BR stands for “Base Runners,” and K stands for “Strikeouts.” I plug in my current innings total (955), with my current team ERA, WHIP and Strikeouts, then calculate ER [(ERA x IP)/9], BR [WHIP x IP], and K/9 [(K/IP)*9].
In the row labeled “Remaining IP,” I use the same formulas as above for ER and BR, then use this formula in the K column: ((K/9)*IP)/9.
For the “Projected Stats” row, I add up the INN, ER, BR, and K columns, then use formulas to figure projected ERA, WHIP, and K/9 (the yellow squares).
This gives you the framework of the spreadsheet. Now it’s time to get an expectation of how your team’s pitching numbers will play out.
In the grayed-out cells, I put in various projected ERA, WHIP, and K/9 numbers. I start with an optimistic view of my team’s future pitching abilities and work down to a pessimistic view. My team currently has a 3.44 ERA, 1.18 WHIP, and 8.94 K/9. In the top of the chart, I put in 3.00, 1.00, and 9.20 in the grayed out cells for ERA, WHIP, and K/9. This tells me that if my team puts up a 3.00 ERA, a 1.00 WHIP, and a 9.2 K/9 from this point forward, my final ERA will drop to 3.34, my final WHIP will drop to 1.14, and my final K/9 will rise to 9.0. This could be considered a best-case scenario.
On the other hand, if my pitchers post a 4.00 ERA, a 1.30 WHIP, and an 8.6 K/9 from this point forward, my final ERA will be 3.57, my final WHIP will be 1.21, and my final K/9 will be 8.86.
Here is the spreadsheet with various levels of projected performance:
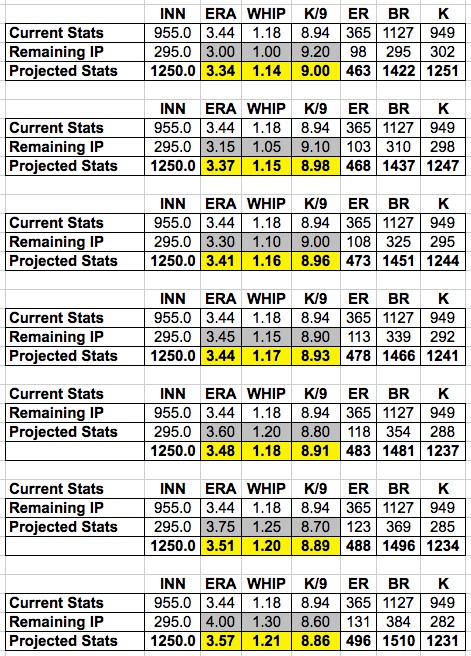
The main idea is to get an estimate of how much your ERA, WHIP, and K/9 can change over the final five weeks of the season. If I use the numbers from this example, I can expect my final ERA to be between 3.34 and 3.57, while realizing a more realistic estimate would be between 3.40 and 3.50 unless I’ve made some big changes to my pitching staff. It’s a similar story for WHIP, with a likely estimate being a final WHIP of 1.16 to 1.20. The range for K/9 would be from 9.0 to 8.85. As you can see, there isn’t much movement available in these pitching categories. The particulars of your league’s standings will tell you how many points you can gain or lose based on rest-of-season expectations.
Once you’ve created the spreadsheet, you can take a closer look at ERA, WHIP, and K/9 and make the moves that will help you the most.
Bobby Mueller has been a Pittsburgh Pirates fan as far back as the 1979 World Series Championship team ("We R Fam-A-Lee!"). He suffered through the 1980s, then got a reprieve in the early 1990s, only to be crushed by Francisco Cabrera in 1992. After a 20-year stretch of losing seasons, things are looking up for Bobby’s Pirates. His blog can be found at www.baseballonthebrain.com and he tweets at www.twitter.com/bballonthebrain.