Could Greinke Have Hit in Boston?
When I started this piece the Red Sox were going hard for David Price, but they hadn’t signed him yet, and it still wasn’t anywhere close to being a guaranteed deal. Now Price has signed with the Red Sox and Greinke is headed to Arizona (who saw that coming), so this piece is no longer realistic (as though it ever was). I still think it is interesting to think about however, so here you go.
Situation: Price signs elsewhere and the Red Sox are forced to pursue Greinke. As some have hypothesized, Greinke is inclined to stay in the National League so he can continue to hit. To sign him, the Red Sox will have to overpay by a significant margin. Either that or let him hit?
Okay, first a clarification: Greinke would not be the new DH (could you imagine replacing Ortiz on his retirement tour with Greinke). No, he would be given the opportunity to bat, say, in twenty-five of his starts next year (in the contract it would then be determined, the number of games Greinke would get to hit the following years, based on how he hit in the previous year). A few of those starts will be inter-league games, possibly a couple of them would be to give Ortiz a day off, but mostly Ortiz would hit for another player on the field. You might say that wins are money and that since this would cost you wins you should just cough up the money to get Greinke to come to Boston. But what if this would hardly cost you any wins at all? What if the team could be just as good when Greinke hit?
The first thing to do is to find out how good Zack Greinke has been at hitting. In hit National League career he has a wRC+ of 67, though over the last three years he has seemed to improve, hitting to a wRC+ of 87. To give a comparison, Madison Bumgarner, known as a very good hitting pitcher who has even pinch-hit on occasion, has a career 49 wRC+ and a 73 wRC+ over the last three years. It does seem like Greinke has improved, hitting-wise, lately, but he is a pitcher, and you can’t expect too much out of him, so we will take his median wRC+ over the last three years, 74, as a reasonable true talent. So this was a starting point to compare this to other players.
The first name that seems interesting is Ryan Hanigan. Unlike some other Red Sox players who haven’t hit that well of late, no one really expects him to improve. Over the last three seasons he has a wRC+ of 75. This is basically equal to Greinke’s prescribed true talent, so it seems as though we could break even. Against righties however, Hanigan had a wRC+ of 69 over the three-year span, and it was even worse last year at 62. So, it seems that against righties, Greinke, whose wRC+ hardly drops in his three-year sample size, might even be the better hitter. Additionally, Greinke is actually the better baserunner as well. Over the last three years, Greinke is the best baserunning pitcher in baseball, with a BsR score of 0.5, slightly above average. He joins only four other pitchers as above-average baserunners over that time period. Hanigan on the other hand is a below-average baserunner, with a BsR of -4.0 over the last three years. This is just another reason for Greinke to hit instead of Hanigan.
If Hanigan really was the backup catcher, then, assuming Greinke was the better hitter against righties, the Red Sox would already be close to working out a good way for to hit Greinke. Hanigan would become Greinke’s personal catcher, and Greinke would hit instead of Hanigan against righties. Hanigan though is only the backup catcher until Vazquez is healthy. While he has had a setback in playing winter ball, he is expected back early next year. So Greinke hitting for Hanigan may only be an option for around a month.
Vazquez, Castillo and Bradley are all other options to hit for against righties. Bradley and Castillo have had 65 and 69 wRC+’s against righties, respectively. These would seem like great options to pinch hit for, except for the fact that they are supposed to be good candidates to improve. Depending how they do early in the year, both could be able to be hit for by Greinke, though it wouldn’t be great for their confidence. Vazquez actually hit slightly better against righties in his very limited tenure in Boston, though that could reverse itself, since he is right-handed. So it seems as though the Red Sox can piece together 10-15 games where, because of personnel or days off, it makes enough sense to have Greinke hit against righties. They still need 10-15 more starts however.
This brings us to facing lefties, and Pablo Sandoval. Last year was a bad year for Sandoval, but even before that he was bad against lefties. Over the last three years he has had a wRC+ of 61 against lefties. Last year it was even more horrendous, however, as he had a score of 21. Pair this with his -15.1 Def rating last year, and it seems obvious he should not be playing third base with a righty on the mound. The Red Sox may sit Sandoval against lefties anyway, but this could be an opportunity to hit Greinke and get better defense. If the Sox were planning on having Greinke hit, they would do well to try to find a cheap, good-fielding third baseman. If the Red Sox could find someone like Gordon Beckham, who is an inexpensive, above-average defender at third base, that would be a big upgrade on defense. He had a positive 5.5 Def rating playing mostly third last year, and cost the Braves only $1.25 million plus incentives. There are probably countless others, though, that could fill this role.
Sandoval had a wRC+ of 99 against righties last year, so it doesn’t seem like he would be hit for against righties, but if his defense or hitting doesn’t improve, he could be a candidate to be hit for once in a while, even against righties. This is especially the case, given the importance of third base defense when Greinke is pitching. Looking at Greinke’s batted ball spray chart, you see a lot of ground balls. Focusing on those ground balls, you can see third base got a decent amount of attempts, especially ranging left and right, which is Sandoval’s weakness. So, at the rate Sandoval played last year, though he is expected to improve at least slightly, Greinke could hit for him all the time, with a good defender at third.
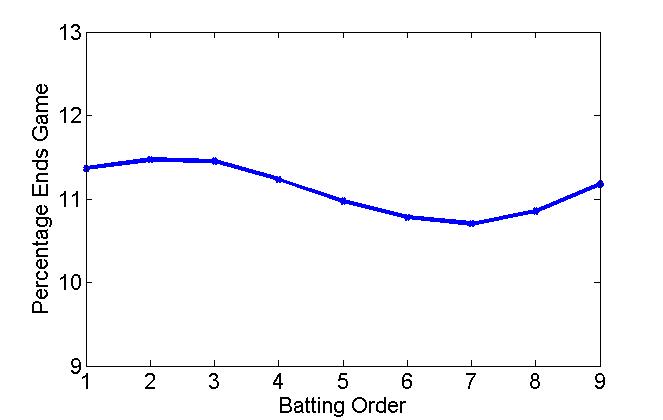
One other thing that should be mentioned is what will happen once Greinke leaves the game. When bullpen pitchers come in, they would then occupy Greinke’s batting spot. This is not as big an issue as it may appear, because bullpen pitchers will usually get pinch-hit for, but it would force Farrell to manage more of a National League game. It is unfortunate that the DH cannot be moved around in the batting order like every other position, but the Red Sox would just have to make use of their fairly deep bench.
Additionally, since 2010 the National League has only scored around six fewer runs per year than the American league from the seventh inning onward. This is the time in the game when the starter is generally out of the game, so National League teams can pinch-hit for their relievers. Since Greinke would only bat in 1/6th of the games, this averages out to be a run per year, or about 1/10th of a win. It could be even less than that since the Red Sox have a quality bench. So the disadvantage of having bullpen pitchers with lineup spots seems to be incredibly minuscule, even almost unnoticeable.
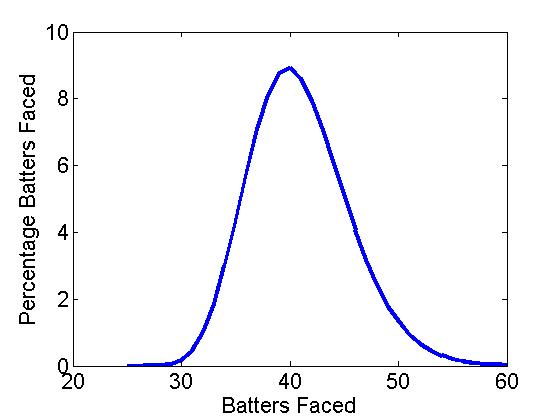
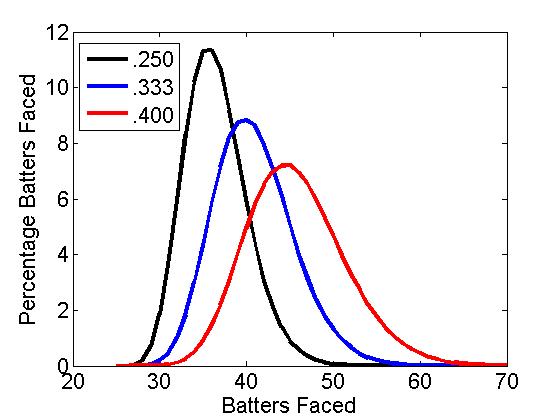
On average, around a third of pitchers are lefty. If the Red Sox try to line up Greinke against lefties, you can probably assume that it will happen around a dozen times. If Greinke gets six starts in April, he will probably face a righty in about four of those games. Greinke will bat for Hanigan on those occasions and for Sandoval against lefties, leaving nine more batting days for Greinke. The Red Sox could probably find nine more days to both take the defensive upgrade and have Greinke bat, rest a slumping player, or simply give starters a day off here and there. These might be slight disadvantages for the team, but could possibly be neutralized with the possible upgrades when Greinke bats for Hanigan and Sandoval.
Overall, if Greinke continued to be the great pitcher he is, a great offense would not be as important to the Red Sox on his pitching days. While on the whole it is probably a slight disadvantage to have Greinke bat, it seems to be very small, and not worth shelling out a few more tens of millions of dollars. The biggest question mark in this is Greinke’s true batting talent. While he has hit well in his career, he has totaled less than 400 plate appearances over his entire career. Anything could happen in this small sample size, so it is hard to know. This probably will never happen, but it is interesting to think about. For now though the Red Sox have Price, and the Diamondbacks just shelled out $206 million for Greinke, so the Red Sox are just as well not even thinking about him hitting in Boston.
We might as well wait until 2020, when Bumgarner will hit the open market, until we think about this again.