Note: I have no idea if I’m the first to do this, but quite frankly I don’t care.
It’s no secret that Yankees second baseman Robinson Cano is an all-around excellent player, as he’s on his way to his fourth consecutive 5-win season. It’s also no secret that he’ll be a free agent after this season, and will certainly receive a contract in the nonuple figures. As the Angels have shown these past two offseasons, when you spend that much money on one player, you’d better be sure he’ll be worth it; the Yankees already have experience with terrible contracts (contracts they’re still due to pay for), so they’ll have very little room for error. Thus, executives of any and every team that might be interested in Cano will be doing their research, scouring the earth for any warning signs of a possible decline.
But back to Cano’s performance at the moment. While Cano is a superb player overall, much of his value comes from his bat; over this current 4-year 5-WAR streak, he’s been the seventh-best offensive player in the majors. The (relative) caveat in his game, therefore, is his defense: over that same span, he’s just 76th in fielding in the majors. Defensive statistics are subject to year-to-year fluctuations, and the fluctuations of Cano’s defense have been well documented. However, there’s a specific aspect of his defense that I’d like to focus on for the time being.
As you probably should know, UZR–the main defensive statistic at FanGraphs–is composed of four parts: RngR, which measures how many runs a player saves or costs his team with his range; ErrR, which measures how many runs a player saves or costs his team by committing or not committing errors; ARM, which measures how many runs a player saves or costs his team with his arm in the outfield; and DPR, which measures how many runs a player saves or costs his team by turning or not turning double plays. This last segment is the one that is so interesting, at least to me, because it’s the one that Cano is the worst in the league at.
No, really. Among 79 qualified infielders¹, Cano’s DPR of -3.6 is the worst, and the next worse player (Neil Walker) is a full 1.2 runs away, at -2.4 DPR².
Now, the real question becomes: what (if anything) does this mean? Obviously, when you’re preparing to give someone a contract that could exceed the GDP of whatever the fuck this country is, you’d prefer if he wasn’t the absolute worst in the majors at something, even a seemingly trivial thing like turning double plays. Still, though, it’s worth asking: what, exactly, is the significance of this?
There are a few different ways of looking at this; for the purpose of this post, I divided my analysis into 5 main categories:
1. Is this a fluke?
As I mentioned before, year-to-year defensive statistics can be quite fickle, so it’s best to gain some historical perspective when evaluating a player’s defense³. So, does Robinson Cano have a history of being a bad double play turner?
Well, on the one hand: In 2011, he was 6th out of 73 qualified infielders in DPR; in 2010, he was 13th out of 81; and in 2007, he was 2nd out of 89. These numbers would suggest that his horrific 2013 has been a fluke, except…
Last year, he was 61st out of 76; in 2009, he was 77th out of 81; in 2008, he was 67th out of 78; in 2006, he was 62nd out of 89; and in 2005, he was 75th out of 77.
Add it all up, and since he entered the league in 2005, Cano is 83rd out of 95 qualified infielders in DPR. However, it should be noted that before this year (i.e. from 2005 to 2012), Cano was 55th, a much more respectable figure, if not a particularly great one.
So, overall, it’s fairly safe to conclude that Cano has something of a poor history of turning double plays. What next?
2. Does a poor DPR correlate to poor defense in other areas?
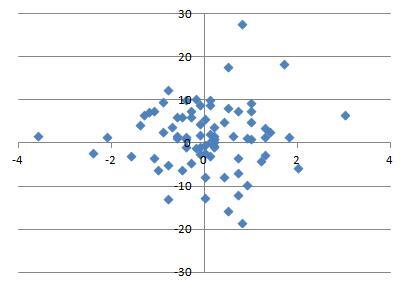
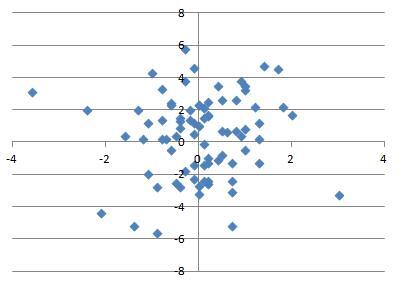
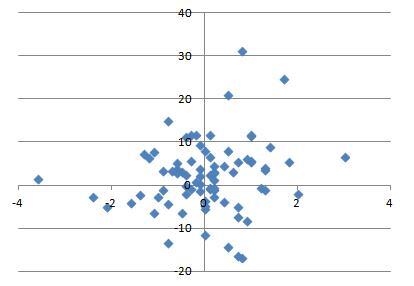
To answer this question, I’ll bring up a few graphs. These’ll show us how well DPR this year has correlated to RngR…
…ErrR…
…UZR…
…and finally, whatever that Def stat is.
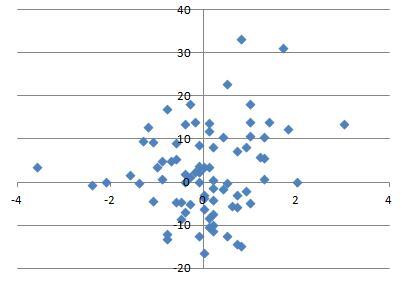
In case you were wondering, the R-squared values for these graphs were .000669, .004252, .028772, and .032933, respectively.
So there’s clearly no correlation between DPR and any other defensive statistic, which brings up the original question: What’s the point of all of this? Well…
3. Just how bad is a -3.6 DPR?
Quite bad, it turns out. In the illustrious 12-year history of the stat, the only worse seasons were Jas0n Bartlett in 2009 (-4.2)⁴, Yunel Escobar in 2008 (-3.7), and Omar Vizquel in 2005 (-4.0).
Again, this takes me back to my original point: when a player’s going to be paid a yearly salary that will exceed the total gross for this shitty movie, you generally don’t want him mentioned among the worst players in history (albeit a very short history).
Still, though, these three were/are good defensive–and all-around–players for the majority of their careers. So what’s to worry about?
4. How have players with similarly poor DPRs done in their seasons?
For this one, I’ll expand the criteria to all seasons with -3 DPR or worse; other than Cano this year, there are 11 such seasons:
Of these 11 seasons, the average WAR was 2.8, less than half of Cano’s WAR this year. The highest WAR was Bartlett’s 5.3 in 2009⁵, but overall the results were much lower.
So it would appear that Cano’s done something relatively new this season–play at a very high level while having a substandard DPR–but this still doesn’t answer the main question. I’ll answer that next, and the results are intriguing:
5. How have other players with DPRs this bad done for the rest of their careers?
Let’s continue to look at these 11 seasons. How were these players before and after their -3 DPR season?
| Player |
WAR-Pre |
WAR-Post |
Off-Pre |
Off-Post |
Def-Pre |
Def-Post |
| Neil Walker |
1.5 |
2.7 |
7.4 |
6.7 |
-6.8 |
-0.1 |
| Jason Bartlett |
3.5 |
0.8 |
4.4 |
-16.7 |
10.5 |
5.4 |
| Yuniesky Betancourt |
0.4 |
-1.4 |
-15 |
-23.8 |
-1.4 |
-7.7 |
| Jason Bartlett |
4.1 |
1 |
6.2 |
-11 |
14.1 |
0.9 |
| Placido Polanco |
3.3 |
2.2 |
1.8 |
-10.3 |
11.3 |
11.9 |
| Yunel Escobar |
3.6 |
3.1 |
10.2 |
-0.5 |
6.4 |
10.9 |
| Brian Roberts |
3.1 |
2.4 |
5.4 |
3.9 |
5.5 |
0.1 |
| Luis Castillo |
2.5 |
1.7 |
1 |
-0.8 |
4.6 |
-1.8 |
| Omar Vizquel |
2.4 |
1 |
-8.8 |
-24.5 |
12.8 |
14.6 |
| Jimmy Rollins |
1.4 |
3.4 |
-5.3 |
4.5 |
0.1 |
10.2 |
| Jose Vidro |
2.3 |
1.2 |
10.3 |
1.2 |
-5.2 |
-9.8 |
| Average |
2.6 |
1.7 |
1.6 |
-6.5 |
4.7 |
3.2 |
(All values are per 600 PAs. Year of DPR is included in Pre.)
They all saw a noticeable drop off in their WAR; the only ones whose WAR increased were Rollins and Walker, and they had their bad seasons when they were young. Given that Cano will turn 31 in October, it’s safe to say this will not happen to him. Since Cano is getting older, a decrease in WAR to some degree should be expected, especially considering the volatility of his position; this has been covered before, though.
What I found interesting, though, was that the players’ defense (as measured by that fancy new Def stat) didn’t really drop off much after the bad DPR year, but their offense seemingly fell off a cliff. This goes against the theory of player aging curves (that offense can get better as players get older, but defense tends to just decline overall).
Obviously, this is a very small sample size, and to extrapolate anything meaningful from it would be foolish. Also, it’s pretty unlikely that the decline was caused by one bad year turning double plays.
This post as a whole was probably rather cockamamie⁶, but then again, everything I post here tends to be. I just hope I was able to raise some interesting questions about how much turning two matters to a player’s overall worth. Perhaps, years from now, when the Yankees are paying Cano $30 million a year to hit .250 with poor defense, and the Orioles have won the division year in and year out, I’ll be able to look back with pride at my prescience.
Or maybe, the Yankees will just win more World Series with or without Cano, while the Orioles dwell in mediocrity every year.
A man can dream, though….
——————————————————————————————————————
¹For some reason which escapes me, there isn’t an option to sort the leaderboards by solely infielders, even though there’s an outfielder option.
²Hopefully, you would’ve figured that out on your own, but I put it in there just to be safe. Also: All stats are as of Saturday, September 21st, 2013.
³Otherwise, you’ll end up with pieces-of-shit “analysis” like this.
⁴Bartlett also had a DPR of -3.8 in 2006, but he didn’t qualify that season.
⁵That was his ridiculous fluke season–you know, the one that Joe Maddon just gets out of every scrub the Rays find on the street.
⁶You have no idea how long I’ve waited to use that word.
