Author Archive

The Silver Sluggers: Another Award to Get Angry About!

Note: I have no idea if I’m the first to do this, but quite frankly I don’t care.

Every year, the Gold Gloves are awarded, and people get pissed off about whom they are awarded to. Every year, the Silver Sluggers are also awarded, and…well, no one really gives a fuck about the Silver Sluggers. Why? Hell, I don’t know. They don’t have the “storied tradition” of the Gold Gloves, the “time-honored legends” or the…uh…”legendary honors”? Look, people like to use weird cliches about how things used to be, and then Mike Bates writes quasi-racist articles¹ about it.

Personally, I enjoy the Silver Sluggers–sarcastically using them as superlatives for a player (“He’s won four, he must be good!”), looking forward to the nominations and announcements of the winners, but most importantly, arguing over them. It’s no secret that most awards are controversial–not just in baseball, but in all walks of life. People have differing opinions, and the technology available today makes it easier than ever for those opinions to be spouted furiously for the whole world to hear. In baseball, though, we are different. We have FACTS! We have EVIDENCE! We have STATISTICS!

What was the point of that disjointed rant? As I mentioned earlier, there has been many a bad pick for the Gold Gloves. However, the same is also true for the Silver Sluggers, and aside from Jeff Sullivan, no one seems to give a damn about it. Well, given that I am no one (see what I did there?), I decided that a damn should be given about it. I tracked down all of the Silver Slugger winners, back to 1980 (when they were first awarded), and saw if their wRC+ was the best at their respective position². What did I find?

Well…There were quite a few snubs. There are now 34 seasons of Silver Sluggers, which means there are 613³ Silver Slugger winners. Of those, 226 (36.9%) were undeserving by my methodology. Most of these were forgivable oversights, but some were simply awful choices; I have presented to you today several of the latter, for your viewing pleasure.

Below, you’ll see the 10 worst Silver Sluggers of all time, as measured by difference between the winner’s wRC+ and the deserved winner’s wRC+.

10. AL Outfield–1991

Winner: Joe Carter (123 wRC+)

Deserving Winner: Danny Tartabull (168 wRC+)

In his last season with the Royals before he headed to the Bronx (and to Seinfeld), Tartabull had the best season of his career, putting up 4.5 WAR for the Royals despite accruing only 557 plate appearances. His fielding was just as poor as it had ever been (-21 Def), meaning that all of his excellence had to be derived from his offense, and it was. In those 557 plate appearances, he batted .316/.397/.593, for a .430 wOBA and a 168 wRC+, highest among all outfielders. But was he good enough to win the award that is given to the best offensive players? Evidently not, as that honor went to Joe Carter and his .273/.330/.503 triple-slash, .361 wOBA, and 123 wRC+. Tartabull was clearly superior to Carter, so why did he get robbed?

It wasn’t for a lack of consistent position–although he would become a full-time DH later in his career, Tartabull started in right field for 124 of the 132 games that he played. Looking at traditional stats, Carter is only marginally better than Tartabull (33 HRs and 108 RBIs for the former, 31 HRs and 100 RBIs for the latter), and he still had a 43-point lead in batting average. Neither of them had won any Silver Sluggers prior to this, although Carter would win one the following year⁴. In this case, I suppose the voters picked Carter because he played the most, even if his aggregate offense was worth less than half that of Tartabull (23.4 wRAA  to 47.9 wRAA). As you’ll soon see, this oversight was acceptable compared to some of the other egregious ones.

9. AL Designated Hitter–1998

Winner: Jose Canseco (110 wRC+)

Deserving Winner: Edgar Martinez (156 wRC+)

The 35-year-old Martinez was still going strong at this point, putting up at least 5 WAR for the fourth of six consecutive years. His 5-win season in 1998 was primarily based on his ability with the bat, as he played 150 of his 154 games at DH. The Mariners were certainly happy with his production, as he hit .322/.429/.565, for a .427 wOBA and a 157 wRC+. However, a certain time-traveling outfielder was instead rewarded with the Silver Slugger, and it’s not hard to see why.

While Martinez hit for a good amount of power, Canseco outslugged him by a mile, or at least in the one area the voters care about. Martinez only had 29 round-trippers, compared to 46 for Canseco. Yes, Canseco also only batted .237 with a .318 OBP, .354 wOBA, and 110 wRC+, but that’s not important–he hit 46 dingers!

Reputation probably didn’t play a huge role with this one, as each player had won three times before (1992, 1995, and 1997 for Martinez; 1988, 1990, 1991 for Canseco⁵). The (theoretical) ability to drive in runners also wasn’t important, as the two players had nearly identical RBI lines (102 for Martinez, 107 for Canseco); moreover, both were equally durable (672 PAs for Martinez, 658 PAs for Canseco). In the end, the ability to hit the ball out of the park was what stole the award from Martinez, even though both rate stats and cumulative stats (12.7 wRAA for Canseco, 53.5 for Martinez) agreed that other factors were important as well.

8. AL Third Base–1995

Winner: Gary Gaetti (111 wRC+)

Deserving Winner: Jim Thome (158 wRC+)

In his first season qualifying for the batting title, Thome didn’t disappoint, as he gave the Indians six wins above replacement level; he was solid with the glove (1.1 Def at third), but his work with the bat set him apart: He smashed 25 home runs in 557 plate appearances, while hitting .314/.438/.558 with a .433 wOBA and 158 wRC+. Nevertheless, he would be disappointed at season’s end–no, not because the Indians lost the World Series, but because he got robbed of an award to measure the best offensive players at any given position!

Anyway, while Thome’s blossoming power was nothing to shrug at, Gaetti’s power was even more impressive, as he hit 35 homers in only 21 more plate appearances. However, his game suffered everywhere else, as he batted only .261, got on base at a .329 clip, and had a wOBA and wRC+ of .360 and 111, respectively. Both of them played the majority of their games at third base, so both were judged against each other; Thome, though, was unarguably better, which was reflected in wRC+ and wRAA (46.2 for Thome, 13.1 for Gaetti). However, the voters have a tendency to not listen to rational arguments, so Gaetti’s superior home run and RBI totals (96 compared to 73 for Thome) gave him the sought-after crown.

7. AL Outfield–1994

Winner: Kirby Puckett (124 wRC+)

Deserving Winner: Paul O’Neill (171 wRC+)

Because 1994 was shortened by the strike, counting stats from this season have to be taken with a grain of salt. One counting stat in particular was the deciding factor in this race, and I’ll soon reveal what it was. O’Neill was in pinstripes for the second of nine straight seasons, and he lived up to the lofty standard that the garb carries. In 443 plate appearances, O’Neill had 4.3 WAR, despite a Def of -10.7; this was due, then, to the fact that he demolished his way to a .359/.460/.603 line, with a .450 wOBA and 171 wRC+. But did the voters care? No, because a wife-beater was supposedly better.

Puckett was certainly good in 1994, hitting .317/.362/.540 with a .381 wOBA and 124 wRC+ in 482 plate appearances. O’Neill, though, had more than double the wRAA (43.6 to 19.3), and the sizable wRC+ lead; in addition, ONeill actually outhomered him, 21 to 20, and had the aforementioned advantage in batting average. Going down the Triple Crown checklist, that leaves one category: RBIs. O’Neill brought 83 runners home–an acceptable total, to say the least. Puckett, however, blew him out of the water, with 112 RBIs–in 108 games! That’s pretty impressive, if you care about such things, and God knows the voters care. Hence, the Silver Slugger was not given to its rightful owner, all because of one useless stat.

6. AL Designated Hitter–1996

Winner: Paul Molitor (114 wRC+)

Deserving Winner: Edgar Martinez (163 wRC+)

Should Martinez make the Hall of Fame? Probably. Will he make the Hall of Fame? Given his recent history, I’m inclined to say no. Would winning two deserved Silver Sluggers have helped his case? Well…Again, nobody really cares about this thing, so probably not. But the point of all of these rhetorical questions is: Martinez was a boss in 1996 (as he was in 1998). The second of six straight five-win seasons, Martinez was a full-time DH, meaning that he had to crank out the offense constantly if he wanted to remain a high performer. He most certainly did crank, to the tune of a .327/.464/.595 triple-slash, with a .450 wOBA and 163 wRC+ in 634 trips to the plate. You wouldn’t know that from looking at the awards, though, as the guy that deserves to be in Cooperstown was shut out by the only guy at his position that is in Cooperstown. What caused this?

While Martinez didn’t hit a whole lot of long balls–his .269 ISO was derived primarily from his 52 doubles, not his 26 homers–Molitor was even worse, hitting only 9 round trippers in 728 plate appearances. What the voters proved in 1996 was that they didn’t depend solely on primitive statistics like “home runs” to determine a player’s worth. They used advanced statistics for the modern age, like batting average and runs batted in! In those regards, Molitor had clear advantages over Martinez, with a .341 average and 113 RBIs. Now, Molitor’s dearth of walks and power meant that his OBP and SLG were a mere .390 and .468, respectively, which in turn meant that his wOBA was .372 and his wRC+ was 114, which in turn meant that he was completely inferior to Martinez in rate and counting stats (23.0 wRAA, compared to 62.2 for Martinez), but he had 113 RBIs! And a .341 average! That’s gotta count for something!

This was not, however, the only big-boned brouhaha that brewed in 1996…

5. NL First Base–1996

Winner: Andres Galarraga (123 wRC+)

Deserving Winner: Jeff Bagwell (173 wRC+)

In Bagwell’s second of four 7-WAR seasons, he put up some serious numbers for the Astros, hitting .315/.451/.570 with a .433 wOBA and a 173 wRC+ in 719 plate appearances as a first baseman; with a -7.8 Def, he needed to mash to earn his keep. Galarraga was also a relatively poor defender (-7.5 Def), so the same went for him. He also hit quite well, or so it would appear; his triple-slash was .304/.357/.601, which gave him a .402 wOBA in 691 plate appearances at first–not that far off from Bagwell. Why, then, was the wRC+ gap so large?

‘Twas about the elevation, dearie. Galarraga played for the Rockies, meaning he played half of his games at Coors Field, meaning he was expected to hit like a monster. While the aforementioned batting line was rather good by major-league standards, it was merely adequate by the mountain standard, and his 123 wRC+ and 39.3 wRAA reflected that. By contrast, Bagwell played in the Astrodome half of the time, which was not particularly good to hitters as a whole⁶; thus, his 173 wRC+ and his 60.1 wRAA.

Obviously, the voters were unaware of the effects a player’s home park can have on his all-around production, or else they would have discounted Galarraga’s 47 home runs and 150 RBIs. With this next case (well, these next few cases, really), though, there’s no excuse.

4. NL Pitcher–1985

Winner: Rick Rhoden (18 wRC+)

Deserving Winner: Mike Krukow (71 wRC+)

My theory is that the voters are all secretly supporters of the DH, and they all want to see it implicated across both leagues. How else can you explain 15 of the 34 pitchers (44.1%) that have won being undeserving, or that the four worst picks (of any position) were all pitchers? Anyway, Krukow was quite good (for a pitcher) with the bat in 1985, slugging his way to a .218/.259/.345 line, with a .271 wOBA and a 71 wRC+; looking at more traditional stats, he hit one home run and had three RBIs in 66 trips to the plate. He was also pretty good with the arm, accruing 3.1 WAR in 194.2 innings for the Giants in his second of six years by the bay.

Rhoden was also solid on the mound in his seventh of eight years with the Pirates, putting up 2.6 WAR in 213.1 innings pitched. He won the Silver Slugger the year before (and actually deserved to), so maybe the voters were just lazy and assumed he hit well the next year. Make no mistake, though–he did not hit well at all in 1985. His triple-slash was an anemic .189/.211/.230, meaning his wOBA was .200 and his wRC+ was 18; he also went homerless, and had only 6 RBIs. His offense (or lack thereof) cost the Pirates 7.2 runs, three times that of Rhoden (-2.4). For reasons that escape me, that performance was apparently Silver Slugger-worthy, and now the wrong man has gone home with the award for yet another year. But don’t you worry–it gets much, much worse…

3. NL Pitcher–1998

Winner: Tom Glavine (37 wRC+)

Deserving Winner: Mike Hampton (91 wRC+)

Hampton is best remembered for two things: Signing the largest contract in baseball history (for the time) with the Rockies and proceeding to stink up the joint before getting traded to the Braves; and being a pretty damn good hitter. Like, a better career wRC+ than Ozzie Guillen good. Yeah, that’s a bad comparison to make, whatever. The point is, Hampton could hit, and 1998 was no exception–in his penultimate year with the Astros, he had a .262/.348/.328 batting line, which translated to a .312 average and a more than satisfactory 91 wRC+. Glavine, on the other hand, was a less than satisfactory hitter, both for his career and in this year⁷. He batted a mere .239/.250/.282, which only gave him a .237 wOBA and a 37 wRC+. Cumulative stats reflect this as well, as Hampton’s offense was worth 5.6 runs more than Glavine’s (-1.2 to -6.8 wRAA). Triple-crown stats don’t reveal anything–neither player homered, although Glavine had seven RBIs to Hampton’s two.

The reason for Glavine’s victory here was likely twofold. One, Glavine pitched better than Hampton, with the former’s 2.47 ERA in 229.1 innings dwarfing the latter’s 3.36 ERA in 211.2 innings. Second, Glavine had a better reputation, which is where it gets complicated. See, Hampton was a good hitter, and Glavine wasn’t (as footnote 7 should make perfectly clear); however, according to reputation, both of these men were good hitters (for their position), as they took home a combined nine Silver Sluggers. The difference between the two? 1998 was the end of Glavine’s run of Silver Sluggers, whereas the next year (i.e. 1999) was the first of five straight for Hampton⁸. In this case, Glavine’s notoriety, which was built up prior to 1998, won him the award, while Hampton’s fame won him a few later (see footnote 8).

Without a doubt, the 1998 pitcher’s Silver Slugger was one of the worst in the history of the award. Sadly, there are two years that were even worse.

2. NL Pitcher–1983

Winner: Fernando Valenzuela (20 wRC+)

Deserving Winner: Tim Lollar (78 wRC+)

Lollar’s career was pretty unremarkable–he put up 2.5 WAR in 906.0 innings for four teams. In 1983, he pitched for the Padres, and he was in line with his career numbers–0.4 WAR and a 4.61 ERA in 175.2 innings. At the plate, though, he was a revelation–well, comparatively speaking. He hit .241/.292/.345 in 65 plate appearances, which gave him a .285 wOBA and a 78 wRC+, best in the National League among qualified pitchers. Valenzuela’s career was notably more remarkable, as his career WAR was 38.5 over 2930.0 innings for six teams. In the year in question, he pitched well for the Dodgers, accruing 3.9 WAR over 257.0 innings (with a 3.75 ERA). Hitting did not work out quite as well, to say the least: In 105 plate appearances, his triple-slash was .187/.194/.253, which translated to a .199 wOBA and a 20 wRC+.

Lollar was much better than Valenzuela, by both advanced and basic stats–they both hit one homer, but Lollar had 11 RBIs to Valenzuela’s 7. Lollar’s offense only cost the Padres 1.7 runs below average, whereas Valenzuela’s took nearly 10 runs away from the Dodgers. This is one of the more puzzling awards (though not as puzzling as the next one); my best guess is that Valenzuela rode on the coattails of his incredible rookie year in 1981⁹. Unfortunately, this was not the darkest hour for the prestigious honor that is the Silver Slugger award; no, that time would come six years later, in a travesty greater than any that came before it,

1. NL Pitcher–1989

Winner: Don Robinson (43 wRC+)

Deserving Winner: Bob Knepper (111 wRC+)

Given that Bob Knepper’s career wRC+ is 3–yes, three–I’m inclined to believe that his 1989 season was a fluke. The second-to-last season of his career, 1989 didn’t go well for him as a pitcher–he put up a 5.13 ERA while costing the Astros and Giants -0.8 wins over 165.0 innings. As a hitter, though, he was never better–somehow, he managed to get on base in 32.7% of his trips to the plate, with a decent .372 slugging percentage for good measure. His competence in these two areas was enough to compensate for his sub-Mendozan batting average (.186) and bring his wOBA and wRC+ to .324 and 111, respectively.

The antithesis to this would be Robinson, who was quite good on the mound (at least by traditional stats), with a 3.43 ERA in 197.0 innings for the Giants, but was completely ineffective at the plate (even for a pitcher). The owner of a respectable career wRC+ of 60, Robinson sunk down to 43 in 1989, as he only batted .185/.195/.309 (.226 wOBA). In what world was that worth more than Knepper? A world where the voters for most major awards rely on archaic means of measuring player performance–i.e. homers and RBIs. Knepper only knocked one out once in 55 plate appearances, while Robinson did it thrice in 82 PAs; Robinson also out-ribbied Knepper, seven to three. When the dust had settled, Knepper was worth 0.5 wRAA, while Robinson was worth -5.4; despite this, the Silver Slugger went to Robinson.

***

Having finally finished with this torturous exercise, I now see why people don’t place any value in the Silver Sluggers. They’re pointless awards, given out solely on reputation and not actual performance. Anyone who takes them seriously is just aksing for…Wait, what’s that? The Orioles won HOW MANY Silver Sluggers?

In summation: The Silver Slugger is the best award in baseball, and it’s a shame that the level of respect for it is as low at it is.

———————————————————————————————–

¹Just to be clear: I thoroughly enjoyed the article, and don’t consider Bates to be racist in any way.

²A little bit about the methodology: I decided on wRC+ (as opposed to, say Off) for two reasons. First, I wanted to see who the best hitters were, not the best offensive players, meaning baserunning was not to be included. Is that small-minded? Probably. Is the award in question called the Silver Slugger/Baserunner, and is the award itself a combination of a silver bat and a silver pair of cleats? Certainly not. Second (and more rationally), I wanted to measure the best hitters overall, not in terms of aggregate value; using Off or wRAA would benefit players that played longer. To pull some numbers out of my ass as an example, a guy with a 140 wRC+ is a better hitter than a guy with a 130 wRC+, but if the latter received 700 plate appearances while the former only received 550, Off or wRAA (or any counting stat) wouldn’t reflect that. But, just to be safe, I also put each player’s wRAA somewhere in the writeup.

³In 2004, there were two AL catchers that won–neither of whom was deserving.

⁴That would also be undeserved; Carter’s 120 wRC+ in 1992 paled in comparison to Shane Mack and his 142 wRC+.

⁵Oddly enough, all of those were deserving. Canseco’s wRC+s of 169, 157, and 152 in 1988, 1990, and 1991, respectively, were among the three best among qualified outfielders in those years, and Martinez’s wRC+s of 165, 182, and 164, respectively, were the best among qualifying DHs in those years.

⁶Side note: Why did this never happen? Come on, people–I expected more from you.

⁷Glavine won four Silver Sluggers over the course of his career (in 1991, 1995, 1996, and 1998). Care to speculate as to how many of those were justified? That’s right, none! In those years, Glavine’s wRC+s were 50, 41, 81, and 37, respectively, when Tommy Greene (94 wRC+ in 1991), Kevin Foster (65 wRC+ in 1995), Jason Isringhausen (84 wRC+ in 1996), and Hampton were far better. Also, in case you were wondering, Glavine’s career wRC+ is 22.

⁸Of those five, three (1999, 2001, and 2002, with wRC+s of 111, 106, and 112, respectively) were the right choice, and two (2000 and 2003, with wRC+s of 56 and 52, respectively, when Omar Daal and Russ Ortiz had wRC+s of 83 and 81, respectively) were not.

⁹He won the Silver Slugger in that year as well, and that was also undeserved, as his 55 wRC+ was outshined by Gaylord Perry’s 71 wRC+.
The Best of the Worst, Or, What Do Roberto Clemente, Pete Rose, and Ted Simmons Have In Common?

Note: I have no idea if I’m the first to do this, but quite frankly I don’t care.

There’s always been something strangely romantic to me about being the absolute worst at something. And when I say worst, I don’t just mean one of the worst–I’m talking about being the absolute worst period whatever period ever period. I can’t explain why it is–perhaps it’s because I’ve been last at virtually everything throughout my life, or perhaps it’s because I’m a fan of the Orioles–but for some reason, I’m transfixed by the idea of being the floor, the ultimate, the person or entity that everyone else looks down upon.

Now, what do my strange, borderline masochistic feelings towards the awful have to do with three of the better all-time players, two of whom are enshrined in Cooperstown and one of whom probably should be? Well, they all have one thing in common, which no one has seemed to realize: At one point or another, they were all the worst qualifying position player in the majors.

How, you ask? When? Why? I’ll answer your questions, but first I’d like to share with you some of the other big names that fit this criteria. Since the season ended on the 29th of September¹, there are now 143 seasons, meaning 143 worst players (or LVPs, for the sake of this exercise). I gathered up each of them, and saw that of the 143 atrocious seasons, many of them involved players that had good–or in some cases, great–careers. I then proceeded to order each player season by career WAR, to present you, the unedumacated reader, with…The Best Of The Worst.

By that, I mean: the following post consists of the top-10 careers (as measured by career WAR) for position players that were the worst in the major leagues for a particular season. I classified the general area of their career that the LVP season happened in: start-of-career bump, middle-of-career fluke, or end-of-career decline; I also put in my attempt at an explanation as to why the bad season happened. Oh, and I also divided them into groups (as they were somewhat similar), à la Bill Simmons’ NBA Trade Value Rankings.

Off we go!

GROUP I: AGING IN THE OUTFIELD²

10. Marquis Grissom

Career WAR: 26.9

LVP year/WAR: 2000/-1.8

Classification: End-of-career decline

Grissom had a solid career for the most part–he won a World Series, with a club that doesn’t tend to do well in the postseason; he won four consecutive Gold Gloves (from 1993 to 1996); at the time of his retirement, he was one of only seven players all-time with 200 home runs, 400 stolen bases, and 2000 hits (a club later joined by Johnny Damon); and he is now, to paraphrase Drake, 46 sittin’ on 51 mil ($51,946,500, to be exact). Also, as you can see above, he compiled a decent career WAR total, including two 5-win seasons in 1992 and 1993 for the Expos. However, you sure as hell wouldn’t have known that from watching his horrid 2000 season.

Traded to the Brewers in 1998 after the Indians resigned Kenny Lofton, Grissom was never able to recapture the magic from his early days north of the border, or at the very least, his sufficing days in Atlanta or Cleveland. At this point, his fielding in center (which peaked at 20.7 Def³ in 1994) was in decline, but his glove work in 2000, while unsatisfactory (-3.8 Def), wasn’t particularly bad for him, as he’d proceed to have Defs lower than that in four of his next (and last) five seasons. His baserunning was also trending downward; his BsR (which peaked at 10.5 in 1992, when he stole 78 bases) had plummeted all the way to -0.5, as he swiped a mere 20 bags. Again, though, this is a relatively minute contribution.

His batting was the major reason for his hideousness in 2000: He put up a Starlinesque triple-slash of .244/.288/.351, in a season when 16 players hit 40 home runs, 15 batted at least .330, and the major league-average triple-slash was .270/.345/.437. This all added up to an Ichiroesque wOBA of .282 and an Hechavarriaesque wRC+ of 59, which, combined with the aforementioned poor baserunning and defense, was enough to give him -1.8 WAR and edge him past Mike Lansing (-1.7) for the LVP.

This disappointing offensive season, while not all that unusual, was certainly a fluke to some degree. In terms of plate discipline, he was basically the same in 2000 (6.1% BB, 15.5% K) as he was for his career (6.2% BB, 13.8% K); it was when he put the ball in play that he got in trouble. His ISO of .108 was his lowest since 1991 (his first full season), and it convalesced the next year to a much healthier .183 (albeit in 172 fewer plate appearances); in addition, his BABIP was at .270, the second-lowest of his career to that point, although it dropped even further, to .242, the next year. It wasn’t like he had a huge rebound in 2001, either; however, the increase in ISO (and not qualifying for the batting title) was enough for a lofty -0.9 WAR in 468 trips to the plate the next year.

9. Carlos Lee

 Career WAR: 28.2

LVP year/WAR: 2010/-1.5

Classification: End-of-career decline

El Caballo clearly had some late-career struggles (as Richard Justice sure liked to point out); the huge (for the time) $100 million dollar deal that Houston signed him to certainly didn’t help the fans’ image of him. The contract notwithstanding, Lee had a decent career–two Silver Sluggers (2005, 2007), a five-win season in 2004 with the White Sox, and the career WAR that precedes this section. He also had the rare (for this era) distinction of never striking out 100 times in a season, and to top it all off, he was a player who acknowledged, and embraced, his critics. Plus, you can’t blame him for signing the contract–blame that dipshit of a GM, Ed Wa-wait, what’s that you say? Lee wasn’t signed to the ridiculous contract by Wade, but by…Tim Purpura? The guy with one reference on his Wikipedia page? Who the hell is he? Oh, whatever. Where was I?

Ah, yes. Lee’s final years. It should be noted that Mr. Lee’s abominable antepenultimate⁴ season was bookended by respectable seasons in 2009 and 2011, when he put up a combined 3.9 WAR–not exactly Mike Trout, but also not Delmon Young. With aaaaaalll of that said, though, the fact of the matter is: Carlos Lee was really goddamn awful in 2010. He provided typical Carlos Lee defense (-23.2 Def, edging his -22.3 Def from 2006 for the worst of his career) and baserunning (-3.6 BsR…pretty much in line with his career numbers), which commiserated with a .246/.291/.417 triple-slash (.310 wOBA, 89 wRC+) to give him a WAR of -1.5.

I brought up earlier that his 2010 season was, to some extent, a fluke. The main reason for his poor offensive showing in 2010 was twofold: a low BABIP (.238, 21 points lower than his previous career low of .259) motivated by a 15.6% line-drive rate, well below his career average of 20%; and a decrease in free passes (5.7% BB, much lower than his career rate of 7.5%). Both of these measure bounced back the following season, to .279 and 9%, respectively.

And lest we forget, 2010 was a year with a looooot of bad players–Melky Cabrera (-1.4 WAR) getting run out of Atlanta, Adam Lind (-1.0) and Jason Kubel (-0.4) coming crashing down to Earth after breakout seasons, Jonny Gomes (-0.4) and Carlos Quentin (-0.3) showing off their fielding prowess, Cesar Izturis (-0.4) being Cesar Izturis…But I digress. The main takeaway: 2010 Carlos Lee=horrible. Basically all other years Carlos Lee=not (to varying degrees).

GROUP II: THEY DON’T RACKA THE DISCIPRINE

8. Ray Durham

Career WAR: 30.3

LVP year/WAR: 1995/-1.4

Classification: Start-of-career bump

The Sugarman’s career met a premature end, but he was a trusty player for most of it. He was never a star player–his career-high single-season WAR was 3.9 in 2001, in his last full year with the White Sox–but he was always a contributor, putting up at least a two-win season for nine of the eleven seasons from 1996 to 2006. He made two All-Star teams (in 1998 and 2000), scored 100 runs in every year from 1997 to 2002 (if you care about such things), and stole at least 23 bases a season over that span (plus 30 in 1996). When his career started, though, he was just a fifth-round draft pick by the White Sox in 1990, who worked his way up through the farm system and won the starting second baseman job in 1995 spring training. How did that first season go?

Well, let’s start by saying he was never a very good defender. His career high Def was 8.1 in 2001, and he followed that up with -11.9 in 2002; for his career, his Def was -62.5, 2nd-worst among second basemen over that time. In the year in question, though, he took his defense to a new level. He put up…a -20.7 Def. Now, that doesn’t sound particularly (or at least historically) shitty, at least at first glance; after all, three players had worse figures this year alone⁵. However, one must consider the position that Mr. Durham manned was (and is) one of the premier defensive positions on the field, such that there have only been two–count ’em, two–players ever with a Def lower than that at second: Todd Walker (-21.5) in 1998, and Tony Womack (-24.2) in 1997. What’s more, Durham achieved that in only 1049.2 innings (in 122 games played); supposing he played 20% more innings (~1250, a standard 7 of the 19 qualified second basemen reached in 2013), he could have easily had a -25 Def, a depth the likes of which no second baseman has sunk to.

As dreadful as he was with the glove, he was still pretty reprehensible with the bat. In 517 plate appearances, he posted a .257/.309/.384 triple-slash and a .306 wOBA. In this day and age, those numbers are all right; in 2013, Brandon Phillips was able to put up a 91 wRC+ with similar lines. During the height of the PAWSTMOMNEP⁶ Era, in the Cell? Those numbers are unacceptable, and this was reflected in Durham’s 82 wRC+ and -10.9 Off. His awfulness in these two areas was not offset by his relatively solid baserunning (1.3 BsR), and he finished the season with a WAR of -1.4, which tied him with Kevin Stocker for the honor of ultimate player.

Durham’s defense never became great, but his offense rebounded after this fluke rookie season. His 6% walk rate as a rookie was much lower than his career average of 9.7%, and was by far the lowest of his career; his .127 ISO as a rookie was also considerably lower than his career ISO of .158, and was the third-lowest of his career. He was inconsistent for a few years after 1995, alternating between solid (2.0 WAR in 1996, 3.2 in 1998) and not so solid (0.3 in 1997, 1.2 in 1999), before accruing 2.7 WAR in 2000, the start of a seven-year run of at least two wins. But, despite what this article might lead you to believe, he was not, in fact, a good rookie.

7. Ron Fairly

Career WAR: 35.3

LVP year/WAR: 1967/-0.8

Classification: Middle-of-career fluke

In terms of hitting, Fairly is akin to the players that precedes him (and the player that he precedes): They all have so-so averages and power numbers, in addition to undesirable defense, but have fairly good plate discipline, which allowed them to enjoy fruitful careers. Hence, the cheesy and racist title for this section⁷.

Anyway…Fairly was another player like Durham–never elite, but always productive. He had two 4-win seasons (1970 and 1973), made the All-Star team in 1973 and 1977, and owned a career .360 OBP in an era where there was a dearth of offense. He also won three World Series, in 1959, 1963, and 1965–all with the Dodgers, with whom he spent the first 11.5 years of his 21 years in the majors. He was adequate throughout most of his tenure in Los Angeles; after his first three seasons (1958-60) when he didn’t start, he put up at least 1.9 WAR in each of the next six seasons (1961-66).

And then along came his putrid 1967. “How putrid?” you inquire. Very putrid, I reply. His defense (-15.7 Def in 1167.1 innings) and baserunning (-1.5 BsR) were as weak as they’d ever been , but this year was all about the offense. As a well-conducted player at the plate, Fairly took the base on balls quite a bit in his career–about once in every eight trips to the plate (12.5%). While his BB% of 9.7% was down from that average, and the lowest of his career to that point, it was basically in line with the MLB average of 9.8%; in addition, his strikeout rate of 9.2% (compared to 10.4% for his career) was well below the MLB average of 15.8%.

Like with Grissom, Fairly’s issues were chiefly with balls in play. He didn’t have a whole lot in the way of power, as his .101 ISO was a good deal below the major league-average of .148, and below his respectable career ISO of .142. The luck dragons were also not particularly fond of him that year; his BABIP freefell to a hapless .224. Even in the year prior to The Year Of The Pitcher, the major leagues still managed to hit .255/.302/.404, with a .280 BABIP and a .148 ISO; Mr. Fairly “hit” .220/.295/.321, which gave him a .277 wOBA and an 82 wRC+ (as opposed to .329 and 113 for MLB). In the end, he had -0.8 WAR for the year, which tied him with Zoilo Versalles for the LVP title⁸.

In summary, ISO and BABIP were the main reasons for Fairly’s nauseating 1967; each was down from .177 and .288 figures the year before, and after another down year in 1968 (.066 and .259)⁹, they would rebound to .202 and .270 in 1969, and would remain high as Fairly enjoyed the best years of his career in Montreal¹º.

6. Eddie Yost

 Career WAR: 37

LVP year/WAR: 1947/-0.8

Classification: Start-of-career bump

As Matt Klaassen wrote last year, one can only express sorrow when looking back at the career of Mr. Yost, who played 60 years too early. For his career, the third baseman had a modest .254 batting average and .371 slugging percentage, but a phenomenal .394 on-base percentage, due to a 17.6% career walk rate that, as the article points out, is second only to Barry Bonds since 1940. However, this was in the pre-pre-pre-Moneyball days, before many people knew about any stats, much less “advanced” stats like OBP. So, sadly, Yost is doomed to walk the earth as a forgotten man. Well, not really–he died last year–but you get what I’m saying.

In 1947, however? Eddie Yost wasn’t underappreciated, as anyone who knew anything about baseball could see that he was awful. After logging 47 combined plate appearances in 1944 and 1946 (and joining the navy in 1945, just in time for the end of the war), Yost finally got a chance to start in 1947, getting 485 plate appearances for the Washington Senators. How did he do with those plate appearances? Well…

He accrued free passes, or so it would appear at first glance; his walk rate of 9.3% would be sterling in this era, what with our major league walk rate of 7.9%. Back then, however, the major league walk rate was 9.7%, so he was actually below average; moreover, the major league strikeout rate was 9.6%, meaning his 11.8% strikeout rate was worse that average. His defense–which would never be that good, as his -91.7 career Def shows–was also rather lousy, to the tune of -6 Def, as was his baserunning (-1.5 BsR). However, it’s possible to play at an elite level with poor plate discipline (as Carlos Gomez sure has shown) and with poor fielding (as Miguel Cabrera sure has shown); what, then, made him so dissatisfactory?

Well, as that annoying bundle of sticks that the women love might say, it was all about (hashtag) that power. He had a .054 ISO; even in a year where the average ISO was .117, that’s not exactly Miggy levels. His BABIP was right around average (.275, to .277 for the majors), but this Pierre-like power, coupled with the aforementioned above-average strikeout rate, gave him a batting average of .238 and a slugging percentage of .292. His on-base percentage was a solid .312; however, the major league-average OBP was .336, along with a .261 AVG and .378 SLG. All of this commiserated to give him a .277 wOBA, 84 wRC+, and -17.1 Off; when Green Day was awakened, Fairly had -0.8 WAR, which beat out Jerry Priddy (-0.6) for the LVP title.

From there, Yost only got better. Yeah, there wasn’t much worse he could get, but his WAR still improved in each of the next four seasons, and he was a two-win player for seven straight years (1950-56). He pinnacled with 6.2 WAR in 1959, when he even hit for decent power, socking 21 dingers (with a .157 ISO) in his first year after leaving The Black Hole Known As Griffith Stadium¹¹. It’s a shame he had to start out as shittily as it did.

GROUP III: A ROCK AND GUITAR PLACE¹² (OR, AGING IN THE OUTFIELD, PART II)

5. Dave Parker

Career WAR: 41.1

LVP year/WAR: 1987/-0.6

Classification: End-of-career decline

Paul Swydan reminisced on the career of Parker earlier this year after it was announced that he (i.e. Parker) had Parkinson’s disease. I’ll briefly rehash Swydan’s reporting here.

Parker’s job when called up was to replace the player who is #1 on this list, and obviously, those were some big shoes to fill. Parker did not shrink from the spotlight, however, as he produced 30.3 WAR over his first five full seasons (1975-79), which tied him with The Despised One for fourth-most in the majors over that span. He attained quite a bit of hardware over this time as well–the NL MVP trophy in 1978 and Gilded Gloves¹³ in 1977-79–and won batting titles in 1977 and 1978.

These five years were the best of his career, and after the fourth year (1978) he was rewarded with a five-year, $5 million-dollar contract–the largest in MLB history at the time. However, much like a certain power-hitting Pennsylvanian today, he would struggle to live up to this contract; after the first year (1979), when he put up 5.7 WAR and was instrumental in helping the Pirates win the Fall Classic, he would only log 1660 plate appearances over the final four years of the deal (and only contribute 1.6 WAR in those years). This was due to several factors, namely his affinity for a certain white substance that is, generally speaking, frowned upon in our society; his continued usage of said substance earned him a full-year suspension for the 1986 season, which he was able to circumvent via community service, donations of his salary, and submission to random drug tests.

After his contract expired in 1983, he signed with the Reds, and his production was essentially the same as in the last few years in Shitts¹⁴ Pittsburgh (save for his fluky, 5.4-WAR 1985 season) and as it would be for the rest of his career. There was one year in particular, though, where he really hit rock bottom: the year that followed the suspension year.

In the year in question–his last in Cincy–Parker was, shall we say, no muy bueno. A career .290/.339/.471 hitter, Parker hit .253/.311/.433 in 1987. While one might attribute this to his 16.1% strikeout rate and 6.8% walk rate (compared to 15.5% and 8.9%, respectively, for the majors), these numbers are actually pretty analogous to his career numbers (15.1% and 6.1%, respectively). His power was also comparable to his career figures (.180 ISO in 1987, .181 for his career).

For Mr. Parker (like for so many of the others on this list) the issues arose from two areas: when the other team fielded the balls he hit, and when he fielded the balls the other team hit. Parker’s .265 BABIP was the lowest of his career for a full season, not to mention being 49 points below his career BABIP of .314 and 24 points below the major league-average BABIP of .289. His glovework also left something to be desired¹⁵–he posted a -17.8 Def, which was second-worst in the majors.

Overall, his hitting wasn’t too dreadful–his triple-slash was good enough for a .316 wOBA and 87 wRC+. He wasn’t even that bad, period–his WAR was -0.6, a relatively good figure. Out of the 143 seasons, only 5 players were LVPs with a higher WAR; Parker was just unfortunate enough to have a down season in a year where the only serious competition for the LVP was Cory Snyder (-0.5).

One last thing on Parker: As painful as his 1987 season was, his last season (1991) was even worse–he had -1.2 WAR in only 541 plate appearances for the Angels and Blue Jays. Unfortunately, he was robbed of the LVP crown by some scrub named Alvin Davis. Hah! What a loser! It’s not like any site editor has ever vehemently defended Davis and would cancel my account if I was to insult Mr. Mariner!

(Your move, Cameron.)

4. Bernie Williams

Career WAR: 44.3

LVP year/WAR: 2005/-2.3

Classification: End-of-career decline

Williams’ case for Cooperstown has generated quite a bit of controversy, over everything from the impact and weighting of postseason play to the cost of defense to True Yankeedom. That point, however, is now moot, as Williams is now off the ballot; whether or not he deserves to be is a can of shit I’d rather not open right now.

With Williams, the superlatives are certainly present–five All-Star appearances (1997-2001), four Gilded Gloves¹⁵ (1997-2000), four World Series rings (1996, 1998-2000), a Silver Slugger (2002), and the ALCS MVP in 2002. He also had seven 4-WAR seasons over an eight-year period (1995-2002), and was the 12th-most valuable position player in baseball over that time. Plus, he was, y’know, a True Yankee.

It’s the years to which this period came prior that I am focusing on. After that eight-year run of dominance, Williams fell off a cliff (as Paul Swydan explained earlier this year), putting up…wait for it…-3.3 WAR over the next four seasons, dead last in the majors in that span. Most of that negative WAR came from one year: 2005, the second-to-last of Mr. Williams’ career.

In said year, Williams (he of the career .297/.381/.477 triple-slash) batted a mere .249/.321/.367. The PAWSTMOMNEP Era was beginning to transition into the Era of the Pitcher, but offenses were still favored–the major league triple-slash was .264/.330/.419–and Williams’ batting (and -1.4-run baserunning) was enough to give him a .305 wOBA, 85 wRC+, and -11.2 Off. His strikeout rate in 2005 (13.7%) mirrored his career rate (13.4%) and was much better than the MLB rate (16.4%), and while his walk rate of 9.7% was low by his standards (career walk rate of 11.8%), it was still considerably better than the MLB average of 8.2%; his batted-ball rates were also all right (19% LD/43.5% GB/37.5% FB). It was a poor BABIP (.270, as opposed to .318 for his career and .295 for MLB) and a poorer ISO (.118, as opposed to .180 for his career and .154 for MLB) that did him in.

But Williams’ offensive struggles pale in comparison to his defensive ineptitude. Never the greatest with the glove, Williams hit a new low in 2005¹⁶, as he had a -30.2 Def in 862.2 innings. In terms of UZR, he was 29.2 runs below average, and because he didn’t play that much, his performance extrapolates to 42.5 runs below average per 150 games. As a point of reference, Adam Dunn’s worst career UZR/150 as a outfielder was -39.2 in 2009. So, yeah.

The disconcerting work in the field by Williams, coupled with ineffectiveness at the plate, gave him a -2.3 WAR for the year; this put him in a class of his own, as the next-worst player was Scott Hatteberg, whose -0.7 WAR was a full 1.6 behind him. Maybe, if his production hadn’t completely deteriorated at the tail end of his career, Williams would be in the Hall right now, and the point would still be moot, but for a better reason.

GROUP IV: CENTRAL COMPETITORS

3. Ted Simmons

Career WAR: 54.2

LVP year/WAR: 1984/-2.4

Classification: End-of-career decline

Look, I’m not saying Ted Simmons should go to the Hall of Fame. What I will say is this:

Career PA Career WAR
Player A 9685 54.2
Player B 9278 54.9

Simmons is player A. Ichiro Suzuki is player B. Just sayin’.

Anyway, regardless of one’s opinion on Mr. Simmons, one cannot deny that he was an excellent all-around player for most of his career. People of his day certainly didn’t, as he was named to eight All-Star teams (1972-74, 1977-79, 1981, 1983) and won a Silver Slugger (1980). He was generally regarded as the second-best hitting catcher of his era, behind Johnny Bench, and while catchers are held to a lower offensive standard than most other players, he was no slouch with the bat–his career wRC+ was 116, better than Adrian Beltre and Andruw Jones. His defense was mediocre (53rd out of 113 catchers in Def over the course of his career), but he was still outstanding, as the above comparison should show.

Like all mortal men, though, Simmons’ production decayed as he aged; after contributing at least three wins in 12 of 13 seasons from 1971 to 1983, he was at or below replacement level in four of his last five years. In the first of those five years, he was a special kind of awful.

In 1983 (the last year of the 13-year period), Simmons was actually quite valuable, to the tune of 3.7 WAR for the Brewers. The next year…well, everything fell apart. His triple-slash collapsed from a healthy .308/.351/.448 to a sickly .221/.269/.300, which took his wOBA from .352 to .259, his wRC+ from 122 to 60, and his Off from 16.6 to -24.6. His plate discipline was fairly similar in both years (6.3% BB%, 7.8% K% in 1983; 5.6% and 7.5% in 1984), although his walk rate in both years was a good deal below his career average of 8.8%. This meltdown was primarily caused by a David Murphy-like¹⁷ dropoff in BABIP, from .317 to .233, and a near-halving of ISO, from .140 to .078; both of these numbers were a good deal below Simmons’ career numbers (.284 and .152, respectively). What’s more, he spent most of his time at DH, meaning he was held to a higher offensive standard; thus, these already bad numbers were reduced even further.

When Simmons did play in the field (at first and third, not catcher), his defense was somewhat rotten, as he posted -4 TZ in 457.1 combined innings. With the subtracted defensive runs for not fielding at all, his Def dropped from -3 in 1983 to -14.5 Def (12th-worst in the majors) in 1984.

When the dust had settled, Simmons was left with -2.4 WAR, which gave him a comfortable lead over Curtis Wilkerson (-1.1) for the LVP honor. Simmons never really got much better than this–he gave the Brew crew 1 WAR in 1985, before costing the Braves a combined 1 win as a utility man over the next three years. Retiring at age 39, Simmons might’ve been enshrined if he had kept up his consistency into his late 30s.

While Simmons was arguably Hall-worthy, there’s no arguing over these next two. Well, there actually is a fair amount of arguing over this next guy, but…never mind.

2. Pete Rose

Career WAR: 80.3

LVP year/WAR: 1983/-1.9

Classification: End-of-career decline

Yes, the LVP in back-to-back years was a very valuable player overall. Surprised? Well, that’s allowable–when you started reading this, you probably had no idea what you were reading in the first place, much less if it would involve two exceptional players performing uncharacteristically poorly in two consecutive years.

Moving on…Rose hardly needs an introduction, but I’ll give him one anyway. Seventeen All-Star nods (1965, 1967-71, 1973-82, 1985); a three-time batting champion (1968-69, 1973) and three-time World Series champion (1975-76, 1980); two Gilded Gloves (1969-70); a Silver Slugger in 1981; the NL ROTY¹⁸ and MVP in 1963 and 1973, respectively; and one of the better (and most deserved)¹⁹ nicknames in baseball. Plus, there was that whole 4,256 hits thing, but nobody cares about that.

Rose spent most of his career with the Reds, winning two of his three championships with them. The third? That was won with the Phillies, with whom he spent five mostly forgettable years at the end of his career. After averaging 4.7 WAR over his first sixteen seasons with the Reds (and being the fourth-most valuable player in baseball over that span), Rose only earned 3.8 WAR in the next five years combined. To be fair, he was at least middling for the first four years, finishing above replacement level in each. In the last year (1983), however, he was anything but middling–and not in a good way.

1983 wasn’t a particularly great year for hitters–the aggregate MLB triple-slash was .261/.325/.389; nonetheless, Rose was still considerably below thoe numbers. Never one to hit for power (his best ISO was .164 in 1969), he sunk to new lows in 1983, pulling a Ben Revere;²º his ISO at season’s end was a repulsive .041, considerably lower than the major league ISO of .128. BABIP also wasn’t too kind to him, as he posted a .256 mark in that department, a good deal below the major league BABIP of .285. His plate discipline was superb (9.4% and 5% walk and strikeout rates, compared to 8.4% and 13.5%, respectively, for the majors), but this could not compensate for his failings in the other areas, and he ended up with a .245/.316/.286 triple-slash, with a .277 wOBA, 68 wRC+, and -21.6 Off.

He didn’t do himself any favors on the basepaths (-1.5 BsR) or in the field (-8 TZ, -14.7 Def in 1034 innings between first and the oufield), but he was never the greatest in those categories. In this one year, he was an all-bat guy with no bat²¹, and that usually doesn’t have good results.

When all was said and done, Rose’s WAR was -1.9, a figure that easily bested Dave Stapleton (-0.7) for the LVP title. One last note on Rose: Unlike the #1 player on this list, people seem to be cognizant of Rose’s awfulness in his LVP year–probably because Rose’s year occured near the end of his career, and he never received a chance to outshine it. This next guy, though? Well…

1. Roberto Clemente 

Career WAR: 80.5

LVP year/WAR: 1955/-0.9

Classification: Start-of-career bump

Yeah, I’d say he made up for one bad season. Either that, or fifteen All-Star games (1960-67, 1969-72)²², twelve consecutive Gold Gloves²³ (1961-72), four batting crowns (1961, 1964-65, 1967), the NL MVP (1966), the WS MVP (1971), and 80.1 career WAR were all for naught.

Despite all of the undeniable awesomeness of Clemente’s career as a whole, there is still that one blemish on his record: his less-than-perfect rookie year. After being drafted by the Pirates in 1954, Clemente was given the opportunity to start immediately, and the outcome wasn’t very good.

Clemente was never a particularly patient hitter, with a career BB% of 6.1%; in 1955, however, he was especially anxious, with a 3.6% BB% that was a good deal below the major league-average of 9.5%, and was the second-worst individual figure in the majors²⁴. He didn’t strike out that much, as his 12% K% wasn’t too much worse than the major league-average of 11.4%, and was identical to his career rate.

Always a high-BABIP guy (with a career number of .343), Clemente’s balls were unable to find holes in 1955, as he had a BABIP of .282 that, while being higher than the major league BABIP of .272, was still the second-lowest of Clemente’s career. His power also hadn’t developed yet²⁵, as his .127 ISO (which was also similar to the major league ISO of .136) was much lower than his career ISO of .158. Overall, Clemente batted .255/.284/.382, with a .294 wOBA, 73 wRC+, and -18.5 Off. His baserunning wasn’t much of a factor (-1.3 runs, compared to 2.1 total for his career), but on defense, he was substandard, putting up a -4.6 Def that was 21st out of 31 outfielders²⁶.

This all coalesced into a WAR of -0.9, which allowed Clemente to beat Don Mueller (-0.7) for the LVP title by a narrow margin. It would take Clemente a few years to really get going; from 1956 to 1959, he was worth a modest 8.9 WAR²⁷ (44th in the majors) as he struggled through various injuries. By 1960, though, he was healthy, and would contribute 72.7 WAR (fourth in the majors) from then until…well, you know.

***

What does all of this mean? Well, the average major league player is worth 2.97 wins over the course of their career; the average player that won an LVP is worth 6.04 wins over the course of their career. Impacted by outliers, you say? Even when the ten players listed here are taken out, the average career WAR of the remaining 133 is 3.05–slightly better than for every player. Looking a little deeper, we can see that of the 16,292 players with a plate appearance, 852 (or 5.2%) are worth 20 or more wins over the course of their careers. For LVPs? 15 out of 143, or 10.5%²⁸.

Is this good news for Eric Hosmer and Adeiny Hechavarria? Possibly. Would assuming this is good news for Hosmer and Hechavarria be drawing a causation from a correlation? Probably. I don’t know. What do I know? I know that if you read this all of the way through, I just wasted a sizable chunk of your time. And in my book, that is a job well done.

——————————————————————————————————-

¹Or the 30th, technically. Whatever.

²As far as I can tell, that’s an original joke. Feel free to chastise me if I’m wrong.

³How exactly do I cite the Def stat? Is it a plural type of thing, like “Player X had 5 Defs last year”, or a singular, like…well, like I wrote in the post?

⁴Spellcheck, you have crossed a line.

⁵The worst fielder in the majors, according to Def? Carlos Beltran and his -21.4. Yes, the three-time Gold Glove-winning, two-time Fielding Bible-winning Carlos Beltran. Yes, I’m also unsure how to react.

Why has no one else realized this, though? Cameron? Sullivan? God forbid, Cistulli? I’m looking at you all! Write something about this, or else I’ll be forced to!

⁶You know, the Possibly Affiliated With Substances That May Or May Not Enhance Performance Era.

⁷Hey, it’s South Park’s words, not mine.

⁸Versalles’ career was also rather notable–and not just for his abnormal appellation.

⁹To be fair, every hitter had a down year in 1968.

¹ºOne doesn’t receive too many opportunities to type this (much to the chagrin of Mr. Keri).

¹¹According to the B-R bullpen, there were only two–count ’em, two–fair balls ever hit out of Griffith. TWO! In 51 motherfucking seasons! So Safeco ain’t so bad, I guess.

¹²Get it? ‘Cuz Parker did…and Williams did…oh, never mind.

¹³Not a typo (read on).

¹⁴Sorry, force of habit (I’m a Ravens fan).

¹⁵In a manner not dissimilar to a controversial shortstop of our era (or to the next player on the list), Parker was always one whose reputation overshadowed his production in the field, as neither basic statistics (.965 career fielding percentage, 137th out of 167 players over the course of his career) nor advanced statistics (-127.5 career Def, 688th out of 704 players over the course of his career) were particularly fond of his work with the glove.

¹⁶Actually, every Yankees defender hit a new low in 2005, as their team defense was the lowest of any team in the UZR era (-141.7 runs); this was due in no small part to the horrifying outfield of Williams, Gary Sheffield (-26 UZR), and Hideki Matsui (-15.2 UZR).

¹⁷I’ll have more on that in the coming weeks.

¹⁸How does one abbreivate Rookie of the Year? ROTY, RotY, or some combination of the two?

¹⁹Deserved on more than one level.

²ºI shouldn’t need to explain what I mean by that. Also, Rose pulled a Ben Revere in 1984 and 1986, albeit in non-qualifying seasons.

²¹I know I’ve heard that expression before–I think it was used to describe Jesus Montero–but I can’t seem to find where it was used.

²²No, I didn’t do my math wrong–from 1959 to 1962, MLB had two All-Star games.

²³I was going back and forth about whether to call this one gilded; over the indicated time span, Clemente was eighth among outfielders in Def–quite good, but not the best (as winning a Gold Glove in each year would imply).

²⁴It was not, however, the worst mark of his career, as he would post walk rates of 2.3% and 3.3% in 1956 and 1959, respectively.

²⁵In terms of power, Clemente was a late peaker, with five of his six highest ISOs coming during or after his age-31 season (1966). I’d be interested in knowing how common that is.

²⁶For whatever reason, defensive records for each individual outfield position only go back to 1956–any time before that, it’s all just lumped into “Outfield”. Also, for that matter, innings played on defense only go back to that date as well, which doesn’t seem to make sense, given that play-by-play data is available back then.

²⁷Interestingly enough, Clemente’s greatest defensive seasons were during this period. He had 20.7 Def in 1958, and 19.3 in 1957; his next-best season with the glove was in 1968 (16.8).

²⁸The other five (besides the ten listed here): Milt Stock (22.3 career WAR, -2.7 in 1924); Alvin Davis (21.1 career WAR, -1.6 in 1991); Raul Ibanez (20.5 career WAR, -1.7 in 2011); Jason Bay (20.3 career WAR, -1.1 in 2007); and Buck Weaver (20.3 career WAR, -1.1 in 1912).


Robinson Cano and the Value of Turning Two

Note: I have no idea if I’m the first to do this, but quite frankly I don’t care.

It’s no secret that Yankees second baseman Robinson Cano is an all-around excellent player, as he’s on his way to his fourth consecutive 5-win season. It’s also no secret that he’ll be a free agent after this season, and will certainly receive a contract in the nonuple figures. As the Angels have shown these past two offseasons, when you spend that much money on one player, you’d better be sure he’ll be worth it; the Yankees already have experience with terrible contracts (contracts they’re still due to pay for), so they’ll have very little room for error. Thus, executives of any and every team that might be interested in Cano will be doing their research, scouring the earth for any warning signs of a possible decline.

But back to Cano’s performance at the moment. While Cano is a superb player overall, much of his value comes from his bat; over this current 4-year 5-WAR streak, he’s been the seventh-best offensive player in the majors. The (relative) caveat in his game, therefore, is his defense: over that same span, he’s just 76th in fielding in the majors. Defensive statistics are subject to year-to-year fluctuations, and the fluctuations of Cano’s defense have been well documented. However, there’s a specific aspect of his defense that I’d like to focus on for the time being.

As you probably should know, UZR–the main defensive statistic at FanGraphs–is composed of four parts: RngR, which measures how many runs a player saves or costs his team with his range; ErrR, which measures how many runs a player saves or costs his team by committing or not committing errors;  ARM, which measures how many runs a player saves or costs his team with his arm in the outfield; and DPR, which measures how many runs a player saves or costs his team by turning or not turning double plays. This last segment is the one that is so interesting, at least to me, because it’s the one that Cano is the worst in the league at.

No, really. Among 79 qualified infielders¹, Cano’s DPR of -3.6 is the worst, and the next worse player (Neil Walker) is a full 1.2 runs away, at -2.4 DPR².

Now, the real question becomes: what (if anything) does this mean? Obviously, when you’re preparing to give someone a contract that could exceed the GDP of whatever the fuck this country is, you’d prefer if he wasn’t the absolute worst in the majors at something, even a seemingly trivial thing like turning double plays. Still, though, it’s worth asking: what, exactly, is the significance of this?

There are a few different ways of looking at this; for the purpose of this post, I divided my analysis into 5 main categories:

1. Is this a fluke?

As I mentioned before, year-to-year defensive statistics can be quite fickle, so it’s best to gain some historical perspective when evaluating a player’s defense³. So, does Robinson Cano have a history of being a bad double play turner?

Well, on the one hand: In 2011, he was 6th out of 73 qualified infielders in DPR; in 2010, he was 13th out of 81; and in 2007, he was 2nd out of 89. These numbers would suggest that his horrific 2013 has been a fluke, except…

Last year, he was 61st out of 76; in 2009, he was 77th out of 81; in 2008, he was 67th out of 78; in 2006, he was 62nd out of 89; and in 2005, he was 75th out of 77.

Add it all up, and since he entered the league in 2005, Cano is 83rd out of 95 qualified infielders in DPR. However, it should be noted that before this year (i.e. from 2005 to 2012), Cano was 55th, a much more respectable figure, if not a particularly great one.

So, overall, it’s fairly safe to conclude that Cano has something of a poor history of turning double plays. What next?

2. Does a poor DPR correlate to poor defense in other areas?

To answer this question, I’ll bring up a few graphs. These’ll show us how well DPR this year has correlated to RngR…

DPR-RngR

…ErrR…

DPR-ErrR

…UZR…

DPR-UZR

…and finally, whatever that Def stat is.

DPR-Def

In case you were wondering, the R-squared values for these graphs were .000669, .004252, .028772, and .032933, respectively.

So there’s clearly no correlation between DPR and any other defensive statistic, which brings up the original question: What’s the point of all of this? Well…

3. Just how bad is a -3.6 DPR?

Quite bad, it turns out. In the illustrious 12-year history of the stat, the only worse seasons were Jas0n Bartlett in 2009 (-4.2)⁴, Yunel Escobar in 2008 (-3.7), and Omar Vizquel in 2005 (-4.0).

Again, this takes me back to my original point: when a player’s going to be paid a yearly salary that will exceed the total gross for this shitty movie, you generally don’t want him mentioned among the worst players in history (albeit a very short history).

Still, though, these three were/are good defensive–and all-around–players for the majority of their careers. So what’s to worry about?

4. How have players with similarly poor DPRs done in their seasons?

For this one, I’ll expand the criteria to all seasons with -3 DPR or worse; other than Cano this year, there are 11 such seasons:

Player Year DPR
Neil Walker 2011 -3.2
Jason Bartlett 2010 -3.1
Yuniesky Betancourt 2010 -3.5
Jason Bartlett 2009 -4.2
Placido Polanco 2008 -3.1
Yunel Escobar 2008 -3.7
Brian Roberts 2007 -3.2
Luis Castillo 2006 -3.0
Omar Vizquel 2005 -4.0
Jimmy Rollins 2002 -3.1
Jose Vidro 2002 -3.5

Of these 11 seasons, the average WAR was 2.8, less than half of Cano’s WAR this year. The highest WAR was Bartlett’s 5.3 in 2009⁵, but overall the results were much lower.

So it would appear that Cano’s done something relatively new this season–play at a very high level while having a substandard DPR–but this still doesn’t answer the main question. I’ll answer that next, and the results are intriguing:

5. How have other players with DPRs this bad done for the rest of their careers?

Let’s continue to look at these 11 seasons. How were these players before and after their -3 DPR season?

Player WAR-Pre WAR-Post Off-Pre Off-Post Def-Pre Def-Post
Neil Walker 1.5 2.7 7.4 6.7 -6.8 -0.1
Jason Bartlett 3.5 0.8 4.4 -16.7 10.5 5.4
Yuniesky Betancourt 0.4 -1.4 -15 -23.8 -1.4 -7.7
Jason Bartlett 4.1 1 6.2 -11 14.1 0.9
Placido Polanco 3.3 2.2 1.8 -10.3 11.3 11.9
Yunel Escobar 3.6 3.1 10.2 -0.5 6.4 10.9
Brian Roberts 3.1 2.4 5.4 3.9 5.5 0.1
Luis Castillo 2.5 1.7 1 -0.8 4.6 -1.8
Omar Vizquel 2.4 1 -8.8 -24.5 12.8 14.6
Jimmy Rollins 1.4 3.4 -5.3 4.5 0.1 10.2
Jose Vidro 2.3 1.2 10.3 1.2 -5.2 -9.8
Average 2.6 1.7 1.6 -6.5 4.7 3.2

(All values are per 600 PAs. Year of DPR is included in Pre.)

They all saw a noticeable drop off in their WAR; the only ones whose WAR increased were Rollins and Walker, and they had their bad seasons when they were young. Given that Cano will turn 31 in October, it’s safe to say this will not happen to him. Since Cano is getting older, a decrease in WAR to some degree should be expected, especially considering the volatility of his position; this has been covered before, though.

What I found interesting, though, was that the players’ defense (as measured by that fancy new Def stat) didn’t really drop off much after the bad DPR year, but their offense seemingly fell off a cliff. This goes against the theory of player aging curves (that offense can get better as players get older, but defense tends to just decline overall).

Obviously, this is a very small sample size, and to extrapolate anything meaningful from it would be foolish. Also, it’s pretty unlikely that the decline was caused by one bad year turning double plays.

This post as a whole was probably rather cockamamie⁶, but then again, everything I post here tends to be. I just hope I was able to raise some interesting questions about how much turning two matters to a player’s overall worth. Perhaps, years from now, when the Yankees are paying Cano $30 million a year to hit .250 with poor defense, and the Orioles have won the division year in and year out, I’ll be able to look back with pride at my prescience.

Or maybe, the Yankees will just win more World Series with or without Cano, while the Orioles dwell in mediocrity every year.

A man can dream, though….

——————————————————————————————————————

¹For some reason which escapes me, there isn’t an option to sort the leaderboards by solely infielders, even though there’s an outfielder option.

²Hopefully, you would’ve figured that out on your own, but I put it in there just to be safe. Also: All stats are as of Saturday, September 21st, 2013.

³Otherwise, you’ll end up with pieces-of-shit “analysis” like this.

⁴Bartlett also had a DPR of -3.8 in 2006, but he didn’t qualify that season.

⁵That was his ridiculous fluke season–you know, the one that Joe Maddon just gets out of every scrub the Rays find on the street.

⁶You have no idea how long I’ve waited to use that word.


Victor Martinez: The Best Fielding First Baseman in the Majors (No, Really)

Note: I have no idea if I’m the first to do this, but quite frankly I don’t care.

It’s been one crazy season for Victor Martinez. In the first half, he was one of the worst players in baseball, with an 88 wRC+ and -0.6 WAR in 392 plate appearances; however, this was largely due to a .269 BABIP, and when his BABIP increased (to .372), his wRC+ and WAR (140 and 1.1, respectively, in 223 plate appearances) increased with it. This, though, is not the focus of my writing today. I chose, instead, to focus on one of the oddest statistics of the 2013 season, and one that truly proves that this blog is aptly named.

V-Mart has never been regarded as a good fielding catcher, and the stats confirm this–since he entered the league in 2002, he’s third-last among catchers in DRS and fifth-last in stolen base runs saved. He is, however, a (comparatively) much better fielding first baseman, with a career UZR/150 of 2.3¹ that would rank 12th out of 19 first baseman this year if he qualified. Throughout this season, Martinez has been mainly a DH², with 128 games started there, and 17 started in the field; of those 17, 11 have been at the 3-spot. He has played 97 innings at first base, which comes out to a little less than 9 innings per start there. So, obviously, we’re dealing with a very small sample size here; and yet, the larger point remains:

Victor Martinez has the highest UZR/150 among first baseman with at least 90 innings.

Surprised? Well, you probably shouldn’t be, as you read the title of this article before perusing the text that lies beneath it, so you probably should’ve seen this coming. In a larger sense, though, you probably are surprised, as this isn’t exactly Albert Pujols we’re talking about here. As I outlined above, Martinez isn’t a particularly bad fielding first baseman⁴, and this is obviously a ridiculously minuscule sample size⁵, but he’s certainly not this good. What, then, has changed? 

First, let’s look at his non-UZR advanced fielding stats. He has had 19 balls hit to his defensive zone (officially, Balls In Zone, or BIZ), and has made a play on 13 of them (just Plays–I guess they ran out of anagrams), for a Revised Zone Rating (RZR) of .684. That figure, if he had enough innings to qualify, would be the worst in the majors by a long shot–the lowest right now is Lyle Overbay, with a .766 RZR–and is also the worst figure of his career.

One thing he is doing, however, is making a lot of Out-Of-Zone plays, or OOZ. Although it isn’t included in UZR, OOZ is still an interesting statistic: it measures the amount of plays a fielder has successfully made when out of his defensive “zone”. Martinez has five OOZs in 97 innings this year; if he were to have played, say, ten times that amount, or 970 innings (about 110 games), he would have 50 OOZs, far more than the current leader, Anthony Rizzo, who has 41. In this regard, though, Martinez’s performance isn’t that different from his career as a whole, as he has 49 career OOZs in 1299.1 career innings (in 163 games) at first.

It’s when we look at the stats that go into UZR that we start to see some key differences. In case you need a refresher (or are simply unedumacated), UZR is composed of four parts: Double Play runs (DPR), Outfield Arm runs (ARM), Range runs (RngR) and Error runs (ErrR). Martinez doesn’t have any DPRs, as he hasn’t initiated any double plays, and because he has yet to play in the outfield⁶, he has no ARMs (his career values for these two are 0 and -0.2, respectively).

It then comes down to the other two components: RngR and ErrR. For his career, he has values of 1.9 and 0.4, respectively, for these stats; in 2013, however, he has values of 1.2 and 0.3, respectively. Again, if we spread these out over ten times his current playing time at first (to get 970 innings, or ~110 games), we get a 12 RngR and a 3 ErrR. While the latter figure is rather formidable–it would lead the league this year–it is the former that truly sets him apart. An⁷ RngR of 12 as a first baseman would be the fifth-highest ever; yes, UZR only goes back to 2002, but that’s still saying something. The only better seasons would be Pujols in 2007 (21.0)(!), Adrian Gonzalez last year (14.6), Travis Lee in 2003 (13.4), and Justin Morneau in 2005 (12.2).

Obviously, this whole exercise should be taken with a grain of salt. 97 innings of defense is an incredibly small sample size, and Martinez’s track record suggests this is almost definitely a fluke. What, then, does this mean? Fluke or not, the Tigers continue to start the ironically-named Prince Fielder and his -4.9 UZR (-4.8 UZR/150) at first base; this point was brought up earlier this year. Despite the welldocumented historical awesomeness of their rotation (to say nothing of that guy over at the hot corner), the Tigers would only get the 3rd seed if the season was to end today, and their defense at first base is a big reason why. While his health concerns would make a full-time move to first unfeasible, playing him there a little more often (at least more than 11 times) certainly couldn’t hurt.

Overall, though, what do I take away from this? Well, as I said earlier

—————————————————————————————————————————

¹It should also be noted that his career UZR (not adjusted for playing time) is 2.1, as he has played roughly a full season’s worth of games (163, to be exact) at first base over the course of his career.

²Though you wouldn’t know it from looking at his FanGraphs page (which identifies him as a catcher, despite him having caught all of 15 innings this year).

³Really, SpellCheck? “Should’ve” isn’t a word? You know, I don’t recall aksing for your opinion, SpellCheck.

⁴Although to be fair, he did do this.

⁵Especially since this is a defensive stat, for which a sample size of three years is recommended for the best analysis.

⁶Don’t tell Leyland I said that–he might take it as advice.

⁷A or An? I suppose it depends on if you say the anagram or the full name.


The Supposedly Decreasing Importance of Strikeouts

Note: I have no idea if I’m the first to do this, but quite frankly I don’t care.

Let me start by apologizing for the Papelbon thing. It was a pretty stupid article, and I was basically just looking for something to write about. While I’m at it, I should probably apologize for the bFI thing–I thought that would come out better than it did–and the last part of the Pettitte thing–when a guy’s gone 28-6 against you, you tend to harbor some animosity towards him. With all that said, I feel like this is a pretty good one, even if it is rather brief. So, without further ado…

By now we’re all sick of hearing it. Strikeouts don’t matter anymore for hitters! They’ve lost their stigma¹! These crazy kids today don’t know about plate discipline! For the most part, these criticisms all seem to be saying the same general thing: Strikeouts (or the lack thereof) are no longer correlated to offensive success.

Well, I can’t speak for you, but I have really grown sick of these baseless assertions. Other writers have touched on the fact that there is virtually no correlation between strikeouts and offensive performance², but these are all within the past several years. What I wanted to prove was that there has never been a correlation between the two.

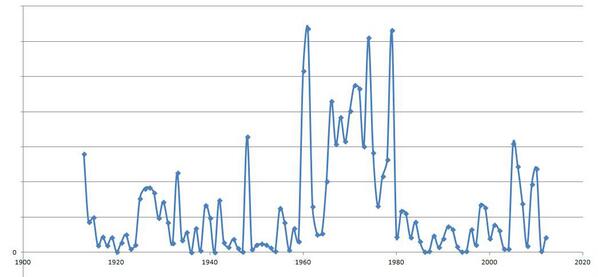
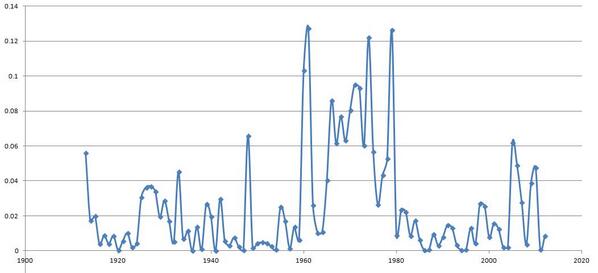
The methodology was pretty simple: Since wRC+ is the tell-all offensive statistic, I simply found the correlation, measured by R-squared³, between K% and wRC+ for every season from 2012 going back to 1913 (the first year that strikeouts were recorded for batters). I then graphed the resulting R-squared⁴ values by year for every year, of which there were 100.

And what, you ask, were the results?

Graph

“Well, golly, them folks was right!”, the reader might be inclined to say. Indeed, it would seem that–although the R-squared values have fluctuated heavily over the years–they are, overall, at a lower level than they once were. This would mean, of course, that strikeouts did matter more in the days of yore.

But wait! All hope is not lost! For you see, I purposefully excluded one key aspect of the graph in question: the labeling on the y-axis (i.e. the one upon which the R-squared values were measured, i.e. the vertical one). Put that back on, and what do we discover?

Graph2

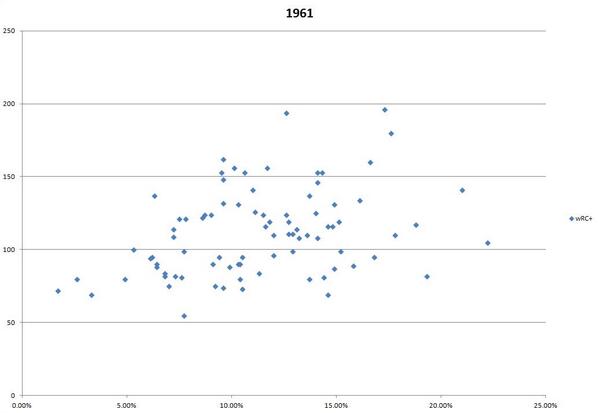
For the entirety of baseball’s history, there have only been FOUR YEARS with an R-squared above .1. Remember, R-squared is on a 0 to 1 scale, and the higher the number, the greater the degree of correlation; an R-squared of .1 is basically what you get if you draw random points on a graph. Or, to put that another way:

Graph3

That’s a scatter plot of the strikeout rates and wRC+s of players from the 1961 season (i.e. the one with the “highest” correlation). Does that LOOK like a correlation to you? Hopefully, you answered no (because of the way the internet works, I can’t know what your answer was, or even if you answered); any monkey⁵ with even a basic grasp of statistics could see that those two variables aren’t connected in any way.

What, then, does this mean?

Not only are strikeouts not correlated to offensive success now, they never have been, and probably never will be. Now, can we please stop saying they are⁶?

—————————————————————————————————————————————

¹I tried looking up specific quotes, but searching “strikeout stigma” just returned some ADHD thing.

²And, of course, scatter plots reflecting such will generally be more elliptical than straight.

³In case you’re unedumacated, R-squared measures the degree of correlation between two variables. It returns a value between 0 and 1; the higher the value, the greater the correlation, and vice versa.

⁴I’m forced to say “R-squared” to avoid confusion between that and the footnotes.

⁵Really, a monkey would probably be the one drawing the scatter plot.

⁶Or were. You know what I mean.


Is Jonathan Papelbon a Hall of Famer?

Note: I have no idea if I’m the first to do this, but quite frankly I don’t care.

Wait, don’t go! I swear I’m not crazy! Seriously, though, Jonathan Papelbon is an interesting case, one which has fascinated me ever since his last pitch with the Red Sox¹, and since the Jewish community² has been so gracious as to allot me this day off from school, I don’t really have anything better to do; hence, this.

While there has been a lot of criticism directed at Papelbon recently, the fact that everyone seems to overlook is that he is still a pretty good pitcher. It’s true that his strikeout rate has decreased dramatically (“only” 23.3% compared to 29.2% for his career); however, he has compensated for this by reducing his walk rate (4.2% compared to 6.4% for his career) and having a lower HR/FB% (6.1%, compared to 7.1% for his career). Consequently, while his xFIP and SIERA are both higher than his career numbers (3.43 and 2.93 compared to 3.09 and 2.50, respectively), his ERA and FIP (2.35 and 2.70, respectively) are right around his career numbers of 2.34 and 2.65; these numbers rank him him 33rd and 27th, respectively, out of 140 qualified relievers. Combine that with pitching in one of the more offense-friendly parks in baseball, and his WAR is 25th-best out of all relievers.

Now, the obvious counterpoint is that Jonathan Papelbon is not being paid the highest salary of any relief pitcher in all of baseball to be the 25th best. Obviously, this is true, and this post could very easily devolve into the usual “it’s not his fault Amaro’s a dipshit” argument; however, that’s not what I want to write about today. No, I choose to follow a higher calling: to determine whether or not Mr. Papelbon shall be enshrined forevermore in Cooperstown.

To do this, I decided to get a historical perspective, keeping in mind that the Hall of Fame voters are not sabermetrically-inclined, though they are still rational people³. Looking at the FanGraphs all-time ERA leaderboard, we see that Papelbon’s career ERA is the third-best all-time of pitchers with at least 500 relief IP, behind only Mariano Rivera and Billy Wagner⁴. Looking at the Baseball-Reference all-time saves leaderboard⁵, we can see that Papelbon is 29th all-time in saves; establishing an arbitrary cutoff, we can see that 5 of the top 37 players in saves are in the Hall, and Rivera and Trevor Hoffman will obviously make that seven.

So, roughly 20% of the “elite” relief pitchers of all time are in Cooperstown. If Papelbon were to retire today, his chances would probably be slim, so the question becomes: how good can he be expected to be over the twilight of his career?

Papelbon is 32, and currently in the second year of a four-year contract. Since his birthday is conveniently located in the offseason⁶, we can identify the next two years as his age-33 and -34 seasons. Most reasonable people would say that the Phillies are several years away from being contenders, so a realistic assumption would be, say, 40 save opportunities over each season. This season, he’s converted 80% of his save opportunities (roughly league average); optimistically speaking, let’s say that rate holds up over the next two years. With Charlie Manuel now gone–and, hopefully, his attitude towards closers taken with him–Papelbon will also probably work some in tie games or games where the opponent has the lead. Let’s assume, again optimistically speaking, he pitches 70 innings each season, and continues to outperform his declining peripherals, allowing 20 earned runs in each season.

Now, the deal that he signed also had an option for a fifth year. Just a random speculation, but let’s say Ruben Amaro–being the genius that he is–decides to pay $10 million for a 35-year-old closer. At this point, there’s probably going to be a dropoff in Papelbon’s production; let’s say he converts 28 out of 40 save opportunities, and allows 24 earned runs in 60 innings.

What does all of this add up to?

IP ER ERA SV SVOPP
Papelbon now 553 144 2.34 281 320
Papelbon later 753 208 2.49 373 440

That ERA would rank Papelbon as the 4th-best all-time among pitchers with at least 500 relief innings, and that save total would rank him 7th-best of all-time; in addition, this is assuming that he doesn’t pitch at all after the contract expires.

Another interesting angle: which active pitchers have similar cases to Papelbon? Aside from the Sandman, there are three active players ahead of Papelbon on the saves list; since one of them has probably ended his career (by pitching in a hot dog jersey, no less), that leaves but two: Joe Nathan and Francisco Rodriguez⁷.

All three of them have sub-3.00 career ERA’s and have never (as far as I know) been connected to PEDs; Nathan and K-Rod each have more than 300 saves (a feat only 25 pitchers have accomplished). Rodriguez has accepted a non-closer role with the Orioles, and he may never close again. Even if his exceptional start with the O’s (1.82 xFIP! 1.60 SIERA!) is no mirage, it’s hard to envision him being enshrined; plus, y’know, there’s the whole “assaulted his girlfriend’s dad” thing, though it’s not like the voters ever exclude people on moral grounds. Nathan, on the other hand, has never had any off-the-field problems; the biggest crutch holding him back may be his age. He debuted at 24–the same age as Papelbon when he debuted–but took a while to figure things out⁸, and only started pitching really well from age 29 on, when he was traded to the Twins in one of the more infamous trades of the decade. While his career relief ERA is quite good (2.35, the same as Papelbon) his overall ERA is a not-quite-as-spectacular 2.78, and he’s shown some signs of wear at age 38, with a 3.29 BB/9 rate that’s his highest since 2003.

Overall, I–the baseball expert–would say that Papelbon has the greatest chance of the three of heading to Cooperstown. Papelbon has some other notable achievements–the first pitcher ever with 25 saves in each of his first five full seasons, the fastest pitcher ever to reach 200 saves–which may help his case. Overall, this was a pretty good usage of a Jewish holiday. If you read this article in its entirety, I probably just wasted a lot of your time, although it’s not like you definitely didn’t come here for that.

—————————————————————————————————————————————————-

¹A pitch, I should add, that I will remember (and constantly remind Red Sox fans that I remember) until the day that I die.

²I tried to look up the It’s Always Sunny In Philadelphia clip where they talked about what to refer to Jewish people as, but I couldn’t find it. Does anyone know where that might be found? It’s from “The Gang Goes Jihad”, if that helps.

³Yes, I get that the tweet was sarcastic. The fact that he felt the need to joke about it proves that people with those archaic beliefs still exist.

⁴Wagner’s got an interesting Hall of Fame case as well–it’s outlined here.

⁵I used this instead of FanGraphs’ leaderboard because Baseball-Reference includes the “+” next to the player’s name if they’re a HOFer.

⁶I think a rule should be established saying only players with offseason birthdays can play baseball. That way, there won’t be any confusion with these midseason birthday guys–when people say “he’s in his age-__ season”, do they mean that was his age when he started the season, or that’s his age now?

⁷This could’ve been written about those two, but I chose to focus on Papelbon because cases for Nathan and for Rodriguez have already been outlined, and–as far as I could tell–none such actions had been taken for Papelbon.

⁸People really forget just how bad Nathan was in those early years. In 1999 and 2000, he pitched 183.2 innings, with a 4.70 ERA and a 5.70 FIP, due largely to a 5.34 BB/9 rate; to top it all off, he did it pitching in SAN FRANCISCO.


The Basic Fortune Index (Or bFI, If You Are So Inclined)¹

Note: I have no idea if I’m the first to do this, but quite frankly I don’t care.

Last Friday against the Rockies, Matt Wieters had a plate appearance that perfectly epitomized his 2013 season. Coming to the plate in the bottom of the 3rd, with the Orioles up 2-0, two outs in the inning, and the bases loaded, Wieters worked Juan Nicasio for an eight-pitch full count; on the ninth pitch of the at-bat, Wieters hit a perfect, textbook line drive…right to DJ LeMahieu at second, for the third out of the inning.

While watching this game with my father, I was forced to restrain him from destroying the flatscreen upon which this atrocity had been viewed. My level of outrage was not nearly at that of my progenitor’s, however, for I–being more statistically inclined than him–knew that Wieters had been rather unlucky on batted balls this season; after another lineout in Saturday’s game, and two more on Tuesday against the Diamondbacks², Wieters now has a .596 BABIP on line drives, “good” for 170th out of 183 qualified players. At this late in the season, a player’s numbers start to level off to what they’ll be at season’s end, and despite the reassurances of experts, Wieters has not ceased to be unlucky.

Which got me thinking…

Would there be a way to measure how lucky or unlucky a player has been as a whole? Not just for one individual stat, but for an entire stat line, over the course of a whole season? After exhaustive Google searches returned nothing, I decided to take matters into my own hands. Using my rudimentary statistical knowledge, and the findings of Mike Podhorzer–who created equations for xK% and xBB%–and Jeff Zimmerman–who devised an xBABIP equation–I created a basic equation to determine how lucky a player has been 0verall³. Because I have absolutely no idea how linear weights and all that shit works, I kept it simple:

bFI = 100*((xK%–K%) + (BB%–xBB%) + (BABIP–xBABIP))

I call it the Basic Fortune Index; I would’ve called it the Luck Index, but I didn’t want to confuse it with Leverage Index. Basically, I took the difference between each player’s xK% and K%, BB% and xBB%, and BABIP and xBABIP, added them together, and then multiplied it by 100 for shits and giggles. Since a lucky hitter would have a lower K% than expected (as opposed to a higher BB% and BABIP than expected), I took the difference from xK% to K%, instead of the other way around. A positive bFI would indicate a lucky player, and a  negative value would indicate an unlucky player. Also, due to time constraints, I was only able to compile stats for the AL.

On to the leaderboards⁴!

Player K% xK% kdiff BB% xBB% bbdiff BABIP xBABIP bdiff bFI
Joe Mauer 0.175 0.218 0.043 0.12 0.119 0.001 0.383 0.343 0.04 8.4
Miguel Cabrera 0.144 0.147 0.003 0.138 0.097 0.041 0.363 0.335 0.027 7.1
Billy Butler 0.145 0.18 0.035 0.129 0.116 0.013 0.323 0.304 0.019 6.7
David Ortiz 0.138 0.156 0.018 0.123 0.109 0.014 0.333 0.301 0.032 6.4
Josh Donaldson 0.168 0.2 0.032 0.109 0.109 0 0.33 0.319 0.012 4.4
Mike Trout 0.17 0.194 0.024 0.138 0.13 0.008 0.376 0.366 0.01 4.2
Jhonny Peralta 0.225 0.221 0.004 0.08 0.087 -0.007 0.379 0.339 0.04 3.7
Mike Napoli 0.337 0.336 0.001 0.109 0.119 -0.01 0.36 0.314 0.046 3.7
Evan Longoria 0.238 0.235 -0.003 0.108 0.111 -0.003 0.318 0.279 0.04 3.4
Torii Hunter 0.164 0.166 0.002 0.042 0.042 0 0.343 0.316 0.027 2.9
Dustin Pedroia 0.113 0.165 0.052 0.108 0.102 0.006 0.317 0.347 -0.03 2.8
Adrian Beltre 0.097 0.113 0.016 0.07 0.069 0.001 0.324 0.317 0.007 2.4
Carlos Santana 0.178 0.218 0.04 0.135 0.133 0.002 0.299 0.317 -0.018 2.4
Jose Bautista 0.16 0.2 0.04 0.129 0.131 -0.002 0.259 0.274 -0.015 2.3
Jacoby Ellsbury 0.145 0.149 0.004 0.077 0.088 -0.011 0.34 0.311 0.029 2.2
Jason Kipnis 0.215 0.23 0.015 0.115 0.13 -0.015 0.35 0.329 0.021 2.1
Victor Martinez 0.107 0.148 0.041 0.08 0.092 -0.012 0.298 0.306 -0.008 2.1
Daniel Nava 0.178 0.195 0.017 0.1 0.111 -0.011 0.342 0.327 0.015 2.1
Kendrys Morales 0.17 0.176 0.006 0.067 0.077 -0.01 0.325 0.3 0.025 2.1
Adam Lind 0.202 0.216 0.014 0.1 0.099 0.001 0.319 0.314 0.004 1.9
Desmond Jennings 0.202 0.218 0.016 0.091 0.099 -0.008 0.306 0.299 0.007 1.5
Chris Davis 0.292 0.277 -0.015 0.103 0.103 0 0.354 0.327 0.027 1.2
Lorenzo Cain 0.197 0.216 0.019 0.08 0.079 0.001 0.317 0.326 -0.008 1.2
Colby Rasmus 0.301 0.271 -0.03 0.08 0.099 -0.019 0.363 0.306 0.057 0.8
Prince Fielder 0.175 0.19 0.015 0.11 0.103 0.007 0.288 0.303 -0.015 0.7
Ben Zobrist 0.143 0.136 -0.007 0.103 0.094 0.009 0.302 0.298 0.003 0.5
Kyle Seager 0.165 0.19 0.025 0.088 0.104 -0.016 0.309 0.313 -0.004 0.5
Mitch Moreland 0.206 0.234 0.028 0.08 0.091 -0.011 0.265 0.279 -0.014 0.3
Robinson Cano 0.13 0.133 0.003 0.115 0.095 0.02 0.311 0.333 -0.022 0.1
Nick Markakis 0.099 0.124 0.025 0.079 0.075 -0.004 0.295 0.318 -0.022 -0.1
Alejandro De Aza 0.217 0.224 0.007 0.073 0.094 -0.021 0.33 0.317 0.013 -0.1
Jason Castro 0.261 0.258 0.003 0.098 0.103 -0.005 0.345 0.343 0.001 -0.1
Eric Hosmer 0.138 0.153 0.015 0.068 0.071 -0.003 0.32 0.333 -0.013 -0.1
Nelson Cruz 0.239 0.234 -0.005 0.077 0.089 -0.012 0.299 0.284 0.014 -0.3
Alex Gordon 0.207 0.217 0.01 0.08 0.098 -0.018 0.311 0.306 0.005 -0.3
Justin Morneau 0.179 0.193 0.014 0.066 0.07 -0.004 0.294 0.308 -0.013 -0.3
Brandon Moss 0.275 0.267 -0.008 0.09 0.087 0.003 0.29 0.289 0.001 -0.4
Adam Jones 0.185 0.177 -0.008 0.03 0.029 0.001 0.33 0.328 0.002 -0.5
Albert Pujols 0.124 0.159 0.035 0.09 0.089 0.001 0.258 0.288 -0.031 -0.5
Shane Victorino 0.114 0.141 0.027 0.052 0.068 -0.016 0.309 0.327 -0.018 -0.7
Chris Carter 0.368 0.355 -0.013 0.118 0.112 0.006 0.296 0.296 0 -0.7
Manny Machado 0.156 0.136 -0.02 0.039 0.056 -0.017 0.338 0.31 0.028 -0.9
James Loney 0.128 0.13 0.002 0.074 0.066 0.008 0.337 0.357 -0.019 -0.9
Ian Kinsler 0.093 0.132 0.039 0.088 0.109 -0.021 0.271 0.301 -0.03 -1.2
Mark Reynolds 0.317 0.32 0.003 0.11 0.107 0.003 0.288 0.306 -0.018 -1.2
Vernon Wells 0.163 0.148 -0.015 0.062 0.047 0.015 0.266 0.28 -0.013 -1.3
Howie Kendrick 0.171 0.171 0 0.051 0.051 0 0.344 0.357 -0.013 -1.3
Edwin Encarnacion 0.098 0.142 0.044 0.122 0.117 0.005 0.255 0.317 -0.063 -1.4
Erick Aybar 0.088 0.103 0.015 0.043 0.44 -0.001 0.299 0.328 -0.029 -1.5
Brett Gardner 0.201 0.202 0.001 0.083 0.097 -0.014 0.333 0.336 -0.002 -1.5
Nick Swisher 0.218 0.23 0.012 0.121 0.118 0.003 0.292 0.322 -0.03 -1.5
Michael Bourn 0.228 0.216 -0.012 0.063 0.073 -0.01 0.344 0.338 0.006 -1.6
Mark Trumbo 0.26 0.254 -0.006 0.083 0.07 0.013 0.274 0.298 -0.024 -1.7
Austin Jackson 0.21 0.208 -0.002 0.095 0.083 0.012 0.32 0.35 -0.03 -2
Salvador Perez 0.12 0.093 -0.027 0.042 0.038 -0.004 0.299 0.29 0.01 -2.1
Alexei Ramirez 0.1 0.071 -0.029 0.03 0.008 0.022 0.314 0.328 -0.014 -2.1
Jed Lowrie 0.136 0.106 -0.03 0.083 0.081 0.002 0.315 0.308 0.007 -2.1
Nate McLouth 0.14 0.147 0.007 0.088 0.084 0.004 0.305 0.338 -0.033 -2.2
Coco Crisp 0.114 0.148 0.034 0.109 0.11 -0.001 0.256 0.312 -0.056 -2.3
Alex Rios 0.167 0.151 -0.016 0.066 0.07 -0.004 0.315 0.318 -0.003 -2.3
Ryan Doumit 0.168 0.19 0.022 0.084 0.094 -0.01 0.272 0.308 -0.036 -2.4
Yunel Escobar 0.124 0.125 0.001 0.086 0.092 -0.006 0.286 0.308 -0.022 -2.7
Drew Stubbs 0.29 0.257 -0.033 0.072 0.068 0.004 0.333 0.333 0 -2.9
Yoenis Cespedes 0.233 0.23 -0.003 0.076 0.079 -0.003 0.256 0.283 -0.027 -3.3
Mike Moustakas 0.137 0.14 0.003 0.066 0.086 -0.02 0.251 0.268 -0.018 -3.5
Jose Altuve 0.133 0.107 -0.026 0.055 0.041 0.014 0.311 0.335 -0.024 -3.6
Brian Dozier 0.188 0.212 0.024 0.081 0.094 -0.013 0.278 0.327 -0.049 -3.8
Lyle Overbay 0.222 0.207 -0.015 0.068 0.076 -0.008 0.303 0.318 -0.015 -3.8
Adam Dunn 0.285 0.286 0.001 0.132 0.145 -0.013 0.283 0.31 -0.027 -3.9
Matt Wieters 0.172 0.175 0.003 0.081 0.088 -0.007 0.244 0.28 -0.036 -4
Michael Brantley 0.108 0.094 -0.014 0.073 0.076 -0.003 0.3 0.323 -0.023 -4
Elvis Andrus 0.143 0.155 0.012 0.081 0.098 -0.017 0.301 0.343 -0.041 -4.6
Paul Konerko 0.146 0.158 0.012 0.078 0.071 0.007 0.26 0.326 -0.066 -4.7
J.J. Hardy 0.118 0.124 0.006 0.057 0.07 -0.013 0.253 0.296 -0.043 -5
Matt Dominguez 0.164 0.162 -0.002 0.038 0.056 -0.018 0.248 0.283 -0.035 -5.5
Josh Hamilton 0.246 0.24 -0.004 0.067 0.067 0 0.264 0.317 -0.052 -5.6
Alcides Escobar 0.126 0.118 -0.008 0.032 0.025 0.007 0.271 0.325 -0.055 -5.6
Alberto Callaspo 0.106 0.159 0.053 0.072 0.119 -0.047 0.256 0.319 -0.064 -5.8
Asdrubal Cabrera 0.22 0.211 -0.009 0.06 0.075 -0.015 0.288 0.323 -0.035 -5.9
Ichiro Suzuki 0.097 0.108 0.011 0.045 0.047 -0.002 0.292 0.364 -0.072 -6.3
Maicer Izturis 0.094 0.097 0.003 0.069 0.066 0.003 0.248 0.326 -0.078 -7.2
Raul Ibanez 0.256 0.249 -0.007 0.069 0.084 -0.015 0.278 0.33 -0.052 -7.4
David Murphy 0.117 0.128 -0.011 0.076 0.083 -0.007 0.228 0.288 -0.061 -7.9
Jeff Keppinger 0.088 0.07 -0.018 0.039 0.049 -0.01 0.263 0.33 -0.067 -9.5
J.P. Arencibia 0.295 0.255 -0.04 0.04 0.06 -0.02 0.253 0.324 -0.071 -13.1

Wieters ended up 70th out of the 85 players, as his xBABIP wasn’t as high as I thought it would’ve been.

After compiling this table, I noticed a trend (one that has been noticed by others before me): the “lucky” players were mainly good players, whereas the “unlucky” players were mainly bad offensive players. I then matched each player’s wRC+ up with their bFI, and made a table of the result⁵:

Player bFI wRC+ Player bFI wRC+ Player bFI wRC+
Joe Mauer 8.4 143 Nick Markakis -0.1 91 Coco Crisp -2.3 96
Miguel Cabrera 7.1 207 Alejandro De Aza -0.1 104 Alex Rios -2.3 99
Billy Butler 6.7 124 Jason Castro -0.1 120 Ryan Doumit -2.4 91
David Ortiz 6.4 160 Eric Hosmer -0.1 114 Yunel Escobar -2.7 101
Josh Donaldson 4.4 139 Nelson Cruz -0.3 123 Drew Stubbs -2.9 87
Mike Trout 4.2 179 Alex Gordon -0.3 99 Yoenis Cespedes -3.3 98
Jhonny Peralta 3.7 125 Justin Morneau -0.3 101 Mike Moustakas -3.5 80
Mike Napoli 3.7 109 Brandon Moss -0.4 115 Jose Altuve -3.6 83
Evan Longoria 3.4 138 Adam Jones -0.5 125 Brian Dozier -3.8 100
Torii Hunter 2.9 118 Albert Pujols -0.5 111 Lyle Overbay -3.8 98
Dustin Pedroia 2.8 110 Shane Victorino -0.7 102 Adam Dunn -3.9 121
Adrian Beltre 2.4 142 Chris Carter -0.7 108 Matt Wieters -4 91
Carlos Santana 2.4 127 Manny Machado -0.9 110 Michael Brantley -4 106
Jose Bautista 2.3 133 James Loney -0.9 124 Elvis Andrus -4.6 69
Jacoby Ellsbury 2.2 110 Ian Kinsler -1.2 101 Paul Konerko -4.7 77
Jason Kipnis 2.1 137 Mark Reynolds -1.2 96 J.J. Hardy -5 99
Victor Martinez 2.1 101 Vernon Wells -1.3 79 Matt Dominguez -5.5 80
Daniel Nava 2.1 123 Howie Kendrick -1.3 116 Josh Hamilton -5.6 93
Kendrys Morales 2.1 124 Edwin Encarnacion -1.4 145 Alcides Escobar -5.6 54
Adam Lind 1.9 124 Erick Aybar -1.5 94 Alberto Callaspo -5.8 94
Desmond Jennings 1.5 110 Brett Gardner -1.5 104 Asdrubal Cabrera -5.9 91
Chris Davis 1.2 183 Nick Swisher -1.5 111 Ichiro Suzuki -6.3 78
Lorenzo Cain 1.2 88 Michael Bourn -1.6 90 Maicer Izturis -7.2 63
Colby Rasmus 0.8 122 Mark Trumbo -1.7 114 Raul Ibanez -7.4 122
Prince Fielder 0.7 115 Austin Jackson -2 103 David Murphy -7.9 75
Ben Zobrist 0.5 113 Salvador Perez -2.1 85 Jeff Keppinger -9.5 51
Kyle Seager 0.5 128 Alexei Ramirez -2.1 84 J.P. Arencibia -13.1 70
Mitch Moreland 0.3 99 Jed Lowrie -2.1 112
Robinson Cano 0.1 136 Nate McLouth -2.2 105

Apparently, the correlation was not as strong as  I had initially hoped (thanks, Dunn and Ibanez!), as the .53746 R Squared implies.

In the end, it’s probably not a very good statistic–more of a Pseudometric–which, to be fair, is why I named it the Basic Fortune Index. Like most everything I post here, there really wasn’t a point to this whole thing. In addition, it’s fairly likely that, if this is actually published, someone will be so kind as to inform me that there is already a better stat out there for determining the luck of a hitter, and that–despite the disclaimer–I should care about this. If, however, this is an original idea, I invite those more statistically knowledgeable than myself to expound upon it (assuming, of course, I receive all the credit).

———————————————————————————————————————————-

¹How should that be capitalized?

²I refuse to use their nickname, and usage of it by anyone else should be considered cause for legal euthanasia.

³I wanted to use HR/FB%, but since Parts 6 and 7 of this series were never released, I was forced to go without.

⁴All stats are as of Tuesday, August 20th.

⁵I tried to put in the graph, but couldn’t figure out how.


Pettitte vs. Buehrle

Note: I have no idea if I’m the first to do this, but quite frankly I don’t care.

I feel as though this will be the article where my disclaimer is put to full use, as this seems to be a comparison that is an easy one to make, but no one (at least from what I can tell) is making it. Andy Pettitte and Mark Buehrle have very similar career ERA’s (3.88 and 3.85, respectively); they were both late-round draft picks, as I covered earlier, and…well, that’s basically where the similarities end.

Buehrle is obviously famous for his durability, having never gone on the DL, and while Pettitte has had some durability issues recently, he’s been pretty durable for his career, with 10 seasons of 200 innings in his first 14 years in the majors. Obviously, Pettitte has considerably more innings pitched (3255.1 to 2829.1), as he’s existed for five more years.

One key difference between the two is peripherals. Pettitte’s career K% is a solid¹ 17.4%, whereas Buehrle’s is, well, a less solid 13.8%. While Buehrle also has better career control than Pettitte (5.5% to 7.3% BB%), Pettitte is a little more groundball inclined (48.6% to 45.4% GB%).

Put it all together, and Pettitte has a career xFIP² of 3.70, whereas Buehrle’s sits at 4.21, a 51-point difference that would suggest that these two men are not very similar. Their respective WAR values (4.1 WAR/200 IP for Pettitte, 3.3 for Buehrle) also works to support this conclusion. However, this is FanGraphs WAR, based off of FIP; looking at their Baseball-Reference WAR–i.e. runs-allowed WAR–it would appear that Buehrle is better than Pettitte (3.8 to 3.6)³.

While we’re on the subject, let’s see some other pitchers in that general vicinity of career rWAR/200 innings, that I may or may not have picked selectively to further my argument⁴.

Nolan Ryan–3.0

Ted Lyons–3.2

Gaylord Perry–3.4

Steve Carlton–3.5

Phil Niekro–3.6

John Clarkson–3.7

Bert Blyleven–3.8

Fergie Jenkins–3.8

Are several of these pitchers people from the days of yore whom you’ve never heard of? Yes. Are they all Hall of Famers? Also yes.

So why is Pettitte considered to to have a strong case for the Hall of Fame, while Buehrle is borderline at best? It all comes back to that key pitcher stat: wins. Because, as the article cites, Pettitte is part of an elite group: only 46 pitchers have 250 career wins, and 32 of them are in the Hall⁵. Buehrle, meanwhile, is toiling away with a meager 182 wins, only 157th all-time.

Obviously, wins are a completely meaningless statistic, and Pettitte having that many career wins is almost entirely circumstantial. The above article mentions that Pettitte played on playoff teams for 14 of his first 17 seasons, compared to only two for Buehrle’s first 13 seasons, and, of course, Pettitte has played most of his career with one of the best closers of all time, whereas Buehrle played much of his career with a guy who partakes in, uh, unusual fowl ingestion techniques.

There’s also the fact that Pettitte played most of his career in New York, the attention pimp⁶ of cities; while Chicago is one of the larger cities in the U.S., its media shrivels up and dies in comparison to the Big Apple’s. How much this contributed to Pettitte’s alleged divaism–and confirmed indecisiveness–will never be known; what we do know is that Buehrle is humble about himself and his achievements, probably more so than Pettitte.

In many ways, the situation with Pettitte and Buehrle mirrors that of NFL linebackers Ray Lewis and London Fletcher; both Lewis and Fletcher have very similar career stats, but the former is a surefire Hall of Famer, while the latter has more of an outside shot. Some have theorized that the reason for Lewis’s increased fame are twofold: first, that he came from a high-profile school (Miami) as a high-round draft pick (26th in the first round), as opposed to a low-profile school (John Carroll) as an undrafted free agent; obviously, since both Pettitte and Buehrle are both very low-round draft picks (22nd and 38th, respectively) from very low-profile schools (San Jacinto and Jefferson, respectively), this is obviously irrelevant.

And the second reason for Lewis being more popular than Fletcher? Well, this. In short, what Mr. Easterbrook’s theory states is that Lewis–and possibly, by connection, all similarly-inclined athletes–act the way they act in order to promote their own fame, and build up a case for the Hall of Fame. This could easily be applied to to Pettitte and Buehrle; the former is considerably more self-promoting, while the latter is much more willing to give his teammates credit.

So, while this may have been a largely pointless article, the main message remains clear–two pitchers are very similar in most respects, instead of their reputation, and that reputation may have a lasting effect on their immortality. Why are men judged by their reputations instead of their accomplishments? Now there’s a question worth answering.⁷

———————————————————————————————————————————-

¹Remember, this was mainly accrued during the steroid era, when that level was (roughly) average.

²Please note that xFIP only goes back to 2002, and Buehrle’s and Pettitte’s careers (and their career ERAs cited above) go back to 2000 and 1995, respectively.

³If aggregate WAR values are more your thing: Buehrle has nearly 20 fewer career wins than Pettitte by fWAR (47.3 to 67.0) but is less than five wins worse than him by rWAR (54.0 to 58.5).

Twain was right.

⁵Of the 14 that are not, 8 are still eligible or have not yet become eligible: Pettitte, Greg Maddux, Roger Clemens, Tom Glavine, Randy Johnson, Mike Mussina, Jamie Moyer, and Jack Morris.

⁶I.e. one that makes attention whores out of the famous.

⁷Believe me when I say I did not intend that to sound as deep as it did.


CarGo and the Value of Plate Discipline

Note: I have no idea if I’m the first to do this, but quite frankly I don’t care.

As you’ve probably grown sick of hearing¹, Brewers center fielder Carlos Gomez is undeterred by his team’s general shittiness and is having a terrific season–his 5.7 WAR² is a very close third in the NL, and one of the players he’s behind may be out for a while. While he’s always been an excellent defender (50.8 career UZR prior to this season), his bat has never been particularly good (his career-best wRC+ prior to this season was 105, last year).

A massive improvement on offense has been the driving force behind his MVP-type numbers, as his wRC+ of 133 this year sits at 16th in the NL; this can be attributed to an increase in power (.235 ISO, compared to .150 for his career) and an uptick in BABIP (.350, compared to .311 for his career). Many of the articles listed in the first footnote cite these as reasons behind his improvement. One element of his game that has not improved, however, and is getting startlingly little coverage from the media, is his plate discipline; his walk and strikeout rates sit at 6% and 25.1%, respectively, meaning his BB/K of 0.24 is 6th-worst in the NL.

Now, should Gomez end up leading the league³ in WAR with that kind of plate discipline, how revolutionary would that be? I decided to find out. I looked up every NL WAR leader going back to 1910 (when strikeouts for batters⁴ were first recorded) and recorded their strikeouts and walks, then calculated each batter’s K/BB⁵ and ranked them from lowest to highest; the top 10 are listed below.

Year NL K BB K/BB
2013 Carlos Gomez* 144 34 4.24
1988 Andy Van Slyke 126 57 2.21
2011 Matt Kemp 159 74 2.15
2012 Ryan Braun 128 63 2.03
1984 Ryne Sandberg 101 52 1.94
1971 Willie Stargell 154 83 1.86
2005 Andruw Jones 112 64 1.75
1970 Tony Perez 134 83 1.61
1978 Dave Parker 92 57 1.61
1941 Pete Reiser 71 46 1.54
*ZiPS Projection

The average K/BB was 0.85, meaning Gomez’s⁶ is nearly 400% worse.

Now, any fan of baseball–sabermetrically inclined or otherwise–knows that this year (and in recent years), plate discipline has been at an all-time low. Knowing this, I decided to measure each player differently. I gathered up all the league-average K/BB’s for every year going back to 1910, then divided each WAR leader’s K/BB by the league-average K/BB for the respective year, and created K/BB-, in the style of ERA-. I then ranked each batter’s K/BB- from highest to lowest (i.e. worst to best); the top 10 are listed below.

Year NL K/BB lgK/BB K/BB-
2013 Carlos Gomez* 4.24 2.51 169
1941 Pete Reiser 1.54 0.99 156
1988 Andy Van Slyke 2.21 1.8 123
1984 Ryne Sandberg 1.94 1.69 115
1937 Medwick 1.22 1.07 114
1971 Willie Stargell 1.86 1.67 111
1978 Dave Parker 1.61 1.48 109
1970 Tony Perez 1.61 1.63 99
1926 Hack Wilson 0.88 0.89 99
2011 Matt Kemp 2.15 2.3 93
*ZiPS Projection

The average K/BB- was 58, meaning Gomez’s was almost 200% worse.

The closest match to Gomez’s season (at least in terms of plate discipline) was Pete Reiser in 1941. That year, his K/BB was a very solid (by our standards) 1.54, but the league-average was below 1, meaning he was actually pretty bad by league-adjusted standards.⁷

Even when we adjust for the era, Gomez’s plate discipline is historically bad. People may argue about the value of plate discipline to a hitter, but you can’t dispute the facts: the average K/BB for a WAR leader is 42% better than league-average, and Gomez’s is 69% worse than league average, and yet he is contending for the WAR lead.

So, what does this mean? Obviously, as I mentioned in the introduction, a large part of Gomez’s value comes from his defense, and thus his offense is probably behind that of many others on this list. Gomez’s season has come out of nowhere, at least to some degree, meaning that it may be a fluke; for that to be determined, we’ll just have to wait and see. Though Brewers fan may be discouraged to hear it, history suggests it probably is.

——————————————————————————————————————————-

¹You know, from here, and here, and here, and here, and here, and here, and here. Also, I’ve now started doing footnotes a la Grantland, although there isn’t any linking yet.

²All stats are as of Tuesday, August 13th, in case this takes some time to get published.

³I’m really getting sick of people using “the league” to refer to MLB as a whole; it’s misleading and it’s wrong. This isn’t the NFL–there are two leagues, not one. When you’re referring to MLB, say “the majors”, not “the league”.

⁴Strikeouts for pitchers go back all the way to 1876 (i.e. when all pitcher stats go back to). Why’d it take 34 years to record strikeouts for batters?

⁵I’ve always hated BB/K–it returns numbers that are much too minuscule. I prefer the larger form of K/BB.

⁶Is that correct, or should there be no “s”?

⁷Reiser’s success that year–166 wRC+–was mainly motivated by a .377 BABIP, 97 points higher than the MLB average that year, and by far the highest of his career.


Mark Reynolds and his Ilk

Note: I have no idea if I’m the first to do this, but quite frankly I don’t care.

Today, it was reported that seven-year veteran and noted ump hater* Mark Reynolds was released by the Indians. As an Orioles fan who enjoyed watching Reynolds, this was disheartening for me–I’ve always liked TTO guys, and it’s hard to find a more TTO guy than Reynolds**. However, I was (and am) also a fan of the Orioles, meaning I would want them to win, preferably as often as possible. This means that starting a player with a career WAR of 7.4 (in nearly 4000 plate appearances , no less) probably isn’t the best way to accomplish that goal.

Now, about that WAR…

As of  Thursday, August 8th, 2013 (i.e. the day of his release), Reynolds is 322nd all-time in homers, and has nearly 200–for the record, there are 311 players with 200 dingers, as of the aforementioned date. Anyone who has watched Reynolds knows that he has formidable power, and his stats, at least for his career, reflect that–his .232 career ISO*** would rank 16th in the majors this year. However, that power comes at a price: namely, every other aspect of his game. Like, seriously. Plate discipline, baserunning, fielding, everything. The end result of this is the aforementioned WAR value, which translates to 1.2 WAR per 600 plate appearances; as a point of reference, these scrubs have WAR/600PA numbers of 1.9 and 1.8, respectively.

Now, the main point to get out of this is that Reynolds–a player with nearly 200 career long-balls, considered by the small-minded to be the symbol of all success–has a single-fucking-digit career WAR, when some players are able to get double-digits in a single season. This led me to the question: how many other players, of the 322 with 200 round-trippers, can fit this dubious distinction? This question led me to the answer: three. They are listed below in order of lowest to highest WAR, for your amusement, along with my best guess as to why this person was so shitty.

Jose Guillen–214 career bombs; 4.5 career WAR (.4 per 600 PAs)(!)

Guillen is  remembered for a few things:

1. Pulling a reverse Bedard (i.e. protesting when his manager removes him from the game) and being suspended for the Angels’ 2004 playoff trip; this actually happened during a decent season for him (3.0 WAR), so don’t be too sure he wouldn’t have helped them had he participated.

2. Holding that grudge with him**** for the rest of his career.

3. Being an all-around genial person.

3. His exceptional rookie year, which earned him comparisons to the immortal Neifi Perez, in addition to being, as of last June, the worst season for a right fielder ever.

4. Being, y’know, a generally horrible baseball player.

For all the talk recently of Jesus Montero being terrible despite PED usage, Guillen was pretty bad, and he juiced, too. In terms of career numbers, he had a triple-slash of .270/.321/.440, and a .330 wOBA; while he never really played in a hitter’s ballpark (he had brief stops in Cincinnati and Arizona), he still played in a hitter’s era, meaning his career wRC+ was only 98. His D, however, was what truly set him apart: -56.7 fRAA for his career, and it would’ve been even worse, if not for a ridiculously fluky 2005 (12.5 fRAA, by far the highest of his career). He also wasn’t a particularly good baserunner (-16.5 BsR).

He didn’t strike out nearly as much as Reynolds (17.2% career), but he also didn’t walk nearly as much (5% career), and his ISO was considerably lower (.169).

Dante Bichette–274 career four-baggers; 8.9 career WAR (.8 per 600 PAs)

The career of Bichette was best epitomized by his unfathomable 1999 season; I’ll provide a quick summary. Bichette had a triple-slash of .298/.354/.541 over 659 PAs, which translated to a .376 wOBA. A casual sabermetrician would look at that figure and say, “Well shoot, that’s pretty darn good!”, not knowing that it came while he played for Colorado, in 1999 (i.e. one of only three seasons in MLB history where teams averaged more than 5 runs a game). Thus, after adjusting for park and league effects, Bichette’s wRC+ for that season sat at a mere 100–he was an average hitter. For the sake of comparison, Josh Donaldson has a .372 wOBA for the Athletics this year–and a 139 wRC+. As Mr. Remington points out in the article*****, Bichette in 1999 was one of just two seasons where a hitter had a .370 wOBA or higher and a wRC+ of 100 or lower; the other season was Jeff Cirillo in 2000, playing for–you guessed it–the Rockies.

Focusing on Bichette’s career as a whole, he hit .299/.336/.499, for a .359 wOBA; however, because a lot of that was spent in Colorado, his career wRC+ was a mere 104; this, combined with poor defense (career -92 fRAA) and relatively poor baserunning (career -1.2 BsR), gave him the undesirable WAR seen above.

Bichette’s K% and BB% were somewhat similar to Guillen (15.7% and 5.2%, respectively), meaning they were considerably lower than Reynolds’ numbers; his ISO (.200) was considerably lower than Reynolds, though not as low as Guillen.

Deron Johnson–245 career circuit clouts, 9.7 career WAR (.9 per 600 PA’s)

The only old (i.e. pre-UZR) player who fit the criteria, Johnson was, allegedly, described by Pete Rose as the hardest ball-hitter he had ever seen. It’s too bad he struck out in nearly 20% of his plate appearances (high for the time period, when the average was about 15%).

Johnson only had one 4-win season (4.3 in 1965 for the Reds); in that year, he had a .370 wOBA, albeit with -9 fRAA. Fielding was his main problem (career -63 fRAA); his career triple-slash of .244/.311/.420 comes out to a .326 wOBA and a decent 102 wRC+, and his BsR was only -3.0. His K% and BB% (8.8% and 19.9%, respectively) were higher than the averages for his era, but not to the degree of Reynolds’, though his ISO (.176) was pretty high for the time.

He’s the least spectacular of the bunch, probably because he played back in the 60’s and, therefore, is completely insignificant.


So what was the point of this? To use as many variations of the word “home run” as possible?****** Possibly. To find the closest companions to a favorite player? Possibly. Was this whole thing completely, utterly pointless? Definitely.

————————————————————————————————–

*He actually made some good points in the rant. Here’s the quote that really resounded with me: “…It’s a shame [the umpires] don’t have accountability. They don’t have any, if they make a bad call, it’s like, ‘Ho-hum, next day is coming.’ If we have a bad couple of games we get benched or we get sent down. They have nobody breathing down their throats. They have nobody, they are just secure in their jobs.”

**To be fair, Reynolds acknowledges his approach may not always be the best.

***Reynolds’ and Jose Reyes‘ 2011 seasons are a perfect example of why SLG% is overrated. At the conclusion of the season in question, Reynolds’ SLG% was 10 points higher than Reynolds’ (.493 to .483), despite Reynolds having an ISO a HUNDRED AND SIX points higher (.262 to .156). Now, in the context of this season, was Reynolds a better overall hitter? Certainly not (in case you forgot, this was Reyes’ last year with the Mets, when he had a phenomenal year, leading the league in batting average, etc.). Was Reynolds a better power hitter? Certainly yes. Hmmmmm…not sure if “Certainly yes” is grammatically correct. Whatever.

****The quote from Guillen should really win an award for Worst Butchering of the English Language (particularly the first sentence).

*****In the article, Remington cites Bichette as having a 98 wRC+ in 1999, when on his player page, it lists him as having a 100 wRC+. Have the park or league factors changed since last year?

******I used homers, dingers, long-balls, round-trippers, bombs, four-baggers, and circuit clouts. Thanks to this post for supplying me.