Archive for Player Analysis

Bryce Harper Looks Average

Bryce Harper is in a slump. Not a daily, weekly, or monthly slump, but a slump that has been going on since the beginning of May — nearly two months. Coming off a breakout season in 2015, Harper seemed poised to be even better this year. In April he had a .714 slugging percentage, a 1.121 OPS, and a 181 wRC+ (creates 81% more runs than the average hitter). No pitcher wanted to pitch to him. On a day during the first week of May, Harper went 0-0, with six walks and one hit-by-pitch. Since then, it seems like walking is the only thing he’s done well. In May, he hit .200/.363/.785 with a 105 wRC+. In June, he’s hit .262/.369/.720 with a 95 wRC+(though he did post OBPs of .422 and .351 in May and June, respectively). In essence, Harper has produced like an average major-league hitter over the last two months. The only problem with that is that Harper is widely regarded as not an average MLB hitter, but one of the best (if not the best) hitters in all of baseball.

Sure, hitters go into slumps all the time. It’s no reason to get worked up about a bad spell here and there. Remember, baseball is a game where a hitter fails 70% of the time and is considered a Hall-of-Famer. There are going to be 0-4 days.

But two months seems like an awfully long time. And it’s my job here to find out why. So let’s take a look.


The first thing that stands out when examining Harper under the microscope of a computer is his batting average on balls in play (BABIP). He’s hitting .257 in said category — well below his career average of .323 and well below the 2016 MLB average of .300. BABIP does reflect the ability of the hitter, but it also depends significantly on defense and luck. A batter whose BABIP is well below his career and league average may just be getting unlucky — whether that is from hitting the ball directly at defenders or defenders making spectacular plays.

So, is Harper hitting the ball with the same authority he did last year (which would confirm the idea that he’s getting unlucky)? Not quite. In the following table you can see that the number of line drives he’s hit (LD%) is down 7% and number of balls he’s hit softly (Soft%) is up 12%. He’s hitting fewer line drives and more fly balls (FB%) — but those fly balls aren’t turning into home runs, as his HR/FB% is down from 27% to 17% (i.e. last year for every 100 fly balls that Harper hit, 27 of those were home runs. This year he’s hitting 17 home runs for every 100 fly balls).

Screen Shot 2016-06-28 at 11.53.23 AMScreen Shot 2016-06-28 at 11.54.42 AM.png

So, Harper is hitting more soft fly balls that are getting caught by outfielders, and fewer line drive that find gaps. Could this be a result of his discipline at the plate — his ability to differentiate strikes from balls and to swing accordingly? There are two things I want you to look at: Z-Swing% and O-Contact%. They sound confusing but they’re simple to understand. Z-Swing% is the percentage of strikes the batter swings at. O-Contact% is the percentage of balls outside the strike zone that the batter makes contact with.

Screen Shot 2016-06-28 at 12.06.25 PMScreen Shot 2016-06-28 at 12.06.42 PMScreen Shot 2016-06-28 at 12.06.50 PM

You can see the difference between last year and this year. Harper is swinging at fewer strikes (5% less) and making contact with more balls outside the strike zone (5% more). That would explain why he’s hit more balls softly this year — he’s making weak contact with pitches outsize the zone. It’s much harder for a batter to hit a ball well outside the zone because it’s farther away from him. You can see the truth in this statement from the following graph (all qualified hitters from 2012-2016).

Screen Shot 2016-06-28 at 12.46.55 PM

The graph shows the relationship between isolated power (ability to hit for extra bases) and O-Contact%. It’s pretty clear that the more often a batter makes contact with a ball out of the zone, the less likely that ball with result in a double, triple, or home run. In 2016, Harper is somewhere right smack in the middle of all the dots (0.65 O-Contact%, .225 ISO).

Before I end, I just want to make it clear that Harper isn’t by any means a bad player. He’s a superstar, an All-Star, and probably the face of MLB — oh, and he’s 23. But, for lack of a better term, he’s performed like an average player the majority of this season, so I set out to find why. I think it’s mostly due to being unlucky with his deflated BABIP, but I’d also be cognizant of plate discipline if I were him. Pitchers do try to pitch around hm — just being a little more patient and swinging at more strikes and fewer balls wouldn’t hurt.


John Lackey Has a New(ish) Slider

Read any article on the Cubs and you’ll find praises on pretty much everything they’ve been doing this season. Rightfully so. Their MLB leading 49-26 record deserves some praise. The national spotlight has been focused on their young talent for the first couple months of the season, and even more so recently with the call up of top catching prospect Willson Contreras, who hit a home run on the first pitch he saw in the majors. That sums up how the season has been going so far for the Loveable (No Longer) Losers. But what about the vets? Not many people outside of Chicago have noticed just how good the second-oldest Cub, John Lackey, has really been this season. The 37-year-old has complemented the 1-2 punch of Jake Arrieta and Jon Lester very well this year and is quietly having one of the best seasons of his career: (courtesy of fangraphs.com and brooksbaseball.net):

John Lackey K% BB% SwStr% BA against SL
Career Avg 18.9 6.7 9 0.229
2016 26.6 6.6 12 0.109

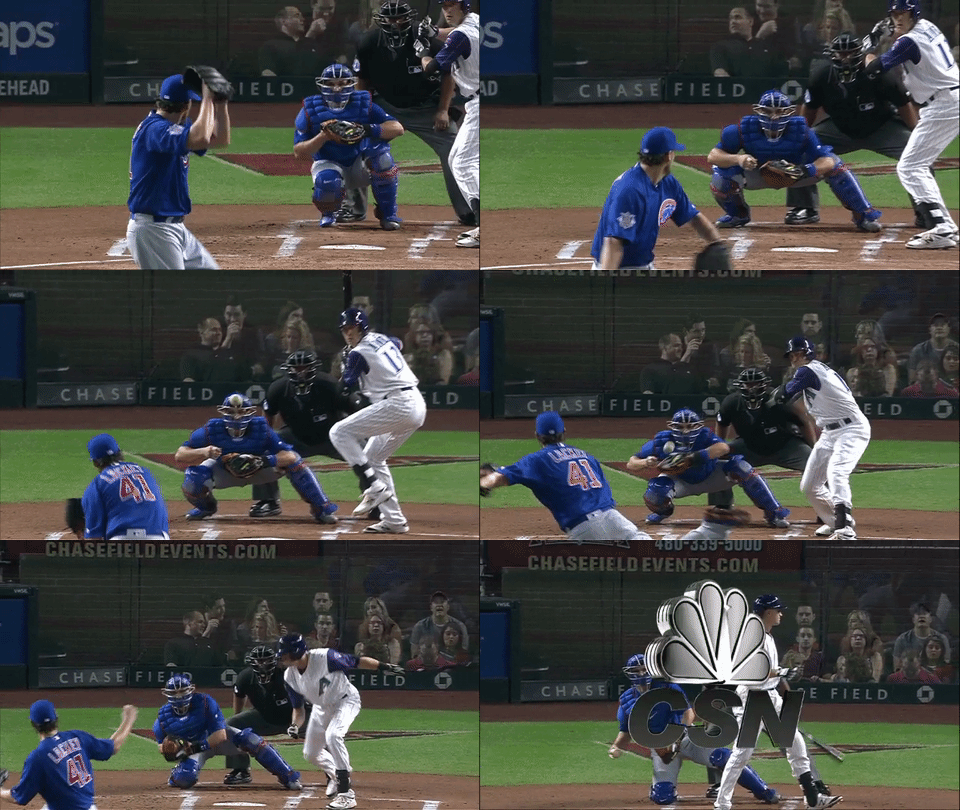
His strikeout rate and swinging-strike rate are up (a lot), his opponents batting average against is down (a lot), and his walk rate has virtually remained the same. Plus there’s the fact that his slider has been pretty devastating this year. According to the wSL (weighted Slider) metric on FanGraphs, which uses run expectancy to evaluate the effectiveness of a pitch, he’s had the third-best slider in the league to date. Surprisingly, Lackey’s slider has been more effective than some of the most well-known sliders in the game, including Jose Fernandez, Justin Verlander, and Madison Bumgarner. It’s pretty incredible considering his slider has been nowhere near this good in the past. In case you were wondering what it looks like, here’s a clip courtesy of baseballsavant.com:

Lackey2016

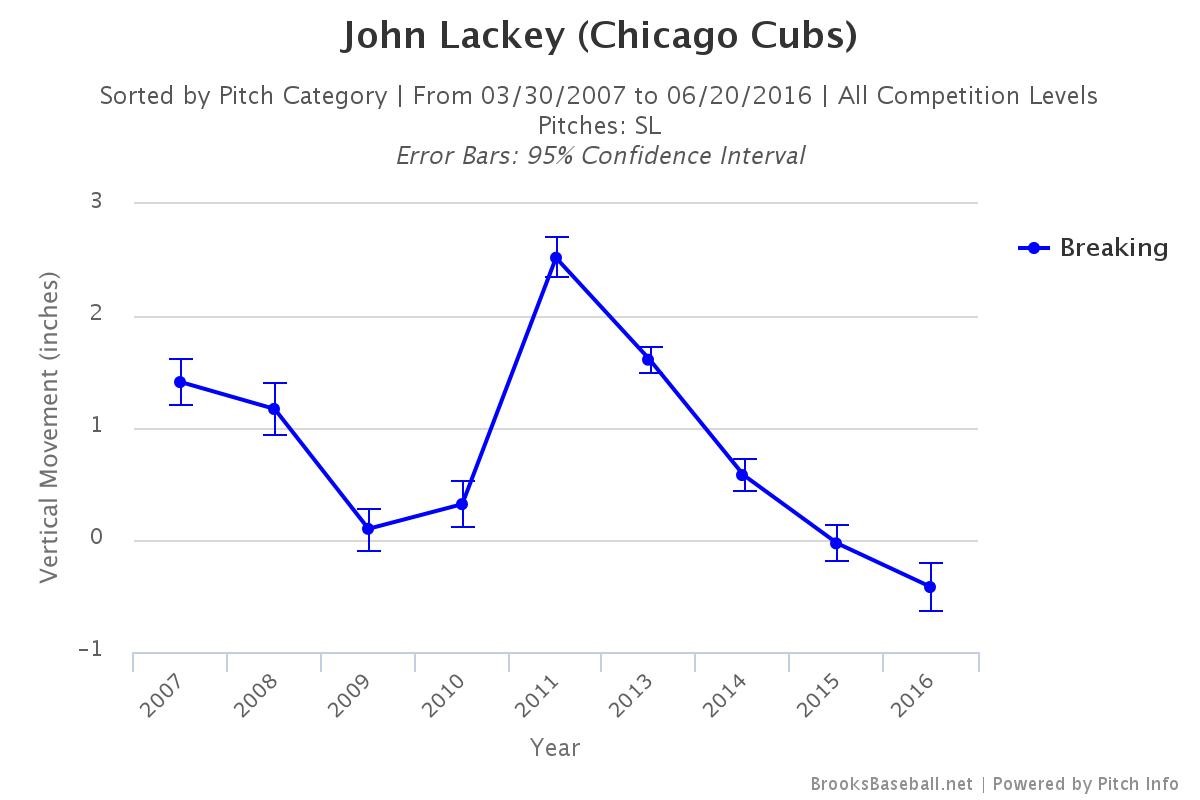
That’s some nasty break coming in at around 87 MPH, according to MLBAM. Some nasty vertical break, to be specific. Taking a look at seasonal data from brooksbaseball.com, Lackey’s had an increase in average vertical movement this year.

(FanGraphs primer for those who aren’t familiar with Pitch F/X: Pitch F/X movements are based around a hypothetical pitch that has absolutely no spin, so when a pitch breaks “up”, it means that it does not fall as much on the way to the plate as a spin-neutral pitch would.)

Lackey_VertMovement

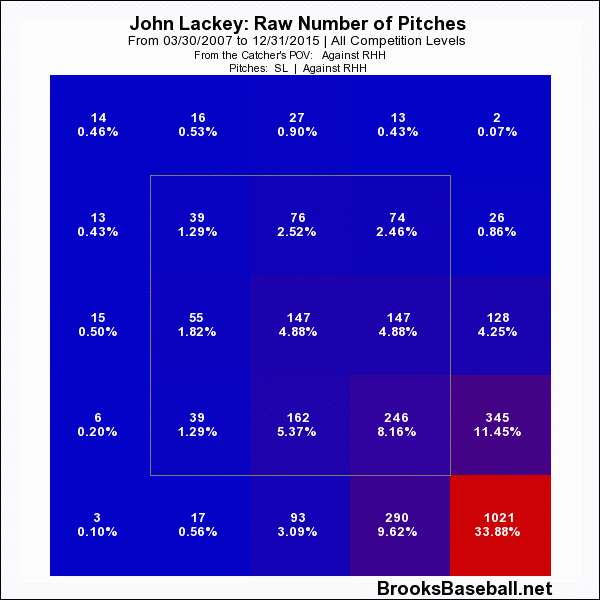
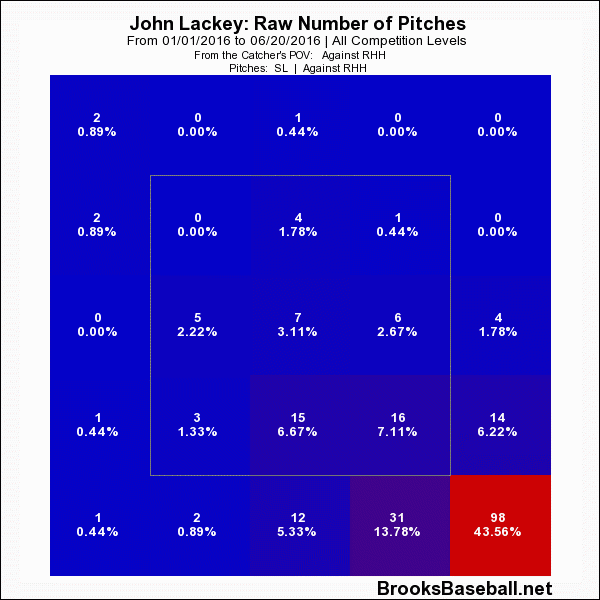
For the first time in his career, he is averaging negative vertical movement, without changing the horizontal movement or velocity on the pitch. That’s a borderline curveball. Typically, most breaking pitches with negative vertical movements are curveballs, but Lackey’s slider teeters right on the edge. Surprisingly, It’s not something he hasn’t done before. His minimum and maximum values for vertical movement have been pretty similar the last few years according to Brooks Baseball. And it’s not like he’s throwing in a different spot to righty hitters. His heat maps for his slider for his career and in 2016 look virtually identical:

LackeyHotZones2015

LackeyHotZones2016

He loves throwing it low and away. It does look like he’s been getting his pitch more in the dirt this year though. That’s a byproduct of how he’s been maxing out his vertical break this year, and without sacrificing anything else. How’s that, you might ask? That’s a difficult question.

Here’s one interesting theory. There’s only one other pitcher on that leaderboard that averages negative vertical movement. I’ll save you the suspense: it’s teammate Jason Hammel, who has a pretty effective slider himself. And according to the Pitch F/X data from brooksbaseball.com, their sliders are eerily similar:

2016 Slider Averages Vertical Horizontal Velocity
John Lackey -0.6 3.2 84.2
Jason Hammel -0.7 3.3 85.2

Hammel has had one of the best sliders in the past few years. Maybe he’s helped guide Lackey into using his slider more effectively. Purely speculation, but an interesting thought nonetheless. Regardless of his new(ish) changes and whether or not they’re here to stay, hitters better start adjusting to Lackey’s slider.


Buying or Selling Carlos Gomez

What are you to do with a former fantasy superstar who hasn’t lived up to expectations? For some, the answer’s easy; Carlos Gomez has already been dropped in over 25% of leagues on both ESPN and Yahoo.

Now that I’ve driven half my audience away with my use of a semicolon, let’s start the real analysis. Gomez certainly disappointed his owners through the first month and change of the season, sporting a minuscule .486 OPS through May 15 before being placed on the DL. For reference, out of 324 batters with at least 100 plate appearances, just two (2) have a lower OPS as of June 24. Both are on the Braves (one hit fifth in the lineup as recently as June 21, while the other has batted second 13 times this season).

So yes, one could see why owners would have lost patience with Gomez. But this was also a player who hit 66 home runs and stole 111 bases while hitting .277 between 2012 and 2014. If anyone deserved patience, it was him.

So when he hit two home runs in his first six games back from the DL, it was hard to be too surprised. Since then, he’s put together five multi-hit performances, and has brought his season line back up to at least non-Atlanta-ish numbers.

While it’s obviously a small sample size, Gomez’s 76 plate appearances in 19 games since his return have shown immense improvement over his horrendous start to the season. To demonstrate this, take a look at each of the different areas in which he’s bounced back:

Plate Discipline
2012-2014 April 5 – May 15 May 31 – June 24
BB% 6.2% 5.3% 10.5%
K% 22.8% 34.8% 30.3%
BB/K .27 .15 .35
SwStr% 13.9% 19.4% 16.7%
O-Contact% 59.5% 42.4% 45.9%
Z-Contact% 84.4% 74.4% 80.5%
O-Swing% 37.4% 32.1% 35.7%
Z-Swing% 79.3% 79.9% 65.8%

I could bring up more player comparisons and show you just how bad the Atlanta Braves are this year, but that’s not the point of this article. Instead, let’s just focus on Gomez’s numbers and how they compare to earlier in the year and during his prime years. He’s nearly doubled his walk rate while striking out more than 10% less often than before, leading to a BB/K that is no longer painful to look at. He’s missing less frequently on pitches he swings at, both in and out of the zone, and has fewer swings-and-misses as a result. The one worrisome spot here is his swing rates, where the trend is the opposite of what we’d generally expect when we see favorable results. However, his O-Swing% is still lower than it was between 2012 and 2014, and it seems as though swinging less at pitches in the zone is leading to more walks and less bad contact, so it’s not truly a terrible result.

Batting and Power
2012-2014 April 5 – May 15 May 31 – June 24
AVG .277 .182 .294
BABIP .329 .293 .405
OBP .336 .238 .368
SLG .483 .248 .471
ISO .206 .066 .176
OPS .819 .486 .839
wOBA .356 .216 .364
wRC+ 123 28 129
HR/FB% 14.6% 0.0% 33.3%

I already referenced Gomez’s OPS above, but it’s still almost unbelievable to see that his post-injury slugging percentage is nearly as high as his OPS once was. Besides that, there’s improvement across the board. His average is up over 100 points, as his OBP, SLG, ISO, OPS, and wOBA. He’s gone from being 70% worse than the average hitter to 30% better. What’s good to see her is that he’s not outpacing any of his career stats by a noticeable amount — an indication that his current run is very much sustainable. Okay, maybe not the .385 BABIP, but as you’ll see next, keeping it over .300 shouldn’t be an issue.

Batted Ball Breakdown
2012-2014 April 5 – May 15 May 31 – June 24
GB% 39.3% 47.1% 44.2%
FB% 40.6% 35.7% 20.9%
LD% 20.1% 17.1% 34.9%
Pull% 42.7% 36.4% 62.2%
Cent% 33.9% 41.6% 13.3%
Oppo% 23.5% 22.1% 24.4%
Soft% 16.7% 29.9% 31.1%
Med% 48.0% 45.5% 28.9%
Hard% 35.3% 24.7% 40.0%

Let’s take this one at a time. First, Gomez has seen a drastic increase in his line-drive percentage, unfortunately at the expense of hitting fewer fly balls. While it’d be better to see him hit fewer ground balls and get some more balls in the air, he’s certainly making this approach work for him right now. He won’t hit 30 home runs with this approach, but with the increased line drives, he should have no problem continuing to hit for extra bases.

Then comes the confusing part. He’s increased both the percentages of balls he hits to the pull side and opposite of the field, now hitting just 13.3% of his balls to center. He was definitely spraying the ball better beforehand, although the bloated Pull% will undoubtedly help him to put up some better power numbers. If the numbers stay in this region, I’d definitely expect his BABIP to regress, but it’s more likely that they regress closer to his career norms. A lot of those pulled balls will end up going to center field.

Finally, there’s the stuff that’s easy to analyze. Hit the ball harder, get better results. Gomez apparently believes in that approach as well, now hitting the ball hard over a third of the time and showing over a 50% increase from his previous rate. He needs to work on hitting the ball soft less often, which should happen if he continues to be selective and wait for his pitch.

Statcast Data
2015 April 5 – May 15 May 31 – June 24
Exit Velocity (mph) 88.5 84.8 86.4
Exit Velocity on Line Drives and Fly Balls (mph) 92.7 91.2 96.4
Fly Ball Distance (feet) 315.2 309 359

Ah, Statcast. What would we do without your infinite wealth of knowledge? The data here was obtained through Baseball Savant, and confirms that Gomez is indeed hitting the ball harder than he was before his injury. His overall average exit velocity remains low, but his velocity on line drives and fly balls is actually higher than it was last year. He can hit all the slow ground balls he wants and still be successful, provided he can keep up this increased velocity on balls in the air. Of course, he’s not going to continue hitting his fly balls over 350 feet — that’s reserved for people like Byung Ho Park (and apparently Tyler Naquin?). But he’s at 323 feet for the season now, and which should easily suffice for him to begin putting up some rejuvenated power numbers.

If you’re looking for a tl;dr, here it is: Carlos Gomez is performing much better than he was earlier in the season. He’s taking more walks, striking out less, making more contact, and hitting the ball harder and farther (further?). It’s obviously a small sample size, and he may not put up another 20/40 season, but he’s more than capable of hitting 10 home runs and stealing 15 bases the rest of the way. While it’s not elite production, it’d be better than he did last year, which would be quite an achievement after his start to the season.


A (Robbie) Ray of Hope for the D-Backs?

At this moment, the Arizona Diamondbacks, those same Diamondbacks who went into “win now mode” this offseason, currently sit in fourth place in the NL West division. A few weeks ago, Dave Cameron wrote an excellent article about what direction the D-Backs can go from here. The D-Backs’ pitching has specifically underwhelmed this year. However, one starter on their roster stands out to me, one who was not much more than an afterthought on their staff at the beginning of this year. That man is Robbie Ray.  He has a 10.4 K/9! That’s good enough for ninth in the majors among qualified starting pitchers — ahead of Madison Bumgarner, David Price, and Jake Arrieta (to name a few). He struck out eight guys in five innings his last time out. But, his ERA sits at an unimpressive 4.59. What’s up with Robbie Ray? Let’s take a look.

Let’s start with his four-seam fastball. Its velocity has risen each season since he first came up in 2014. He’s topped out at 97.6 this year — great for a lefty. He averages 93.6 on the heater, which is harder than all other qualified lefties this season. Its swinging-strike rate has gone from 7.1% last year to 8.3% this year — a very high SwStr% for a fastball. The pitch even has a bit of arm-side run and added backspin, giving it a “rising” appearance. He throws his fastball 59.6% of the time (third-highest in the majors), and for good reason.

His slider is solid. Hitters are managing a meager .570 OPS against it. It has an 18.4% SwStr%, up 0.3% from last year. Here is a wonderful gif of Ray striking Andrew McCutchen with the slider. And him striking out McCutchen again. Not to mention, the pitch is generating a whopping 68% groundball rate this season.

So both the fastball and slider are solid pitches. But here is where Ray runs into some trouble: his two-seamer is mediocre and his changeup is awful.

He throws the two-seamer hard, and consequentially, it has less movement than average. It has slightly more movement than his four-seamer, but otherwise, it’s just a slower version of the four-seamer with much less “rise”. Last year, it did generate a solid 54% GB%, but this year, that number has dropped to 45%. Hitters are mashing it to the tune of a .962 OPS this season, though last year they only managed a .729 OPS in a similar sample size. That being said, the SwStr% of the pitch has jumped from 6.1% last year to 7.1% this year, probably because his improved fastball and slider help to set it up better.

The changeup is awful: hitters currently have a 1.437 OPS against it this year. But, last year, hitters only had a .662 OPS in a similar sample size. He has trouble commanding this pitch, especially: he throws it for a strike only 53% of the time. However, there is some good news: the SwStr% has almost doubled, going from 4.6% to 8.5%.

Having examined Ray’s repertoire, I have a couple of predictive theories. Firstly, his HR/FB ratio is an exceedingly high 16.7%. This is well above the league average and his career rate of 10.9%. According to park factors on ESPN and FanGraphs, Chase Field is at least in the top five in terms of worst parks for pitchers, so that could explain some of this. He also over-performed with a 7.3% HR/FB rate last year, and maybe this is just regression coming in. Either way, I think that this rate should certainly improve through the rest of the season, settling in closer to his career average rather than 16.7%. Unsurprisingly, the changeup is the main culprit here; it has a 100% (!) HR/FB rate. This should almost certainly regress, which would bring his “OPS against” on the changeup back down.

Something else of note is that the changeup and two-seam fastball are weapons primarily deployed against batters of the opposite handedness, as they would move away from the batter. Since these are Ray’s two poorest pitches, it makes sense that he struggles to get right-handed batters out. They have a .875 OPS against him, compared to the meager .590 OPS that lefties manage. The changeup and/or two-seamer need to improve for Ray to start getting right-handers out. These two pitches have been hit hard, and have thus helped to make Ray’s BABIP climb up to .350. The BABIP against his changeup is .476, and against his two-seamer it’s .421.

One last thing that should not be discarded is that Ray’s walk rate has risen this year. Poor command of his pitches has resulted in him leaving a few meatballs over the plate. The fact that he only throws his changeup for a strike 53% of the time is specifically a major detriment to his control; the rest of his pitches are at least at 60% or higher.

So, Ray’s HR/FB rate should at least regress a bit, and I think that he can get his ERA under 4 for this reason alone. Roll with the Steamer projections for the rest of his season over ZiPS, but keep in mind neither projection system knows everything of Ray’s velocity increase and improved SwStr%, so it’s entirely possible that he can do even better, maybe even sustaining a 10 K/9, especially if he can improve his command and work on his changeup and two-seam. To sum it all up, the SwStr% has improved on all of Ray’s pitches, and there’s room for improvement yet; he’s only 24 years old.


Taking a Look at David Price’s Turnaround

After signing a massive seven-year, 217-million-dollar contract with the Red Sox this past offseason, David Price got off to a slow start. After his May 7th start against the Yankees in which he gave up six earned runs in just 4.2 innings, Price’s ERA stood at a whopping 6.75 yet his peripherals remained strong. He had a 2.98 FIP and 11.5 K/9. However, he was giving up hard contact over 41 percent of the time. The immediate fix was a mechanical issue noticed by Dustin Pedroia that was limiting Price’s leg lift and diminishing his velocity. Frustrated with his failures, Price vowed to be better.

And better he has been. After throwing a gem in Sunday’s win over the Mariners where he went eight innings allowing his only run on a solo shot by Franklin Gutierrez, Price lowered his season ERA to a still high 4.24 and had his eighth straight quality start. Over those eight starts, Price has been much better, allowing 16 runs over 58.1 innings for an ERA of 2.47. During this stretch, he has a 3.88 FIP and 8.6 K/9 and has only allowed hard contact around 27 percent of the time. Although his strikeouts have gone down and his FIP went up due to his decrease in strikeouts to go with an increase in home runs allowed, Price has limited the amount of hard contact he has given up. This can be seen in the BABIP over the two stretches. In his first seven starts, his BABIP against was around .370, while in this current eight-start stretch it is hovering around .230.

This in turn, has allowed him to be very successful while pitching to contact. His biggest issue remains his ability to keep the ball in the park. Over his last eight starts, Price has allowed at least one home run in seven of them. So while he has limited hard contact against him, the few mistakes that he makes each game are punished. Despite this increase in home runs allowed, he continues to pitch well and go deep into games, allowing the Red Sox bullpen a chance to recover after the consistently shaky starts from their 4th and 5th starters.

There are a few main reasons to this improvement. The first was his ability to regain his velocity. Looking at his velocity each month thanks to data from Brooks Baseball, there is a small but steady increase in his average four-seam and sinker velocity. Before May 8th, his velocity was low by his standards. Typically a pitcher averaging 94 to 95 MPH with his fastball, he had been sitting 93 MPH.

Year Fourseam Sinker Change Curve Cutter
2016, Before May 8th 93.2 93.0 84.3 78.8 88.8

Although just a small dip in velocity, it made him much more hittable.

Since May 8th, his velocity has been back on the rise.

Year Fourseam Sinker Change Curve Cutter
2016, Since May 8th 94.2 93.4 85.0 78.3 89.0

After the mechanical change, his four-seam has been averaging around 94 MPH and his sinker has been averaging around 93 MPH, but still slightly up from what it was before. Although it is a small increase, this added velocity has helped Price dominate hitters, gain confidence, and re-establish himself as an ace.

Another key factor in this improvement has been his pitch usage. Using pitch data from Brooks Baseball, I was able to look at Price’s pitch usage. In his first seven starts, Price relied on mixing different types of fastballs with his main offspeed pitch being a change-up while also displaying the occasional curve.

Year Fourseam Sinker Cutter Curve Change
2016, Before May 8th 27.6 22.6 19.8 6.6 23.4

His four-seam was used around 28 percent of the time yet it lacked the movement displayed by his cutter and sinker. The high four-seam usage to go with decreased velocity spelled trouble for Price.

However, since May 8th, Price has made an adjustment displayed by the fact that he is now using his sinker as his primary pitch while also using his four-seam far less frequently.

Year Fourseam Sinker Cutter Curve Change
2016, Since May 8th 9.0 36.1 22.4 8.3 24.3

His sinker is now used around 36 percent of the time compared to his four-seam being used around nine percent of the time. With this added movement and velocity, Price has been able to be more effective while keeping the use of his curve, cutter, and changeup around the same. This simple switch from a four-seam to a sinker has allowed him to go on a tear.

Looking forward, the Red Sox need Price to continue to be the pitcher that he has been over his last eight starts. They are paying him ace money and he is expected to pitch like one down the stretch as Boston hopes to continue their great turnaround year. If Price continues to have outings like these, the Sox should like their chances come October with him taking the mound with their season on the line.


Who Has Performed Better In the Draft?

The MLB draft has passed but its impact will last. Some selections will go down as busts (e.g. Matt Anderson by the Tigers in 1997). Others will be real bargains such as Carlos Beltran with the 49th pick in 1995. I decided to look at the numbers in an attempt to answer the following questions I read over the last few weeks:

  1. How many Round 1 picks do end up in the big leagues? What’s the average impact of a Round 1 pick? How does that compare to Round 2? Are there differences between pitcher and batters?
  2. What has been the best draft class for the 1993-2008 period? (per three first rounds)
  3. What teams have done a better job?
  4. What is the best round (top 10 overall picks)?

As I usually do, let’s define the data sources and assumptions. First, my data source is Baseball-Reference. There are many assumptions and disclaimers in this process, but the most important ones are:

  1. I am using data from 1993 to 2008 to give ample time for players to reach MLB. As I am using career WAR, I don’t want to over-penalize players that have been selected in the recent years and therefore have not accumulated MLB service time.
  2. Organizations change and so do their ways of conducting business, which evidently includes draft strategy. We are looking at teams rather than specific front offices or general managers.
  3. WAR refers to Baseball-Reference WAR (i.e. bWAR).
  4. Teams may have more than one pick per round due to compensation and supplemental picks.
  5. This methodology does not take into account the overall quality of the draft pool i.e. total WAR per draft year is not constant.
  6. All WAR is allocated to the team that drafts the player. Understandably, that is not true but let’s toy with the idea through this post.

Let’s get to it.

Question 1 – How many Round 1 picks do end up in the big league? What’s the average impact of a Round 1 compare to a Round 2 pick? Are there differences between pitcher and batters?

The table below outlines how many players have been/were called up to the majors and how many actually have had a positive career WAR i.e. over 0.0. I have also added the average career WAR per player and I have broken down the data by round and by position (pitcher and batter) to grasp the differences easily. Just take a moment with this table:


Round Pos Total players Players that reached MLB % of Total players Positive WAR % of players who reached MLB Average WAR per player
Round 1
Pitchers 372 242 65% 161 67% 9.7
Batters 320 225 70% 157 70% 14.4
Sub-Total 692 467 67% 318 68% 12.1
Round 2
Pitchers 247 121 49% 60 50% 8.1
Batters 244 127 52% 70 55% 13.1
Sub-Total 491 248 51% 130 52% 10.8
Round 3
Pitchers 244 99 41% 59 60% 5.5
Batters 235 88 37% 50 57% 7.3
Sub-Total 479 187 39% 109 58% 6.3
Total 1662 902 54% 557 62% 10.6


Three things come to my mind:

First, this provides some empirical validation of what we intuitively thought: First-round picks produce greater WAR values than the others. While I only have data for the first three rounds, it’s worth noting that the gap between Round 1 to Round 2 (10%) is smaller than from Round 2 to Round 3 (41%).

Second, I actually found surprising that 67% of first-rounders reached MLB at some point. That is two players out of three and it’s a testament to how important raw skills are when it comes to moving up through the minors.

Lastly, the answer to the question of whether t draft pitchers or batters looks like an easy one. Batters not only reached MLB at a higher pace but delivered better results as a group and as individuals. While these results are not statistically significant, they provide a pragmatic answer to the question and suggest a sound strategy might be to draft batters and trade for pitchers later down the road.

Question 2 – What has been the best draft class for the 1993-2008 period?

This table should provide guidance on how to answer this question but does not fully explain it. If we think of it as the number of players that got to MLB, then 2008 is the best year. That year highlights Eric Hosmer, Buster Posey, Brett Lawrie, Craig Kimbrel and Gerrit Cole as the most prominent stars, but offers a very low career total WAR as most of its players are still playing – they’re the youngest generation of my sample. In this class, 27 out of the top 30 picks have reached MLB, though a few for a very short stint e.g. Kyle Skipworth or Ethan Martin.

Year Total war Total players that reached MLB Average WAR per player
1993 476.3 54 8.82
1994 243.4 54 4.51
1995 484.9 41 11.83
1996 280.0 45 6.22
1997 409.5 59 6.94
1998 397.6 53 7.50
1999 402.1 52 7.73
2000 236.8 47 5.04
2001 350.9 55 6.38
2002 508.1 54 9.41
2003 297.1 60 4.95
2004 393.2 63 6.24
2005 458.1 63 7.27
2006 282.7 62 4.56
2007 325.4 69 4.72
2008 213.2 71 3.00


If we think of the highest total career WAR, then the winner is 2002. This class is led by two of the best picks on the sample (Zack Greinke and Joey Votto) but also features Prince Fielder, Jon Lester and Curtis Granderson. If we think of highest concentration of skills, then the 1995 class has to be the first one with an average of 11.8 WAR per MLB player. On the other hand, only 41 players got the MLB call, the lowest among the sample. While Carlos Beltran and Roy Halladay are the most notable names in that draft, player such as Darin Erstad, Kerry Wood, Randy Winn and Bronson Arroyo enjoyed nice peaks.


Question 3 – What teams have done a better job?

Evidently, not every team has selected in the same combination of draft slots e.g. some teams have had the opportunity to choose top picks (Rays, for example), while other have frequently picked from mid-bottom draft slots (Yankees).  It would not be fair to compare total career WAR for players the Yankees has selected against those that the Rays has because the latter had more options and access to a different pool of players than that the Yankees had. How to fix that? I am comparing what each team did on the overall pick they were slotted. If we use 2016 as an example, I would be comparing how good Philadelphia was in choosing Mickey Moniak as pick 1 against the average of all other first picks in the timeframe (1993-2008). Once I know the WAR gap between a particular team and the average WAR per pick, I need to standardize that number by the standard deviation i.e. calculating Z scores. In simple terms, this is understanding how good or bad a pick was in relation to the entire distribution of a particular draft slot. The Z-score number allows us to compare how good a 14th pick was in relation to a third pick, for example. Finally, to identify which teams have fared better, I am calculating the average of Z-scores for all picks.

Again, there are many caveats here, but this should give us a ballpark estimate on how well teams have drafted from 1993-2008. Keep in mind, this methodology does not produce a linear WAR per draft slot. That would mean, for example, that overall pick 4 will produce greater WAR than pick 5. On average, the 4th pick has produced 6.2 WAR on average, while the 5th one has produced 14.3. While this might be counter-intuitive (it is at least for me), the empirical evidence of this sample size shows that.


Batter Pitcher    
Teams # of batters drafted Average of OvPck – Zscore # Pitchers drafted Average of OvPck – Zscore Total Count of Name Total Average of OvPck – Zscore
Phillies 26 -0.81 24 -0.46 50 -0.64
Nationals 9 -0.70 6 -1.14 15 -0.88
Athletics 40 -0.99 30 -0.75 70 -0.89
Twins 34 -0.57 32 -1.31 66 -0.93
Diamondbacks 18 -0.84 26 -1.06 44 -0.97
Angels 18 -1.10 27 -0.88 45 -0.97
Rays 14 -0.50 20 -1.31 34 -0.97
Rangers 26 -1.06 28 -1.05 54 -1.06
Cardinals 28 -1.03 34 -1.25 62 -1.15
Giants 34 -1.23 28 -1.10 62 -1.17
Braves 32 -1.24 35 -1.12 67 -1.18
Royals 25 -1.40 32 -1.04 57 -1.20
White Sox 24 -0.65 40 -1.54 64 -1.20
Reds 28 -0.73 27 -1.70 55 -1.21
Blue Jays 32 -1.46 27 -0.91 59 -1.21
Red Sox 29 -1.33 35 -1.14 64 -1.23
Brewers 26 -0.87 27 -1.72 53 -1.30
Dodgers 21 -1.13 32 -1.44 53 -1.32
Rockies 18 -0.85 33 -1.60 51 -1.33
Pirates 27 -1.72 23 -0.88 50 -1.33
Mariners 25 -1.33 20 -1.45 45 -1.38
Mets 17 -1.14 35 -1.61 52 -1.45
Tigers 20 -0.81 32 -1.88 52 -1.46
Orioles 28 -1.05 28 -1.88 56 -1.46
Padres 40 -1.47 24 -1.54 64 -1.49
Marlins 30 -1.59 23 -1.41 53 -1.51
Astros 23 -1.45 26 -1.61 49 -1.53
Expos 26 -1.30 22 -1.85 48 -1.56
Yankees 24 -1.94 29 -1.37 53 -1.63
Cubs 24 -1.46 29 -1.95 53 -1.73
Indians 33 -2.13 29 -1.49 62 -1.83
Total 799 -1.19 863 -1.35 1662 -1.27


Perhaps surprisingly, the Phillies come at the top of the list. The Phillies advantage came in three picks: First, Chase Utley was drafted in 2000 with the high 15th pick and has had a great career that is up to 63.4 WAR. Second, in 1993, the Phillies chose Scott Rolen (70 career WAR) with the 46th overall pick – which seems like a bargain now. Finally, Randy Wolf in 1997 was selected in the 54th position and went on to have a 23.1 career WAR. The Nationals have had very much success on their first few years as a franchise with both Jordan Zimmermann and Ryan Zimmerman. The sample size does not include Bryce Harper or Stephen Strasburg, which may push the Nats to the top of the list in the near future.

Astros, Expos, Yankees, Cubs and Indians are the bottom five teams. Coincidentally or not, these teams have long droughts (Yankees exempted). Interesting to see if there is a relationship between draft performance and wins but I guess that’s is another post.

We could go and dig deeper for each team into what they’ve done well and not so much but that would not make sense. Teams make mistakes and it looks like the draft selection is pretty damn hard with an extremely high WAR standard deviation (11.6 WAR through the first 30 picks).


Question 4 – What is the best round (top 10 overall picks)?

This question is about finding the best selection on each of the first 10 picks. I’ve used the Z-score which pick was really ahead of the curve.

OvPck Year Tm Player Pos WAR Average WAR of pick OvPck – Zscore
1 1993 Mariners Alex Rodriguez SS 118.8  22.73 3.16
2 1997 Phillies J.D. Drew OF 44.9  16.23 1.88
3 2006 Rays Evan Longoria 3B 43.3  9.00 2.46
4 2005 Nationals Ryan Zimmerman 3B 34.8  6.21 2.67
5 2001 Rangers Mark Teixeira 3B 52.2  14.26 2.02
6 2002 Royals Zack Greinke SP 52.3  4.76 3.63
7 2006 Dodgers Clayton Kershaw SP 52.1  11.86 2.42
8 1995 Rockies Todd Helton 1B 61.2  6.41 3.56
9 1999 Athletics Barry Zito SP 32.6  8.70 2.24
10 1996 Athletics Eric Chavez 3B 37.4  11.31 2.04


Well, this is quite a nice group of players. A-Rod is the WAR leader of our sample. Even as a first pick, which on average has yielded the highest WAR, he manages to be three standards deviations above the mean. Five other players are active and two of them (Greinke and Kershaw) still are among the best starting pitchers in the game. They will continue to cement their position as great draft picks for the Royals and Dodgers. Interestingly enough, Barry Zito and Eric Chavez were part of the A’s Moneyball team that frequently over-performed a few years ago — a reminder of how important it is to build a strong core of players.

As a bonus question – these are the top 10 picks, according to this methodology:

Year OvPck Tm Player Pos WAR Drafted Out of OvPck – Zscore
2002 44 Reds Joey Votto C 42.7 Richview Collegiate Institute (Toronto ON) 3.74
2007 34 Reds Todd Frazier 3B 16.8 Rutgers the State University of New Jersey (New Brunswick NJ) 3.71
1997 70 Rockies Aaron Cook RHP 15.9 Hamilton HS (Hamilton OH) 3.71
1995 69 Pirates Bronson Arroyo RHP 26.5 Hernando HS (Brooksville FL) 3.67
1995 53 Indians Sean Casey 1B 16.3 University of Richmond (Richmond VA) 3.67
2007 27 Tigers Rick Porcello RHP 12.2 Seton Hall Preparatory School (West Orange NJ) 3.63
2002 6 Royals Zack Greinke RHP 52.3 Apopka HS (Apopka FL) 3.63
1996 18 Rangers R.A. Dickey RHP 21.1 University of Tennessee (Knoxville TN) 3.61
1997 91 Royals Jeremy Affeldt LHP 10.5 Northwest Christian HS (Spokane WA) 3.61
1995 31 Angels Jarrod Washburn LHP 28.5 University of Wisconsin at Oshkosh (Oshkosh WI) 3.60
1998 33 Expos Brad Wilkerson OF 11 University of Florida (Gainesville FL) 3.60
1995 49 Royals Carlos Beltran OF 68.8 Fernando Callejo HS (Manati PR) 3.59


As always, feel free to share your thoughts and comments in the section below or through our twitter account @imperfectgameb.

Note: This analysis is also featured in our emerging blog www.theimperfectgame.com


Zack Cozart Probably Won’t Keep Scorching the Ball

Last week, August Fagerstrom handed Cincinnati fans an ice-cold Gatorade after we’d spent the better part of three months wandering through the Sahara that is the 2016 Reds baseball season.

After quickly touching on the wide range of sadness, of which there is no shortage—the historically bad bullpen, the woeful luck of one Joseph Votto, and oh, the losses—he rationally pointed to a reason for optimism: “[The Reds’] two most encouraging comeback stories, Zack Cozart and Jay Bruce, just so happen to be their two most sensible trade chips.”

Of Cozart, he wrote:

He leads the Reds in WAR. He enters his final year of arbitration next season. He’s always been a gifted defensive shortstop, something every team loves to have, but this year, he’s hitting at career-best levels…He’s become more aggressive at the plate, he’s hitting way more balls in the air than he did early in his career, and he’s hitting them with authority (emphasis mine).

This last piece is what’s so interesting. Watch any Reds game this year—or just stay through the leadoff hitter! I swear, that’s all I’m asking!—and you’ll hear announcers remark that Cozart is just hitting the ball differently this year.

As shocking as it may seem given recent broadcaster rankings, they’re right.

Cozart’s 2016 hard-hit rate of 33% is very good, if not earth-shattering. It ranks seventh amongst shortstops, and league-wide places him in the company of (slightly) more celebrated offensive names like Bogaerts, Kinsler, and Beltre.

But there’s a caveat to Cozart’s great contact. The number isn’t just a career high; it’s a massive outlier, sitting 8.5% above his career average. How many other hitters this year are enjoying similar spikes? I pulled all “jumps” above six points for 2016 qualified hitters, with a minimum of four seasons to ensure a stable career average:

Name Team Age 2016 Hard Hit % Career Hard Hit % “Jump”
Jose Altuve Astros 26 34.2% 24.5% 9.7%
Daniel Murphy Nationals 31 38.2% 28.7% 9.5%
Victor Martinez Tigers 37 41.5% 32.3% 9.2%
Matt Carpenter Cardinals 30 43.6% 34.7% 8.9%
Zack Cozart Reds 30 33.0% 24.5% 8.5%
Buster Posey Giants 29 40.8% 33.1% 7.7%
Joey Votto Reds 32 44.4% 37.0% 7.4%
Curtis Granderson Mets 35 40.2% 33.1% 7.1%
Salvador Perez Royals 26 35.6% 28.5% 7.1%
Chase Utley Dodgers 37 41.9% 35.3% 6.6%
Ben Zobrist Cubs 35 36.0% 29.4% 6.6%
David Ortiz Red Sox 40 46.9% 40.3% 6.6%
Josh Donaldson Blue Jays 30 40.5% 34.0% 6.5%
Yoenis Cespedes Mets 30 39.5% 33.2% 6.3%
Evan Longoria Rays 30 40.7% 34.6% 6.1%

This list shouldn’t be too surprising. While not a perfect indicator, we know that hitting balls hard is generally better than the alternative—and these guys, with one giant, Vottoian exception, are all in the midst of stellar years by more traditional metrics. Altuve owns baseball’s third-best WAR; Murphy remains one of baseball’s best bargains; Martinez and Ortiz continue to defy Father Time to the tunes of wRC+ of 142 and 194(!), respectively. Even Votto, recovering from a BABIP 60 points below his career average, is rapidly coming around.

The group presents club evaluators, though, with a very tough question: How “real” are these spikes in hard-hit rate, and by extension the jumps in offensive performance? For Cozart, the question for the Reds front office basically translates to: How likely is he to keep the hard contact up, and how quickly should we trade him?

Let’s start with what we know about hard-hit rate. It’s generally a repeatable skill, as a FanGraphs study from last year puts hitters’ YoY correlation at 0.69. We can also say that there’s no real drop in age to adjust for; I found the r-squared correlation between age and hard-hit rate to be 0.02.

It’s not crazy, then, to think that a career-high spike in hard-hit rate could be the start of long-lasting improvement. And if it is, we should see it in the years around the spike: an increase the year before that hinted at a breakout, or retaining/coming close to the same rate in the next few seasons.

But is that the case?

I pulled all hitters with a hard-hit-rate YoY “jump” above 9% since we began tracking the stat in 2002 to see how they fared in the years immediately before and after. In this chart, “Year Before” is the hard-hit rate versus career average for the season prior to the jump, with Y+1/Y+2 representing the two years following it:

Year Name Team Age Year Before “Jump” Year Y+1 Y+2
2007 Edgar Renteria ATL 30 2.2% 12.8% -3.7% -2.4%
2007 Derek Jeter NYY 33 5.1% 12.5% 0.7% -0.6%
2007 Ryan Howard PHI 27 2.0% 12.4% 3.5% 2.8%
2007 Jimmy Rollins PHI 28 3.5% 11.5% 3.7% -1.1%
2007 Carl Crawford TB 25 -1.8% 11.4% -3.6% 3.0%
2007 Coco Crisp BOS 27 2.5% 11.4% -0.4% -1.5%
2013 Marlon Byrd NYM/PIT 35 3.6% 11.1% 6.9% 1.3%
2007 Chone Figgins LAA 29 2.1% 10.9% -1.9% -0.5%
2007 Mark Teixiera TEX/ATL 27 -1.8% 10.7% 3.5% 1.0%
2009 Carlos Pena TB 31 -0.3% 10.3% 1.6% 6.4%
2007 Aaron Rowand PHI 29 -2.0% 9.7% -0.7% -2.5%
2010 Nick Swisher NYY 29 -0.8% 9.6% -3.4% 1.4%
2007 Michael Young TEX 30 0.4% 9.5% 0.2% 4.0%
2009 Raul Ibanez PHI 37 2.1% 9.5% 4.4% -4.0%
2007 Grady Sizemore CLE 24 0.5% 9.3% 1.4% -1.5%
2007 Ichiro Suzuki SEA 33 2.4% 9.2% 0.5% -1.4%

If you’re looking for a pattern, don’t bother: none really exist, aside from the observation that 2007 was, apparently, The Year of Hitting Baseballs Hard (a poorly anticipated sequel to The Year of Living Dangerously).

The “Jump” years make up a few of the better hitting seasons in modern history: Jimmy Rollins’ MVP campaign of 2007, Teixiera’s famous Rangers/Braves split season in which he posted a wRC+ of 146, even a Raul Ibanez “I’m Not Dead Yet” season with Philadelphia at age 37.

More importantly, though, surrounding these seasons on either side is case after case of regression—and not even particularly close regression at that. There doesn’t seem to be any ability to carry over a hard-hit-rate jump into the next year or beyond.

These seasons aren’t necessarily the same as those supported by BABIP-fueled mirages…but they are propped up by a contact rate that just doesn’t seem to hold up in any type of long run. It’s something that makes sense on an intuitive level: no one, even someone as skilled as a big-league hitter, wakes up and says, “Oh, yeah—that’s how I can hit the ball hard from now on,” then keeps it up for the rest of their career.

A 162-game baseball season may seem long, but it’s subject to many forms of chance, including the odds that some years you’ll strike the ball harder than others. For the purposes of evaluating our 2016 list, it’s info that is more “useful” than immediately actionable: every player on the list except Cozart is signed through at least 2018, while Ortiz, in a Breaking Bad-level identity switch, will hang up his spikes to try his skills as a masseur in Minneapolis.

But it’s a worthy piece of evidence that our protagonist will spend next year likely reverting to average or even worse at the plate—and that the Reds, by extension, should pursue every possible trading avenue for Cozart this summer while the hitting is hard.


Chris Sale’s Rarest of Mistakes

Chris Sale is unusually skilled at throwing a baseball left-handed. This process is not generally viewed as aesthetically pleasing, but it is generally effective. It is particularly so against left-handed hitters. This effectiveness is why anything else is noteworthy, and thus why you are reading an article about Sale giving up his first home run to a left-handed hitter since 2012, and then his second such home run three innings later. Oh, right: Eric Hosmer hit two home runs off of Chris Sale Friday night, which is two more homers from the left side than Sale has given up over more than three seasons.

Chris Sale has been phenomenal against left-handed batters well beyond the fun fact of “no home runs allowed since 2012.” In his career he had allowed three total homers by lefties prior to Friday, with a triple slash of .202/.261/.263, all while playing half his games in the bandbox that is US Cellular. This dominance has not gone unnoticed by the rest of the league, and he has become justifiably feared by left-handed hitters and all-handed managers. During his 104 start, 712 inning homer-less streak, he has only faced left-handed hitters 18% of the time, despite batters hitting from the left batter’s box account over 40% of all plate appearances. Only the best face Sale. For perspective, Clayton Kershaw has had 609 plate appearances against left-handed batters since 2013 and has allowed eight home runs. For more perspective, it only took Bartolo Colon 246 plate appearances to hit his first home run.

For his part, Eric Hosmer was not a particularly likely player to end Sale’s streak, let alone to do so in this fashion. He has not yet had a 20-home-run season, and he has now matched his career-high season home-run total against left-handed pitching with five. He went into Friday with three career multi-home run games. If you care about this sort of thing, Hosmer’s numbers against Sale before then were relatively impressive in a small sample: .333/.351/.361 over 37 plate appearances. He is now tied with teammate Alex Gordon for most hits against Sale by a left-handed batter.

Now that we have established why Hosmer’s two home runs off Sale were unlikely to happen, we should look into the homers themselves. But before we get into the actual at bats, here is a plot of Sale’s pitches vs. Hosmer. I do not believe it hard to guess which cluster contains the two big mistakes.

Sale v Hosmer 6/10/16

The first at-bat came in the first inning, with two out and nobody on. Sale started with a fastball off the plate away, then a slider more off the plate away. Down 2-0, this happened:

https://gfycat.com/DecisiveInsecureAfricanparadiseflycatcher

With a low and away target, Sale left a fastball high and over the heart of the plate. Hosmer crushed it the other way.

Hosmer’s second at-bat led off the fourth inning. Sale started Hosmer with another fastball, equally over the middle of the plate and about four inches higher than the one that went out to left three innings earlier. The target was again low and away. The second pitch was a slider off the plate away, taken for a ball. Third, a slider inside and at the knees that went foul. Fourth, a fastball off the plate inside that Hosmer deflected just enough to hit into his own leg. With the count 1-2, this:

https://gfycat.com/LavishWelloffCapeghostfrog

With a low and away target, Sale left a slider high and over the heart of the plate. Hosmer crushed it the other way. Sound familiar?

Hosmer did have a third at-bat against Sale in the fifth inning, and it progressed much as Sale’s interactions with lefties usually do. Called strike one on a low-ish slider, swing through a low slider, then weak contact on a changeup low and in off the plate. Three pitches, all strikes, and a routine groundout.

Contrary to the past three years of evidence, Chris Sale is not immune to left-handed slugging. Specifically, he cannot groove a fastball in a hitter’s count nor hang a slider in any count without expecting that bad results might occur. Eric Hosmer is good enough to punish those sorts of mistakes, and he proved it. He should get credit for that. But the last place a pitcher wants to miss is high and over the plate, and Chris Sale did that twice to the same hitter in the same game. These are certainly not the only such mistakes Sale has made against a left-handed hitter since 2012, but they are certainly the first two to be punished fully. It could be a while before we see the next two.


Tyler Naquin’s Blossoming Power

Recently the Cleveland Indians were able to salvage their four-game series against the Seattle Mariners with a 5-3 victory, thanks to Tyler Naquin. In the top of the 8th inning with teammate Rajai Davis on first base, Naquin again found himself in an 0-2 count. Once again, it seemed that the rookie would strike out…especially because he was facing an excellent reliever in Joaquin Benoit. Going into the game, Benoit found himself with a respectable 3.27 ERA, 1.09 WHIP, and a BAA of just .154. But when Naquin came to the plate all of that was about to change. On an 0-2 pitch, Benoit threw Naquin a changeup down and in that he promptly golfed into the stands of Safeco Field giving the Tribe a 4-2 lead in the late innings. This advantage would end up sticking for the Tribe as they went on to split the four-game series and remain in first place in the AL Central.

Naquin is no stranger to hitting homers in the big leagues. In fact, at the time that was his fourth homer in his last six games. Before his most recent recall on June 1st, Naquin hadn’t yet hit one out of the park in the bigs. But now it appears that he has found his power stroke, and his team couldn’t be happier. Naquin always had a great swing; even looking back on his days at Texas A&M, that was more than apparent (he won two Big-12 batting titles). It appears now that he’s beginning to develop power. In the minors, Naquin managed just 22 homers in his 1542 plate appearances, a modest 70.1 PA/HR. In his short time in the majors this number has dropped significantly down to 22.3 PA/HR. In other words, around 27 HR in a 600 plate appearances. The power that he’s shown thus far has been quite impressive, and there’s a chance that it’s sustainable.

Naquin has shown the ability, throughout his minor and now major-league career, to possess a great swing with the ability to make good, solid contact which has translated well to this point. Naquin has a 41% hard-hit rate. Qualified players who have a hard-hit rate above 39% this season include the following list:

 # Player Team  PA  Hard%  HR  OPS  wRC+ wOBA
1 David Ortiz Red Sox 226 47.2 % 16 1.153 200 .470
2 Joey Votto Reds 248 43.5 % 11 .793 108 .338
3 Matt Carpenter Cardinals 255 43.2 % 9 .936 150 .394
4 Chris Carter Brewers 241 43.0 % 16 .803 105 .334
5 Trevor Story Rockies 258 43.0 % 16 .866 111 .362
6 Mike Napoli Indians 232 42.9 % 14 .799 115 .340
7 Chase Utley Dodgers 222 42.8 % 4 .748 110 .330
8 Michael Conforto Mets 211 42.8 % 9 .778 111 .330
9 Miguel Sano Twins 211 42.7 % 11 .799 116 .344
10 Yasmany Tomas Diamondbacks 208 41.1 % 7 .755 97 .324
11 Josh Donaldson Blue Jays 265 40.9 % 14 .890 139 .378
12 Victor Martinez Tigers 224 40.9 % 9 .925 149 .391
13 Khris Davis Athletics 215 40.8 % 14 .753 100 .316
14 Evan Longoria Rays 250 40.8 % 14 .865 134 .363
15 Curtis Granderson Mets 248 40.8 % 11 .742 102 .317
16 Buster Posey Giants 212 40.5 % 8 .766 108 .323
17 Giancarlo Stanton Marlins 214 40.4 % 12 .731 95 .315
18 Adam Duvall Reds 205 40.3 % 17 .902 135 .377
19 Jake Lamb Diamondbacks 225 40.3 % 11 .867 127 .368
20 Mike Trout Angels 263 39.8 % 13 .963 164 .405
21 Kris Bryant Cubs 257 39.8 % 14 .886 139 .380
22 Chris Davis Orioles 250 39.7 % 13 .795 114 .343
23 Corey Seager Dodgers 258 39.6 % 14 .869 135 .368
24 Mark Trumbo Orioles 251 39.0 % 20 .956 155 .403
25 Byung-ho Park Twins 201 39.0 % 11 .777 109 .334
26 Manny Machado Orioles 264 39.0 % 15 .968 155 .402

From the chart, 20 of the 26 players listed are in double digits in homers. If you take their ratio of HR/PA and multiply by 600 you find that they range anywhere from 27 HR to 48 HR potential. There’s no guarantee that any of these power hitters will keep their current pace, but one thing’s for sure, players who have a relatively high hard-hit rate are more likely to hit home runs and extra-base hits, and ultimately are more likely be more productive for their team. If we go back even further now, say the last three seasons (2013-2015), we get the following group:


# Name Team PA Hard% HR OPS wRC+ wOBA
1 Miguel Cabrera Tigers 1848 43.7 % 87 .981 168 .417
2 David Ortiz Red Sox 1816 43.7 % 102 .915 141 .382
3 Paul Goldschmidt Diamondbacks 1884 42.2 % 88 .968 159 .408
4 Giancarlo Stanton Marlins 1460 41.9 % 88 .915 150 .389
5 J.D. Martinez – – – 1447 40.9 % 68 .840 129 .359
6 Lucas Duda Mets 1534 40.6 % 72 .817 131 .355
7 Matt Kemp – – – 1537 40.0 % 54 .786 120 .341
8 Andrew McCutchen Pirates 2007 39.9 % 69 .917 157 .395
9 Chris Davis Orioles 1868 39.9 % 126 .891 140 .378
10 Jarrod Saltalamacchia – – – 1132 39.5 % 34 .746 104 .327
11 Pedro Alvarez Pirates 1550 39.1 % 81 .760 110 .327
12 Mike Trout Angels 2103 39.0 % 104 .973 172 .413

The chart says it all: the average HR% (HR/PA) of this group is 4.8%, or in other words about 29 HR per 600 PA. The average OPS of this group is an impressive .876, and even more impressive the average wOBA is .374. If Naquin can continue to make solid contact in his plate appearances, as he has proven throughout his career, he could be a very special player.

In the case of Tyler Naquin, he has: 99 PA, 41 Hard%, 4 HR, .870 OPS, 136 wRC+, and a .371 wOBA. His numbers correlate quite well to the rest of the group; in fact, his OPS, wRC+, and wOBA are all above or around the average in comparison. Obviously this is kind of a small sample size for Naquin. It’s nearly impossible to tell what kind of player Naquin will become with less than 100 major-league plate appearances, but there is definitely hope.


Elvis Andrus Is Trying to Become a Power Hitter

In his seven-plus seasons as a major-leaguer, Elvis Andrus has never been considered an offensive dynamo. And for good reason! Over nearly 5,000 plate appearances, Andrus owns an 83 wRC+ and measly .079 ISO. However, even a defensive-minded shortstop can change the game with one swing of the bat. While not an overly impressive blast, it exposes something different in his approach at the plate. Early in his career, Rangers fans and followers held out hope that Andrus could develop into a 15-20 homer a year guy. While that may feel like a lost cause, Andrus has recently displayed some newfound power. Last season, Andrus smacked a career-high seven home runs and tied his career-high with 43 extra-base hits. So far this season, he is on track for a career-high ISO and running a near league-average offensive line. Andrus’ Speed Score sits right at his career average, hence it does not appear he has bulked up significantly and traded in speed for power. Rather, he has altered his approach at the plate.

This current approach began last season, and to this point has continued over into his 2016 campaign. From his rookie season in 2009 to 2014, Andrus ran a 57.4 GB% and a 21.3 FB%. This past season and a third, those metrics have shifted to 46.5% and 31.1%, respectively. In context, Andrus has gone from the 2nd percentile in FB% to the 30th percentile. While no one will ever confuse him for Chris Carter, Andrus’ new batted-ball profile closely resembles that of in-state slugger George Springer. Perhaps even more indicative, Andrus has raised his Pull% from 33.9% over 2009-2014 to 43.6% since 2015; this represents a shift from the 12th percentile to the 81st percentile, placing him just ahead of renowned slugger Anthony Rizzo. Seeing as 27 of his 29 career home runs have landed to the left of center field, this seems a logical shift for a man in search of dingers.

Plate-discipline measures further reveal Andrus’ altered approach. Andrus has raised his O-Swing% from 21.8 to 25.8 in addition to raising his Z-Swing% from 53.3 to 61.2 over our familiar timeframes. In avoiding Simpson’s Paradox, these changes have increased his overall Swing% from 38.5 to 42.8. While still not a free swinger by any regards, Andrus’ new approach remarkably resembles fellow A.L. West shortstop Marcus Semien, albeit with superior contact rates. Known for providing impressive power from the six spot on the diamond, one could well view Semien as the ceiling of Andrus’ power dreams. Meanwhile, Andrus has held his contact rates largely steady, dispelling the notion that he has traded contact for power. Interestingly, his Zone% has steadily dropped since his rookie season but has held near 51% each of the past three full seasons. So far in 2016, that number has dropped further to 49%, so perhaps opposing pitchers have finally altered their approach in response. However, too little time has passed to determine whether this is by choice or simply small-sample variation. Indeed, Andrus will need to prove that these adjustments make him a “power” hitter before pitchers treat him differently.

That ultimately remains the question. Andrus has ostensibly made adjustments to improve his power, but do they truly make him a better overall hitter? To this point in the season, Andrus ranks 158th in average exit velocity on fly balls and 147th in average fly-ball distance among the 167 batters with 25 or more fly balls hit. Andrus pulling more fly-ball outs to left field doesn’t enhance his offensive output. However, if more of these balls turn into gap shots and home runs, Andrus could uncover another level to his game. With Jurickson Profar returning from the baseball grave in remarkable fashion and Rougned Odor forever cementing his place in Rangers lore, Andrus may be feeling the pressure to live up to his now ill-regarded contract extension. After three below-80-wRC+ seasons, something needed to change for Andrus at the plate. Whether this new approach works for the better remains to be seen, but right now Andrus remains a key cog on a surprising postseason contender.