Archive for Player Analysis

Kevin Pillar Doesn’t Swing and Miss Enough

Although strikeouts are at an all-time high, Kevin Pillar has continued to make consistent contact. Pillar’s swinging-strike rate is 8.0%, the 115th highest mark out of 158 qualified major-league hitters. What makes Pillar interesting, however, is that he is near the top of the O-Swing% list (the percent of pitches outside the zone that a batter swings at), where he ranks 15th in the majors with a mark of 38.1%. A low swinging-strike rate and high O-Swing% is an odd combination to have; it means that Pillar is making more contact than most, despite swinging at more would-be balls than most. It also means that he’s putting in play a lot of bad pitches to hit. Although some hitters are notoriously good at hitting pitches out of the zone (Vladimir Guerrero and Pablo Sandoval come to mind), Kevin Pillar is not, and it’s leading to a lot of weak contact for him.

Pillar’s 27.9 Hard% ranks 141st in the majors. His 21.9 Soft% ranks as the 20th highest. Here are Pillar’s average exit velocity, wOBA, and expected wOBA on balls in play, split into pitches in the zone and out of the zone (courtesy of Baseball Savant):

In Zone Out of Zone
Exit Velocity 87.6 78.3
wOBA 0.351 0.223
xwOBA 0.367 0.221


Clearly, Pillar’s weak contact is mostly coming on pitches out of the zone. I used Brooks Baseball’s zone charts to figure out exactly what pitches Pillar is chasing and hitting weakly. The main culprits appear to be fastballs in off the plate and fastballs above the zone.  He swings at these pitches 46.6% of the time and whiffs with only 11.5% of his swings. Here you can see how often he swings at fastballs in each location; here you can see how often he whiffs at them.

According to Baseball Savant, he has an average exit velocity of 73.1 mph, a .224 wOBA, and a .223 xwOBA on fastballs that are in, up, or both. For comparison, on all fastballs, he has an average exit velocity of 85.4 mph, a .302 wOBA, and a .332 xwOBA. Pillar is not only chasing fastballs out of the zone, but he’s putting them in play with regularity. This would not be a problem if he was squaring these balls up, but he’s actually one of the worst hitters in the majors when he puts these pitches in play. Out of the 135 right-handed hitters who have put at least 25 fastballs up and/or in in play, Kevin Pillar ranks 126th in xwOBA. Meanwhile, only 15 other hitters have put more of these pitches in play.

Pillar’s biggest issue is his pitch selection. He not only swings at a lot of pitches out of the zone, but he swings at pitches that he is especially bad at hitting. However, his ability to make contact on these pitches also seems to be hurting him. Most hitters that chase pitches out of the zone as often as Pillar swing and miss much more often than Pillar does. So when they swing at a pitch out of the zone, it often only costs them a strike. Because Pillar tends to put these pitches in play with weak contact, it generally costs him an out. In fact, this is one of the reasons why we’re seeing so many hitters swing out of their shoes. Of course, part of the reason is a new emphasis on power and the belief that a strikeout is no worse than any other kind of out. But another reason is that with fewer than two strikes, swinging and missing is preferable to putting the ball in play weakly and making an out. Hitters certainly don’t come up to bat trying to swing and miss, but with fewer than two strikes, they would much rather swing and miss than make an out.

Now, I am not suggesting that Kevin Pillar should swing harder. Swinging harder would also lead to more swings and misses on pitches in the zone, which he currently hits very well. The best thing Pillar could do is lower his chase rate, as this would improve the quality of contact he makes while also putting him in more hitter-friendly counts. Of course, this is much easier said than done. While I am not going to try to predict the hitter that Pillar would be if he swung and missed more often — and I definitely won’t try to argue that he should try to miss when he swings — we can at least learn from Pillar that although contact is a good skill to have, it is not very useful without good pitch selection.


Rafael Devers: Boston’s Rising Star

The Red Sox’s third-base problem was not solved by a veteran rental. No, it was solved by a sweet-hitting 20-year-old Dominican named Rafael Devers.

But before I explain Devers’ spectacular rise, I must set the stage for his entrance.

~~July 24th~~

It’s July 24th and the Red Sox have ground to a halt. Baseball’s non-waiver trade deadline is just eight days away and nearly the entire baseball community expects the Sox to trade for Todd Frazier.

Frazier, the third baseman for the White Sox, is in the midst of the worst season of his career. He’s hitting just .210 and his contract expires at the end of the year.

The Red Sox haven’t been able to gain traction since the All-Star break, going just 5-6. The Yankees, their ever-present rivals, are creeping up on them in the standings and have swooped in on a trade for Todd Frazier, even though many executives and analysts were sure the slugger would join the Red Sox.

Third base has been a huge issue for Boston, who has used eight (!) different players there. Collectively, Red Sox third basemen are slashing .227/.280/.320, marks that rank 27th, 29th, and 30th in the league, respectively. They have not only been terrible hitters, but they also lead the league in errors.

Dave Dombrowski decides to rectify the Red Sox’ third base issue by promoting top prospect Rafael Devers to the big leagues.

~~A Rafael Devers Profile~~

Rafael Devers was born on October 24th, 1996 in Sanchez, an aging port city in the Dominican Republic. He first started playing baseball at the age of five, inspired by his father, who played amateur ball. Devers grew up with baseball all around him and quickly showed immense talent.

In 2013, Devers signed with the Red Sox at just 17 years old. He was ranked as the number three international prospect in his class, and he signed with the Red Sox, his childhood favorite team, for $1.5 million. Devers entered the Red Sox organization as their 20th ranked prospect in a deep farm system.

Upon joining the Red Sox, Devers was placed in the Dominican Summer League (DSL), a place where new international signings go to work on their skills. Devers took the DSL by storm, batting .337/.445/.538 with three home runs in 28 games. He impressed everyone, by his ability to hit for both average and power, and also by his great batting eye — Devers walked more times than he struck out.

After tearing up the Dominican League, Devers was sent to the States, where he played in the Gulf Coast League. The Gulf Coast League, or GCL, is where first-year minor-league players are sent after being drafted or signed by their teams. Most of the players in the GCL have been drafted out of college or have just finished high school, meaning that at age 17, Devers was one of the youngest players in the league. Devers carved up the GCL, batting .312 with 11 doubles and four homers in 42 games.

After Devers’ wildly successful first year, he was rated as the Red Sox’ sixth-best prospect, and baseball’s 99th-best, all at just 18 years old. This was an incredible accomplishment, as Devers was the youngest player on Baseball America’s top-100 list that year.

In 2015, Devers was promoted to the Red Sox’ Low-A affiliate, the Greenville Drive, where he experienced full-season ball for the first time. There, he was matched up against much older opponents, being one of just seven position players under the age of 19 in the South Atlantic League. Devers played well in Greenville too, batting .288 with 38 doubles and 11 home runs in 115 games. During the 2015 season, Devers was selected to the Futures Game, an event during All-Star weekend that showcases baseball’s best young talent. After a season in Low-A, Devers was ranked as Boston’s second-best prospect, and baseball’s 18th-best. Devers jumped 81 spots on Baseball America’s top-100 in just one year, a remarkable achievement.

In 2016, Devers was promoted to the Red Sox’ High-A affiliate, the Salem Red Sox, at the age of 19. However, Devers hit a bump in the road in Salem. Among players much older than him, it appeared that Devers had finally met his match. In the first half of the season, he scuffled to a .233/.300/.305 line with just four home runs in 63 games.

However, Devers bounced back brilliantly after the All-Star break. He slashed an incredible .326/.367/.539, with seven home runs and 11 steals in 64 games. After this second-half breakout, Devers has not looked back in his meteoric rise to the majors.

In 2016, Devers’ defense finally started to catch up with his offense. Early on in his career, scouts considered moving him to first base, because of his heavy build. But Devers has worked hard on his defense, and has stayed at the hot corner. In High-A, Devers led all Carolina league third basemen in fielding percentage (.960), putouts (104), and assists (258).

After his outstanding second half in High-A, Devers earned a non-roster invitation to 2017 spring training with the Red Sox. This was a big step up for the 20-year-old Devers, but he wasn’t ready for it, batting 3 for 22 against big-league competition. Nevertheless, he earned a promotion to Double-A Portland, where he played for most of this year.

Devers was the Portland Red Sox’ standout player this year, socking 18 homers in addition to achieving an excellent .296/.366/.571 slash line. In 77 games, Devers jumped to number six in Baseball America’s most recent prospect rankings. He was also selected to participate in the MLB Futures Game for the second time.

Devers was promoted to Triple-A on July 14th, and continued to hit for both average and power while in Pawtucket. Devers became the third-youngest player ever to be promoted by the Red Sox to Triple-A, yet another reminder that he was playing extremely well for his age. The Dominican lefty hit an astounding .400 for the Pawtucket Red Sox, and he earned a promotion to the big leagues after just nine games in Triple-A.

When Devers debuted on July 25th, he was the youngest player in the major leagues, but you’d never know it. His first major-league hit was a home run (!), and during his 16 career major-league games, Devers has surprised everyone.

Scouting report

Devers has a very promising future, thanks to his ability to hit for both average and power. He has incredible raw power, and can spray the ball to all fields. His opposite-field power is unsurpassed among players his age. For example, when Devers hit two homers against the Indians on August 14th; one was a laser into the Green Monster seats in left field, and the other was a high drive into the Red Sox bullpen in right field.

Devers also has great bat speed, and he is able to hit pitches very far, and to any part of the field. On August 13th, Devers hit a 102.8 mph pitch into the Yankees bullpen, the fastest pitch ever hit for a home run in the pitch-tracking era.

Devers is not as polished as other recent Red Sox prospects like Andrew Benintendi, but he has a higher ceiling. I project that in his prime years he will hit around .285 with 30 home runs, 40 doubles, and five to ten stolen bases.

He has improved his defensive skills, but don’t expect him to be a Gold Glove-winning third baseman. I believe he will stay at the hot corner, as he is becoming more reliable and is improving his range. Overall, Devers projects to be an All-Star with a dependable glove and a reliable, middle-of-the-order bat.

Conclusion

As of August 15th, Devers is hitting .339 with six home runs, incredible statistics that show his ability is way beyond his years. I don’t mean to read too closely into Devers’ 62 career at-bats, but he has a very promising future.

Pairing Devers with other young Red Sox stars like Mookie Betts, Jackie Bradley jr. and Xander Bogaerts should help Boston stay at the top of the AL East for years. Devers gives Boston an entirely homegrown lineup, the dream of every major-league team.


Special thanks to Baseball Reference, Baseball America, and milb.com for the statistics I used in this post.

I would also like to thank NESN.com, the New Haven Register, and SB Nation’s Minor League Ball blog.

Prospect rankings are from Baseball America

Fenway Park Photo Credit: User: (WT-shared) Jtesla16 at wts wikivoyage [CC BY-SA 1.0 (http://creativecommons.org/licenses/by-sa/1.0)], via Wikimedia Commons


Gallo’s Season Is Unique and Unrepeatable

At this point, we all know Joey Gallo. We know what he can and what he can’t do on a baseball field. We know his tendencies. We know his unidimensional approach to hitting. In short, we know Gallo is one of a kind and the true definition of an outlier, if anything. Drafted by the Texas Rangers in 2012, he’s been part of the Major League roster during various stints of the past three seasons, having played in just 157 games (as of August 13) since he made his debut, yet it feels like he’s been around forever probably given his uniqueness.

Gallo’s finally found a place in the Rangers’ lineup during this season. Playing most of games at third base thanks to an Adrian Beltre injury that kept him out of action for the first weeks of the season, then moving to first base and currently splitting time between the latter and the left outfield position, Joey is an irreplaceable piece of Texas’s roster at this point. He’s the second-most valuable player of the team by means of bWAR at 2.8, only trailing Elvis Andrus (3.4), while having stepped to the plate 108 fewer times, and all of this at just 23 years of age.

Anything of what has been introduced already may sound interesting and paint a good picture of a prospect, which – still – Gallo is. But it is looking at his numbers for the season when we truly find a gem of a player, or at least a unique one given his performance and how he’s achieving it. To the point, actually, that we can consider Joey Gallo’s 2017 season an unrepeatable one in the past, present and (maybe) the future of baseball. We have always had great players putting huge margins in different statistics between them and the field, but we have yet to see anyone accrue the overall stat line Gallo is putting together as a whole.

In order to try and find comparables to Joey’s season, I used batting data from 2002 to 2017, extracted from FanGraphs’ leaderboards. The timespan was selected due to batted-ball data being available at the site from the 2002 season on, giving us a finer grain of detail at the players and their batting profiles during the selected seasons. Just to kick things off, we can introduce Gallo as a not-so-good hitter by looking at his PA/H ratio, which ranks as the 11th worst (5.5 PAs per hit) among the 2413 player seasons contained in the subset. Basically, Gallo suffers to get a hit every time he goes to the plate, and not by little (the average PA/H sits at 4.1). What starts to make things interesting is that of the 11 worst PA/H hitters, Joey Gallo is the only one with more HR than 1B/2B/3B, with home runs making up 47.4% of his hits (the next guy of those 11 is 2012 Adam Dunn with a 37.2% percentage).

We already know Gallo struggles to get hits. We know that most of his hits – almost half of them – end up being home runs. But, has Joey Gallo been just unlucky when making contact with the ball? It doesn’t look like it. There have only been five players with a K% of 35%+ in the past 15 seasons. Joey Gallo leads the pack at 37.8%, followed by 2013 Chris Carter and 2017 Trevor Story (both at 36.2%), 2017 Miguel Sano (35.6%) and 2010 Mark Reynolds (35.4%). Sadly for Gallo, his BB/K ratio doesn’t look like anything great at 0.34, so he comes out pretty much as a hit-or-miss guy.

His BABIP sits at .238 right now (26th-lowest among 2413 player seasons) and combined with his power and the percentage of his hits that go over the fences, that’s pretty low production when his hit balls don’t go the distance. The good thing for Gallo, again, is that he barely hits grounders, nor even liners. His GB/FB ratio is 0.43, trailing only a couple of Frank Thomas (who was like a monster truck turned into a mountain turned into a human being) seasons when he put up values of 0.42 (2006) and 0.40 (2002) GB/FB. That may lead you to think that we have seen other players like Gallo during the history of the sport, and indeed we have if looking at isolated statistics. But what if we add the percentages of line drives, ground balls and fly balls into the equation, plus a couple more metrics?

Gallo’s hitting profile just hasn’t existed prior to this season and will probably never be replicated. It is weird. It is unique. It is just in its own universe. Not only does Joey posess the lowest LD% of the past 15 years; he also has some of the lowest marks in GB% and IFFB% at the same time, while posting the highest FB% and – by far – HR/FB ratio of that timespan. No one has ever reached a 30%+ HR/FB ratio while maintaining a FB% of batted balls over 44% except Gallo. That’s something insane, at the minimum. Just in case there was any doubt left about what hitting profile Gallo represents best, I think he is a clear go-big-or-go-home advocate.

So Joey Gallo is a strikeout machine, that’s taken for granted. But he makes up for it with an otherworldly approach to hitting and some power not seen to this point in time, even after more than a hundred seasons of baseball have been played. As of August 13, Gallo ranks 26th in Baseball-Reference.com’s oWAR/PA among players with at least 350 PA, and while he’s nothing out of this world in terms of defensive production, his offensive performances have been vital for the Rangers. Added to his ridiculous age, he’s one of the most promising and offensive-minded players in baseball, and one that truly stands out from the field of players that can be seen each day at the majors’ ballparks.

It all comes down to a simple two-option question with Gallo. You either hate him or love him. But most of all and on top of that, what we should do is appreciate it, because we have not seen and will probably never see something quite like what he’s doing any time soon.


Is It Too Soon to Start the Willson-Mania?

A little more than 36 years ago, a pitcher by the name of Fernando Valenzuela, from Mexico, completed his first game with the Los Angeles Dodgers. Up to that point he had pitched 17.2 innings in 10 games, all of them during the 1980 season, giving up 10 hits, no earned runs nor homers, and accruing 16 strikeouts. But it was in 1981 when Valuenzuela would see his first start against Houston in a game that ended being a five-hit shutout for the Mexican, starting what became to be known as “Fernandomania.”

Fast-forward to 2016 and turn your eyes to Chicago. The Cubs had a season for the ages and won the World Series after one of the largest droughts you could imagine. At the catcher position, three players: Miguel Montero, David Ross and Willson Contreras. Montero and Ross ate virtually all of the games from the start of the seasons up to mid-June, the moment Contreras made his first major-league appearance for the Cubs after being acquired by the club in 2009 as an amateur free agent. Since he started his first game on June 20 against the St. Louis Cardinals, he became the go-to catcher for Chicago and established himself as the next big thing at the plate, given the expected retirement of Ross and the unexpected words of wisdom by Montero earlier this season that would end with him out of the clubhouse.

But let’s not get lost in the context of this story, and focus on our guy, Willson Contreras. The Venezuelan had a great stint in 2016, posting a more than respectable .282/.357/.488 slash line with a slightly high BABIP of .339. He walked and struck out above average, but was able to get up to 12 home runs to make up for it, while reaching a 126 wRC+. Definitely not a bad start of a career. The thing is, Contreras is having an even better second season with the Cubs in 2017, and the Willson-mania is starting to get – or should be getting – traction, with the catcher being named the National Player of the Week in early August.

Projection models expected Contreras to keep his pace during this campaign in most of the statistics, and none forecast a huge jump in his numbers from last year to this one. It could even be said that a little, even by a hair, regression was actually expected after what he did in 2016. The problem these projections are facing today is the same as always: Willson is killing them and outpacing the expected numbers they proposed when calculated over spring. Just for starters, and looking at FanGraphs’ Depth Charts projection system, it fixed Contreras at an expected 117 games, played with 490 plate appearances. As of August 10, he has already played 101 games and appeared 374 times at the plate. Yes, he’s been given the reins of Chicago’s catcher slot and his knees and holding out.

To paint a clearer picture of how Willson’s season is going in relation with what was expected from him, here is a simple fancy table.

Projection systems were right in that regression will make a living out of Contreras this season, not that it wasn’t to be expected, though. His AVG and OBP, along with his BABIP, have decreased to more average-ish values, true. But there are numbers that call for a great progression in the catcher’s game. He’s almost already doubled his home-run production from 2016, and will have a chance to even double his DC projection from now to the end of the season. He’s been able to accumulate 0.9 more points in WAR, and his wRC+ has lowered but is still on point, much higher than projections put it at at the start of the campaign, when they saw Willson as an slightly better than average hitter at best.

Moving onto other metrics not included in the table above and to put his improvement in context, what he’s doing this season — he’s doing it with a WPA/LI of 1.35 instead of the 0.6 he had in 2016 (this is, he’s producing more on toughest situations while giving his team more chances of winning games). Moreover, his Clutch value is 0.72 (1.6 points over his past season’s minus-0.88), midway between what we could consider an above average-to-great clutch player.

His batted-ball statistics are also worth looking at. In order to do it, I combined the data from 2016 and this season as of August 10. Here are the top ten players in terms of HR/FB over this period of time.

Contreras is a ground-ball hitter. There is nothing to discuss about that, and that is something he may want to change in order to improve his production on the long run. Of the ten players included in the table above, he has the third-highest GB/FB value at 1.79, the highest GB% at 53.4% and the second-lowest LD% at 16.8%. What is helping him, though, is his high HR/FB ratio, which is making is deep and high batted balls go over the fence over one quarter of the times he hits them. It is also interesting to see how his BABIP is still at a good .325 while having such a high ground-ball percentage and putting up hits to the infield 11.4% of the time.

All in all, Contreras is the third-best Cub by wRC+ this season, only behind Kris Bryant and Anthony Rizzo, while having considerably fewer plate appearances than those two. Chicago seems to have found a potential gem in their system after eight years of waiting, and the catcher position sure seems covered at Windy City. If only Contreras could hone the little things that may be holding his production back a hair, we would definitely experience the Willson-mania on full swing.


Jimmy Nelson as James Paxton

It would appear that James Paxton is finally getting credit for the body of work he’s produced over the past two years. Jeff Sullivan wrote about this very topic last week, pointing to several metrics that support his claim that James Paxton is one of the best pitchers in baseball. I won’t rewrite his points here; instead, I will show you the many similarities between James Paxton and a relatively unknown pitcher outside Brewers nation, Jimmy Nelson. I don’t mean to imply Nelson is equally as good as Paxton, but I hope by the end of this article there will be a greater acknowledgement of what this pitcher has done this year.

Armed with a fastball that averages 96 mph, a darting 90 mph cutter, and a tight 81 mph knuckle curve, James Paxton is able to generate plenty of swings and misses and weak contact. His 28.8 K%, 7.0 BB%, 46.5 GB%, 5.6 HR/FB% in 2017 has led to a sparkling 2.70 ERA and 2.31 FIP. His 4.2 WAR would rank fifth-best in the MLB among pitchers if he had enough innings to qualify. While Jimmy Nelson doesn’t quite have the stuff of Paxton, his repertoire might sound familiar: a 94.5 mph fastball/sinker, a 89 mph cutter, and a 81 mph knuckle curve. His 27.3 K%, 5.9 BB%, 50.9 GB%, and 13.1 HR/FB% in 2017 has produced a 3.24 ERA and 3.04 FIP. His 4 WAR ranks sixth among qualifying pitchers.

The main differences in their 2017 performance in these metrics appears to be their HR/FB%. Jeff Sullivan addressed James Paxton’s ability to manage contact in his article, and there is evidence that he should be able to maintain a below-average HR/FB%. Over 399.1 innings, Paxton has a career HR/FB% of 8.1. In addition, he currently leads the majors in 2017 in xwOBA on balls in play based on launch angle and exit velocity. While it would be foolish to expect him to keep a 5.6 HR/FB%, a 8.1% might be his norm, circa Clayton Kershaw pre-2017. Despite having a well below-average xwOBA on balls in play, his career ERA is 19 points higher than his career FIP (with an even larger difference this year). I’m not sure if we can hand-wave this difference away, but we’ll accept his FIP as the more accurate measure for this analysis.

Jimmy Nelson, on the other hand, has a history of relatively loud contact. His 13.1 HR/FB% this year isn’t much different than his career 12.4%. Despite this high career rate, his xwOBA on balls in play this year is .343, good for 25th in baseball among 113 starters who have faced at least 250 batters. In addition, his average exit velocity is 85.2 mph, good for 13th-lowest among the same group. It might be that his contact management woes are coming to an end.

Perhaps 2017 will be seen as an out-of-nowhere career year for Jimmy Nelson. Perhaps 2017 will become his norm, and he’ll take his rightful place among the 10-15 best starters in baseball. Either way, he deserves more attention than he’s been given. It’d be a shame if he continues to be denied an All-Star despite producing like one (no pitcher with an equal or higher WAR missed the Midsummer Classic).

Since no posts can be complete with mere words, here’s a link to video of Jimmy Nelson’s most recent start.


Christian Yelich, Fly Balls, and a New Hope

Christian Yelich is a very good baseball player. Since becoming a full-time major leaguer in 2014, Yelich has accumulated 13.8 Wins Above Replacement, good for 35th among qualified hitters. Yelich owns a career 120 wRC+, showing he’s a fine hitter. Yet there has always been a lingering question: Can his bat be even better?

Yelich hits the ball hard. Since 2016, only 10 players have a greater average exit velocity (minimum 2500 pitches seen). More importantly, his 94.3 MPH exit velocity off of fly balls is 25th from the same group. If we add in line drives with fly balls, Yelich’s 95.7 MPH exit velocity ranks 17th, sandwiched in between Manny Machado and Yasmany Tomas. Exit velocity is only part of the story, though. His launch angle is not ideal. Despite hitting the ball more than a mile harder than sluggers such as Bryce Harper, Michael Conforto, and Anthony Rizzo, Yelich has routinely chosen a ground-ball-based approach. Since the All-Star break, we might have gotten another indication of a possible transformation. The prospects are tantalizing. Have always been tantalizing.

Last season, Yelich saw his wRC+ rise to 130, the best of his career. This was partly related to him increasing his power level, as shown by a .185 ISO, the highest of his career. No doubt like every other batter, he was aided by a mysterious force (most likely the ball), but he also had a slight approach change. Yelich hit more fly balls, and so far in 2017, he’s expanded on that. Yelich has the 35th highest (122 players) difference between his 2016 fly-ball rate and 2017 fly-ball rate (minimum 350 plate appearances in both seasons). Slowly, Yelich might just be embracing the fly-ball revolution. This is also seen in his launch angle. In 2016, Yelich’s average launch angle was 2.5 degrees. In 2017, it’s 4.9 degrees, nearly double (more on this later).

Yelich’s 15 Game Rolling GB% and FB%

Yelich seems to have committed to some sort of approach in which fly balls are more sought after. In September of last year, Yelich carried a fly-ball rate at nearly 30%. He began April hitting fly balls at a 27.2% clip, followed by 23.6% in May, and to a low 14.1% in June. He seemed to abandon the fly-ball approach as his results weren’t up to his standards. Have you ever done something you were excited about but didn’t do well that you sort of slowly stopped? I’d imagine something like that may have happened with Yelich. During the second half so far, his fly-ball rate is 32.3%! It could very well be the result of small sample size, but it could also be a sign of Yelich looking to become a better hitter. Since the All-Star break, the Marlins outfielder’s average launch angle has been 10.4 degrees. This is what we want to see. And interestingly enough:

Yelich’s 15 Game Rolling GB% and FB%

We haven’t really seen Yelich be at this power level. He’s had spikes for sure, but nothing as high as the power streak he has shown recently. It coincides with him lifting the ball more. Since the start of the second half, Yelich has a .250 ISO. To give you an idea of the type of power output, that’s pretty much what Anthony Rizzo and Miguel Sano have this season (both at .247).

This feeds into what I mentioned above with psychological factors possibly playing a role. Yelich is seeing good results; perhaps he may experiment a little more with a greater emphasis on fly balls.

As mentioned above, Yelich hits the ball hard. But he also hits it hard to all fields. This is just another example of the kind of strength that exists within Yelich and his all-fields approach making him a tough out. Being able to hit the ball to the opposite part of the park with authority is a rare skill. It’s one of the reasons why Rafael Devers is such an exciting prospect.

View post on imgur.com

Now combine that all-field power with solid zone control and you’ve got a good hitter. Then combine someone who is has a better batted-ball mix and you might just end up with a great hitter. If Yelich shows more power, which his 6’3″, 195lb figure suggests is there, Yelich will likely be given more free passes. Basically, Yelich has the tools to be that rare hitter than can hit for average and power.

Back to the launch angle which has nearly doubled — FanGraphs Andrew Perpetua recently had an intriguing article advising caution when using Launch Angle. In the article, Andrew writes, “Launch angle is largely dependent on the particular swing and approach of a given batter. If they have an uppercut, then they will produce high launch angles with their high-velocity balls. If they swing down on the ball, then they will have lower launch angles with their high-velocity balls.” Furthermore, Andrew mentions in the comments, “I think launch angle is so intimately tied with swing mechanics that you probably shouldn’t talk about it outside the context of swing mechanics.” This does make sense. Hitters need to alter their bat path to hit the ball at specific angles. Bringing it back to Yelich, we can try to see if he has altered his mechanics. Take the following with a massive grain of salt because it’s only a couple of videos, and I’m no swing expert. From the videos I’ve seen of Yelich, he seems to have a pretty smooth swing path and uses a leg kick for additional power. Here are two of his home runs this year: the first from June 2 against the Diamondbacks and the second from July 26 against the Rangers.

I don’t see a major difference. A bit of a stronger leg kick in the homer against the D’Backs.

In both of these videos, Yelich hits an opposite-field double. Against the Braves, Yelich seems to do a double leg kick. He did this in the next game as well. It’s not something that I’ve seen stick. I’d imagine it might have been due to seeing something he may not have been expecting. Either way, it must’ve been an interesting conversation between Yelich and the hitting coach.

From the limited video evidence, I can’t decipher much. Someone more experienced might want to look into it. The numbers show Yelich very well may have altered his bat path slightly.

One of the criticisms of Yelich was his lack of damage done when pulling the ball. He’s been the fourth-best hitter when going opposite field over the past three calendar years.

View post on imgur.com

On the plus side, this is another area of improvement for Yelich.

View post on imgur.com

Christian Yelich could very well remain a ground-ball-heavy hitter and be one of the better hitters in the majors. His plate approach has been lauded for many years to go along with his full-field power. If he is part of the fly-ball revolution, Yelich very well could be one of the best hitters in the game. He’s shown signs of a different approach. With the results to back it up, the rest of the season will give us a glimpse into the hitter that Yelich both wants to be and could be.


Altuve Is Defying the Evolution of Baseball

In 1912, the now-known as International Association of Athletics Federations recognised the first record in the 100 metres for men in the field of Olympics’ athletics. Donald Lippincott, on July 6, 1912, became the first man to hold an official record on the discipline with a time of 10.2 seconds from start to finish. He measured 5’10’’ and 159 lbs. It wasn’t until 1946 – 34 years later – that a man broke the 10-second barrier in the 100 meters. James Ray Hines did it at 6’0’’ and 179 lbs. Now fast-forward to 2009 and look up a name: Usain Bolt. There is no one faster on Earth. The Jamaican set the 100 metres world record (9.69 seconds) in Berlin holding a size of 6’5’’ and 207 lbs. I don’t think it is hard to see the evolution of the athletes’ bodies here. We, as human beings, are becoming taller and stronger, physically superior each year. At least some.

While we can’t compare the MLB and baseball as is with Olympic athletes and the demands of track and field, the evolution of sportsmen have been parallel to some extent between both fields. Look at this season’s sensation Aaron Judge. He’s huge. He’s a specimen of his own, truly unique in his size and power. Basically, he’s what we may call the evolution of the baseball player made real. Given that we have height and weight data from 1871 to 2017 provided by Baseball-Reference.com we can plot the evolution of both the height and weight of MLB players over the past 146 years. Here are the results.

Unsurprising, if anything. As we could expect, small baseball players populated the majors during the XIX century and the first third of the XX one, only to get reduced to a minimum that has never got past three active players of 67 inches or less for the past 61 years. On the contrary, players taller than 78 inches started to appear prominently in the 60’s and 70’s to reach their most-active peak in 2011 with 72 players spread over multiple MLB rosters. A similar story can be told about the weight of ballplayers, who tended to be lighter in the early days of the game than from the 70’s on, starting to be overcome in presence by heavier players at around the mid-to-late 90’s.

But even with as clear a trend as this is, there are always outliers out there. And in this concrete case of player size, Jose Altuve is defying the rules of evolution by no small margins. At 5’6’’, the Venezuelan is the shortest active MLB player, and he started painting his path to the majors by signing with Houston for a laughable $15,000 international bonus after being rejected earlier by the Astros due to him being too short. This happened in 2007, and by 2011 Jose Altuve was already playing in the MLB and finishing his rookie season with an 0.7 bWAR (good for 5th-best among 21 years old-or-less rookies, tied with RoY Mike Trout). By his second season, Altuve made the All-Star Game, became a staple at Houston’s second-base position and posted a 1.4 bWAR. From that point on he’s had seasons valued at 1.0, 6.1, 4.5, 7.6 and 6.2 bWAR. The next table includes the 20+ bWAR – during their first seven seasons playing in the majors – players of height 5’6’’ or smaller the MLB has seen since 1871.

Look at the debut season of all those players. Of the eight that made the list, two are from the XIX century and five from 1908 to 1941. That is, the closest “small” player with a 20+ bWAR during his first seven seasons of play to Jose Altuve is from more than 75 years ago – and Altuve’s yet to finish the 2017 season, which will probably enlarge his bWAR total.

Focusing on the 2017 season, a total of 1105 position players and pitchers have generated offensive statistical lines and accrued bWAR values by Baseball-Reference.com. Here’s how they are distributed in terms of height/bWAR.

It is not hard to see how the average MLB player holds a height of around 72 inches (6’0’’), varying from 69 to 76 in most of the cases. There way taller (Chris Young, Alex Meyer, Dellin Betances) and way smaller (Tony Kemp, Alexi Amarista) outliers, and if we add bWAR to the equation, then there is Jose Altuve. Yes, Altuve is the blue dot in the chart, at the bottom right part of it. Not only is he the shortest player of the league, but he’s also the most valuable at this point (6.2 bWAR by Sunday, August 6) and by a good margin over his closer rivals Andrelton Simmons (5.7), Paul Goldschmidt (5.5), Aaron Judge (5.1) and Mookie Betts and Anthony Rendon (both 5.0).

Not just happy with that, Altuve is leading the league in hits (151, with just an 11.9 K% – 16th-best among qualified hitters), batting average (.365), OPS+ (176) and total bases (238). He has improved in virtually every statistical category during the current season, participated in his fourth consecutive All-Star Game, led the MVP race in the AL, and he’s on pace to get also his fourth Silver Slugger award at the second-base position. Even with all that, the likes of Judge and Trout are coming and finishing the year strongly, and there are no guarantees for Jose to become the first Venezuelan to win the MVP since Miguel Cabrera did it five years ago in 2012.

All in all, and looking at how his top rivals stack up in terms of size and production, their numbers could be somehow expected. What Altuve is doing at his size, though, not so much. We have been told that we’re living in the era of the strikeout and that of that of the home-run resurrection, but Jose is determined to turn back the clock and make us all appreciate the wonders of small ballplayers roaming the majors’ fields. Appreciate it while you can, because what he’s doing is truly unique in the history of the sport and its evolution expectations, although it doesn’t seem like anything will be stopping Jose “Gigante” Altuve any time soon.


Understanding Roger Bernadina’s KBO Rebirth

A lot of things have clicked for the Kia Tigers this season, chief among them being their offense’s record production. Kia’s fearsome lineup features three of the Korean Baseball Organization’s top-10 hitters by batting average, and five of the top-20 hitters by wRC+, and is a driving force behind the team’s domination of the standings, currently sitting in a comfortable 1st place at 64-34-1, five games up on the second-place NC Dinos.

A major force behind the dominance of the Kia offense has been the unexpected emergence of their new center fielder Roger Bernadina, in his first season in the KBO. Just a season ago, Bernadina was toiling in the minor leagues, playing with the Las Vegas 51s, the New York Mets’ Triple-A affiliate.

The difference between the old Bernadina, a failed prospect who played seven partial seasons in Major League Baseball, mostly with the Washington Nationals, and the current Bernadina, who hits leadoff for the Kia Tigers’ offensive juggernaut, is stark.

Roger Bernadina career stats, 2008-2017
league years G AVG OBP SLG wRC+ WAR
MLB 2008-14 548 0.236 0.307 0.354 81 1.2
KBO 2017 95 0.320 0.383 0.551 135 3.9

In less than a fifth of the games played, Bernadina has already accumulated over three times his MLB WAR and hit over half as many home runs (19 to 28). By wRC+ he has been the 16th most productive player in the KBO this season, and by WAR, he has been the 6th best position player in the league. On Thursday night he hit for the cycle, becoming only the third foreign player to do so in the KBO. Quite a jump for someone who was a career 81 wRC+ hitter in the MLB.

Which of course begs the question: What’s changed? In less than a season, how has Roger Bernadina improved this much?

It isn’t plate discipline; Bernadina is actually walking slightly less (7.7 percent in the KBO versus 8.2 percent in the MLB) and swinging more (50.3 percent vs 42.1 percent). His strikeouts are down from 21.3 percent in the MLB to 17.4 percent in the KBO, but that change may be more a function of the leagues themselves (the MLB’s higher overall K% means Bernadina’s mark is about league average in both leagues) than any adjustment Bernadina himself has made.

Bernadina also still profiles as the same type of hitter, hitting a majority of his batted balls on the ground, with a moderate preference to pull. He never displayed particularly drastic platoon splits, hitting roughly the same against lefties and righties, and this tendency is also unchanged. Though his batted-ball characteristics would have made him a reasonable shift candidate, shifts were almost never employed against him in the MLB, so his increased numbers in the KBO are also not the result of the KBO’s relative lack of defensive shifts.

The biggest difference is the change in Bernadina’s batting average on balls in play. His current KBO BABIP is .353, a drastic increase from his career MLB BABIP of .288.

On one hand, Bernadina profiles as the type of hitter than might naturally run a higher BABIP. He runs well, having rated as a positive baserunner and base-stealer in both his time in the MLB (59 steals, 83% success rate, 8.9 BsR) and the KBO (21 steals, 81% success), and the fact that he is primarily a ground-ball hitter should give him ample opportunity to take infield hits and run a higher BABIP.

However, his track record shows this to not be the case. BABIP is a statistic that takes a long time to stabilize, and as such his career average is more indicative of him as a player than his current 2017 outlier mark. With no other changes in batted-ball profile or batting approach, Bernadina’s increased BABIP, and by extension increased offensive production, is more likely the result of fortunate circumstances and luck than any real change in skill.

That being said, simply acknowledging that Bernadina has been lucky this season does not diminish his performance. Regardless of whether he is performing to his expected outcomes or not, he has been a productive member at the top of the Kia Tigers’ lineup and, perhaps even more interestingly, has hit better as the season has progressed.


Even Without Brad, the Padres’ Pen Will Be in Good Hands

As with most rebuilding teams, the San Diego Padres aren’t in any particular need of a strong bullpen, and they’ve handled this season’s trade deadline accordingly. As of July 30, they’ve already traded away Ryan Buchter and first-half closer Brandon Maurer, and relief ace Brad Hand is expected to follow this offseason. The rest of San Diego’s bullpen is, for the most part, unexceptional; not including Hand, the most-used relievers still on the team are Craig Stammen and Jose Torres, neither of whom have a positive WAR or a FIP under 4.50.

It’s fortunate for San Diego, then, that Kirby Yates has quickly become their most reliable non-Hand option in relief. The team plucked Yates, a relatively unknown 30-year-old Hawaiian right-hander, from the waiver wire in late April, prior to which he’d spent time as a Ray, a Yankee, and, for one inning in 2017, an Angel. Minus a disastrous 2015 season, due in part to a HR/FB ratio of over 30%, both Yates’s FIP and xFIP have consistently been below 4.00. He’s also demonstrated an impressive strikeout ability over the past few years; his K rates in ’14 and ’16 were both approximately 27%, and in 2015, his worst season, he still managed to strike out nearly 23% of batters faced.

Since his move down the California coast in April, though, Yates has emerged into the Padres reliever perhaps most likely to take over the closer role — assuming Hand is dealt as expected (ed. note: oh well) — and has been one of the more unexpectedly impressive relievers of 2017. In prior years, Yates’s terrific strikeout rate was often coupled with a walk rate that was passable at best (7.6% in 2015) and dreadful at worst (10.3% last season). This season has seen progress in both areas — his BB% is down to 6.3%, and he’s struck out over 38% of the batters he’s faced. Yates’s improvements in strikeout and walk percentage have been sufficient to land him among the league leaders in both K%, where he ranks seventh among qualified relievers, and K-BB%, where he ranks fifth, at 31.9%. For reference, Andrew Miller ranks sixth at 31.0%, and other members of the top five are comprised of arguably the best relievers in the game, including Craig Kimbrel and Kenley Jansen.

Of course, it’s a bit premature to tout Yates as a Kimbrel-quality option out of the Padres’ bullpen. He doesn’t have the same electric stuff, or anything near the track record, of his peers on the league leaderboards, and he’s been the beneficiary of a strand rate of almost 91%. At 3.09 and 3.01, his FIP and xFIP, respectively, are also significantly higher than his 2.23 ERA, so there’s a fair bit of evidence to suggest that Yates isn’t as good as his basic stats indicate. With that being said, though, there’s a lot to like about Yates’s performance this year. There’s nothing fluky about a 38% strikeout rate, and his SIERA score, at 2.24, has been far more bullish on Yates than have his FIP and xFIP. So while Yates isn’t necessarily becoming the next great San Diego closer, his improvements this year are far too drastic to be chalked up entirely to luck.

Instead, I believe there are a couple interrelated reasons for Yates’s recent success. In June, Jeff Sullivan wrote about Brewers starter Chase Anderson’s 2017 breakout, noting that Anderson had started shifting his location on the rubber. Against right-handed hitters, Anderson began his wind-up from the far right side of the rubber; this was, as Sullivan explained, about “playing the angles,” adding that Anderson could get his pitches “sweeping away” from these batters.

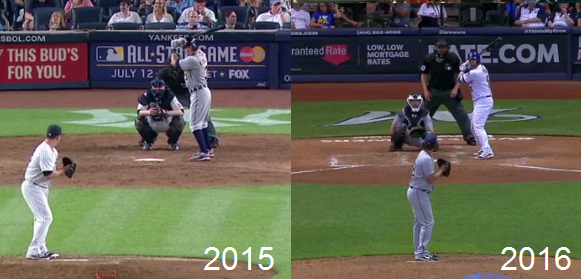
Yates, it appears, has followed the same line of thinking. Compare the starting point of Yates’s delivery between the past two seasons:

rubber

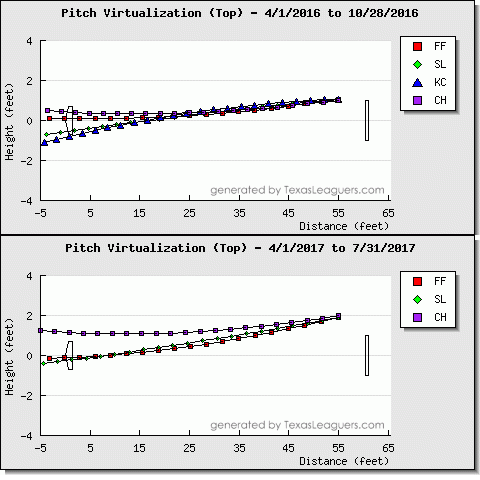
We can also see how much his pitches’ respective routes to home, as illustrated by PITCHf/x, have changed since last season:

pitchpaths

Compared with a .283/.372/.457 slash line in 2016,  righties are hitting just .171/.227/.305 against him this year, with a .227 wOBA and .224 xwOBA. With Yates’s new starting point on the rubber, his pitches have been able to more effectively “sweep away” from right-handed batters, since they start significantly farther to the right, and he’s seen excellent results against righties in particular. This effect, I believe, has been a significant contributor to Yates’s success. As the above graph indicates, his fastball and slider travel most toward the outer section of the plate, which may be giving right-handed hitters more difficulty in the batter’s box.

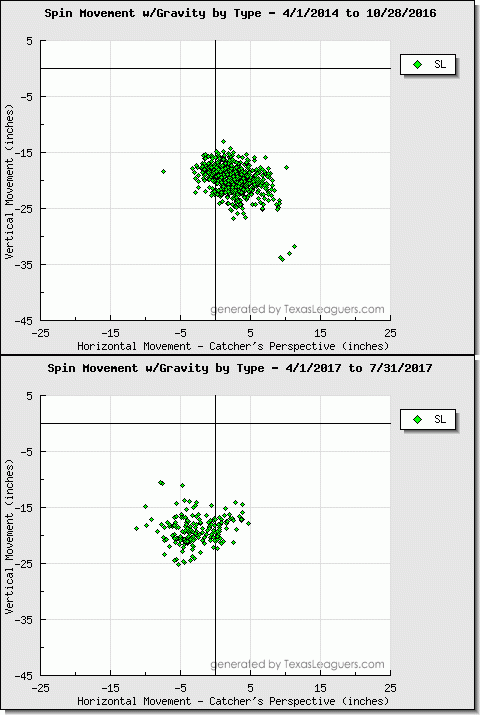
However, that’s not the only interesting development regarding Yates’s slider. According to PITCHf/x, he’s throwing roughly four percent more sliders against right-handers, and his fastball usage has declined by roughly the same amount. His slider hasn’t spun the same this year as it has in the past, either: according to PITCHf/x, the pitch’s spin rate has risen from 594 to 1,962 RPM this season. (I should note that Baseball Savant sees a negligible difference in the average spin rate of Yates’s slider, so there may be an error in the data.) Regardless, it’s hard to deny that the pitch’s movement has changed:

sliders14-17

As evidenced by the wide spread in 2017, Yates’s slider still seems like a work in progress, but it’s clear that the pitch has taken on some new movement. FanGraphs, through PITCHf/x, scores his slider’s xMov as having shifted from 1.4 to -2.2, indicating that the pitch has actually begun moving toward right-handed batters. This doesn’t invalidate the merits of Yates’s shift on the mound, though — the new angle might still be affecting how righties pick up his pitches, and the majority of his sliders do tend toward the outer half of the plate, thus still “sweeping away” from the batters.

Yates briefly spoke on his slider in a May interview with Jeff Sanders of the San Diego Union Tribune, saying the pitch was “getting back to where it used to be.” I found this a curious phrase for Yates to use, seeing as how the pitch has done anything but revert back to its old movement. His next sentence, however, may answer this question. Yates says he’s “incorporated a splitter that [he] feels pretty confident in,” and later mentions that over the offseason, he developed the pitch as a sort of contingency plan against an occasionally less-than-trustworthy slider.

I’m not very familiar with the inner workings of PITCHf/x, but it seems possible that the system could be classifying some of Yates’s new splitters as sliders. Not only would this account for the change in his slider’s horizontal movement, but it’d also explain Yates’s description of the pitch. Overall, though, I believe Yates’s newfound success can largely be attributed to the above adjustments he made over the offseason. He may not become the next Trevor Hoffman, but Yates has shown the Padres more than enough to feel a bit more comfortable with their bullpen, even after Brad Hand is dealt this winter.


Where Are Anthony Rizzo’s Missing Hits?

Anthony Rizzo is hitting just .257 this year with a .242 BABIP. A fantasy-league mate of mine proclaimed “Rizzo sucks this year” after a recent trade. However, the only thing I can see that’s changed is his BABIP. He’s on pace for 106 RBI and 95 runs after totaling 109 RBI and 94 runs last season. His ISO is an identical .252. For all intents and purposes, he’s the same hitter, except he’s missing some hits. My league-mate chalked this up to “he’s getting shifted more” or “he’s worse hitting against the shift.”

One of those two things is correct. Rizzo has faced a shift in 85.7% of his plate appearances this year, which isn’t different from the 85.5% he faced last season. Rizzo is, however, hitting only .247 on balls in play when facing the shift (.214 when not shifted) this year. This is a 54-point swing in BABIP from a year ago (.301 while shifted; .359 when not shifted). This amounts to 13 missing hits thus far this year against the shift (and six more when not shifted). For the purposes of this article I want to focus on the missing hits against the shift.

What we have here is the symptom of something that’s going on when Rizzo is hitting this year that wasn’t happening as much last year, so I started sniffing around for other major changes in the Rizzo data. One thing that popped into my head was that the Cubs offense, especically the top of the order, has been getting on base much less this year than last year. That led me to thinking about what the defense looks like when there are runners on base versus when the bases are empty.

For a reference point, this is a typical shift against Rizzo with no one on base:

Rizzo_Shift_No_One_On_Base

With only a runner on first base, the shift is the same, but with the obvious addition of the 1B holding the runner on.

In 2016 Rizzo batted with runners on base in ~55% of his plate appearances and ~32% of the time with runners in scoring position. In 2017 those numbers have dropped to ~45% and ~24%.

While I don’t have Rizzo-specific defensive placements for all his batted balls in play, I did compare his spray charts from last year and this year and noticed two very empty spots.

The first spot is just behind the second-base bag, where the SS typically lines up in the over-shift against Rizzo. In 102 games this year, Rizzo has yet to collect a hit to this part of the field, while he had six hits within this area of the field last year and a few more just behind it to the opposite-field side. Using the FG splits tool we can see Rizzo has an .054 AVG in this area of the field this year vs. .333 from a year ago.

Rizzo

The second empty spot is where you’d find line drives to the opposite field falling in before the left fielder. This led me to look into Rizzo’s batted-ball distribution to the pull side and opposite-field side for both ground balls and line drives. As you’ll see, Rizzo is going to the opposite field ~5% less on his ground balls, and non-oppo GBs turn into outs more frequently for Rizzo due to the shift.

Rizzo Batted Ball Distribution 2016 & 2017
PULL OPPO
2016 2017 2016 2017
GB 63.9% 60.8% 10.4% 4.8%
LD 39.2% 50.9% 25.8% 22.8%

Rizzo is hitting .140 this year on ground balls to the left or up the middle, against a .345 mark from a year ago. This accounts for eight of his 13 missing hits. Another three hits are accounted for from luck against the shift on the pull side. The remaining two missing hits are from a slight change in batted-ball distribution on line drives to the opposite field. At the end of the day, I don’t think anything has changed with Rizzo outside normal variance in various batted-ball outcomes.