Archive for Outside the Box

The Value of Hitting the Ball Hard

There is value in the fly ball. That statement isn’t something that will surprise any fan. Even someone who knows very little about baseball could piece together the logic behind it. The most valuable individual outcome is a home run. How do you hit a home run? Hit a fly ball. As Travis Sawchik found for 2016, fly balls produced a wRC+ of 139, while ground balls put up a mark of 27 wRC+.

Of course, the sabermetrically inclined will quickly point out that it’s not that simple. Judging the value of a hit based on whether it is a fly ball or a ground ball is a futile exercise. You have to consider batted ball distance, launch angle, and exit velocity. Much has been made about the recent “fly ball revolution” occurring throughout the league. And while some believe hitting more fly balls really does increase the value of a player, data suggests that the fly ball revolution is hurting as many batters as it’s helped.

It’s possible that there are benefits to hitting more fly balls, but that doesn’t seem to correlate to an increased value.

2LMPbub.0.png

There really is no correlation between fly ball % and wRC+. So, it seems that value is added not by hitting the ball higher, but by hitting the ball harder.

Ll87TiG.0.png

Now this is a pretty clear correlation. Hit the ball harder and a better outcome is more likely. A soft liner toward the second baseman will probably be an out. But, a laser to right-center field could be a triple.

This trend is not a new development or a new discovery. As far back as 2002, when batted-ball data became available, there has always been a positive correlation between Hard% and wRC+. In fact, the average correlation (R-squared value) between these two variables over the last 15 years is .475.

Hard% also has predictive value. Take a look at the data for 2017 thus far.

yKhUSON.0.png

Although the correlation from past years isn’t there, it doesn’t need to be. We should no more expect the data to already have an R-squared value above .4 than we would expect an MVP to have a WAR higher than 6 at this point of the season. Because there are quite a few outliers that will come back to the mean, Hard%, based on its historical data, has considerable predictive value.

Ignoring the one point above the 200 wRC+ line (Mike Trout, whose entire career is an outlier), let’s examine a couple outliers. First, the point on the far right toward the bottom. Nick Castellanos is hitting the ball harder than Aaron Judge, who just set a Statcast record for hardest home run ever hit, but only has a wRC+ of 82 — well below average. Towards the top of the chart at the 175 wRC+ mark, we see that Zack Cozart is making hard contact only 32% of the time.

It is reasonable to expect, based on this chart, that Castellanos’s numbers will start to improve and Cozart’s will regress. As it turns out, Andrew Perpetua found the same outliers by looking at exit velocity and xOBA in a RotoGraphs article last week. These statistics all point toward the same thing — Castellanos has been very unlucky and Cozart has been just the opposite. The takeaway here is that Hard% can be used as a predictor for value even over a smaller sample size.

If Hard% is such a good indicator of success, what is the actual value of hitting the ball hard? Hitting the ball hard has been a hallmark of both HR leaders and batting champions. Over the last five years, the HR champion has an average Hard% of 40.12 and the batting champion has one of 35.16%. Although the almost five-point spread is a lot, a Hard% above 35% is nothing to laugh at — it’s still in the upper half of all players.

For the last full season (2016), increasing Hard% by even just 5% added 13 points to the wRC+ value. That is pretty significant. For context, 13 wRC+ is the difference between Aaron Judge and Yonder Alonso so far this year. But has it always been this way? Not exactly. In 2002, a 5% increase in Hard% increased a player’s wRC+ by 20 points. This points toward an interesting trend.

J3hjnZi.0.png

For the last 15 years, the correlation between Hard% and wRC+ has decreased. In other words, hitting the ball hard is not as valuable as it once was. My initial thought was that players aren’t hitting as many HRs as they did in 2002. But that is simply not true. 14.2% of flies result in HRs — the highest rate ever recorded. Perhaps this trend is a result of defenses shifting. Are batters hitting the ball harder than ever, but fielders are now better positioned? The shift is certainly a powerful tool — it kept Ryan Howard out of the Hall of Fame. Still, I’m not convinced the shift is solely responsible for this eerie trend.

Hitting a ball hard is much more important than hitting it high, that is, if you can’t have it both ways. However, the value of hitting the ball hard has decreased for more than a decade. Looking at the data, is it possible that in 10 years we’ll see a sort of “v” shape, indicating a return to the value of hitting the ball hard? Maybe. But for now, this is an interesting trend with no clear indicator.


Ballplayers and the Karmic Practice of Yoga

Injuries are something that pronounce their impact differently on every player in the game. Some guys have freakish bodies and recover faster naturally. Others push themselves to accelerate their return. But recovery from some injuries can’t be sped up. Maladies like inflammation are plainly matters of time.

JA Happ went on the 10-day DL on April 18 for having it in his elbow. He’s finally back on the mound in the Majors after being out for more than a month.

Kendall Graveman just hit the DL for soreness in his throwing shoulder and is “taking anti-inflammatory medication and resting,” per Susan Slusser of the San Francisco Chronicle. Manager Bob Melvin says he’s been through this before, that it’ll take longer this time, and that the team is going to “let this thing calm down” before trying to build up his endurance again. The passivity in his words is telling.

And if you have the heart to remember the end of Roy Halladay’s career, you’ll remember inflammation in his throwing shoulder cost him time on the DL amidst his body simply telling him, “please, no more.”

Inflammation is a general response from the body that results from cell agitation. It can occur from normal use — “normal” being a relative word. It intends to clear out damaged cells but the process causes pain, discomfort, and inherently imbalanced levels of certain proteins in our bodies. And the things a ballplayer does every day, the extreme motions they constantly put themselves through for more than half a calendar year, make them prime candidates to become victims of it.

Enter yoga.

There’s no causal relationship between yoga and reduced injuries. But as I researched its impact on ballplayers for a job, I couldn’t help but think of the benefits. And I did find that it has been connected to balancing the proteins that can get whacked out in players’ bodies through the course of a season.

Researchers have studied a particular form called Hatha yoga, which combines poses (asanas), breath control (pranayama) and meditation. They explored its ability to help aid in recovery from the regular wear-and-tear we put our bodies through. “Regular” is another relative term — think of the twist and torque your favorite hitter exhibits on each swing and how that could eventually cause a dreaded oblique strain.

The study’s trippiest finding centers on epinephrine levels in the brain, which are fueled by the adrenal gland and play a large role in maintaining both physical and emotional stress. In focusing on the differences between novices and experts, experts experienced higher levels of epinephrine on a regular basis. That surprised even the researchers.

Common sense might tell us that the more we have of something, the more we get used to it, and then the less impact it has on us. It’s why a person going skydiving for the first time can find it exhilarating while it’s just another day at the office for the instructor they’re attached to. It’s the same when a pitcher isn’t excited about his velocity inching up through the spring. He can expect it because of what he’s thrown in the past.

The study found the opposite with yoga, though. The body adapts to the poses, breathing patterns, and meditation in Hatha yoga, and the person gets better at it; but chemically, they don’t get used to it. It doesn’t become old hat. Instead, the practice becomes invigorating and those who practice it build up what becomes an expandable physiological embankment of wellness.

What’s more is that, based on the study’s parameters, a player could approach expert level at yoga over the course of a single season. A few hours a week could help keep their protein levels balanced through the summer and avoid the fickle complications of inflammation. And beyond even that, it offers a fresh, low impact way to optimize their body that could pay long-term dividends.


A Situational Lineup: Management Questions With No Clear Answers

It has come to my attention that in the 1880’s and early 1890’s an interesting management phenomenon presented itself around baseball. At this time, managers were not required to submit a lineup card before the start of the day’s game. Due to this, the first time through the batting order could be constructed the way the manager saw fit, based upon situations in the game. That being said, once the lineup went through its progression once, its construction would pervade throughout the rest of play. In lieu of this, an interesting set of strategical questions come into play. How would managers set lineups if this rule existed today? How would this effect run totals for the season for a given team? Would lineup construction change its form or remain largely the same as the way it is done now? This article is not one that analyzes or provides solutions but, instead, provides questions that are interesting and engaging to any baseball connoisseur.

The implications and strategy behind this lineup maneuverability are something that provides tons of differing opportunities for discussion. I think the lead-off hitter, if this rule was applied to the game today, would remain mostly the same. Managers would continue to look for an on-base machine to start off the game in a positive fashion. Along with this, I believe that the seven through nine batters would remain mostly static. Managers would look to place their worst hitters and their pitcher in these spots in order to diminish their number of at-bats in impact situations. With these assumptions established, a world of possibilities open up for the two through six hitters in the lineup. Each manager would approach this construction differently based upon the day’s match-up and the game’s progression. That said, here are a set of interesting scenarios that can provide interesting implications for the progression of a game and for run production in that game.

Let’s assume we’re the Angels and we have their current set of middling players that play alongside a healthy, and studly, Mike Trout. It’s the top of the first inning and the first two outs have already been made, no one’s on base, and we have to choose who will hit. Although there are no runners in scoring position, would you (as the manager) decide to hit Trout in this spot? Or, would you wait and hit Trout to lead off next inning and hope he starts off the inning strong? Or, would you wait to bat Trout sixth and hope that the first two batters in the next inning get on base and Trout can drive them in?

If you choose the latter, the implications of such would be a diminished number of at-bats in the game for Trout. Would it be worth it to wait on an impact situation to have Trout hit for the first time, even if this led to one less at-bat for the rest of the game? I think, personally, in this scenario I would hit Cameron Maybin in the three hole, following Yunel Escobar and Kole Calhoun. I think Maybin has enough pop to hit a home run every once in a while with the bases empty. I also think that if he got on base, I’d hit Trout directly following in the four hole. If it were a single by which Maybin got on, he would go first pitch and try to swipe second. If he got thrown out, it would be fine and I’d have Trout leading off my next inning, followed by Albert Pujols and Luis Valbuena. If he swiped the bag, we would now have a runner in scoring position for our best hitter, which is exactly what we want.

I can see as I’m writing that my ideas are getting harder and harder to follow, but I think this is a direct result of the vast array of possibilities this type of management choice presents. It would be interesting to see major-league managers, much more knowledgeable than myself, go about making these decisions on a daily basis. What do you think would be the best lineup set in this situation? And what other situations would be interesting to discuss as baseball fans?


The 2016 Strike Zone and the Umpires Who Control It

Introduction

One of the most-discussed issues in Major League Baseball is the consistency of the strike zone. The rule-book strike zone states “The STRIKE ZONE is that area over home plate the upper limit of which is a horizontal line at the midpoint between the top of the shoulders and the top of the uniform pants, and the lower level is a line at the hollow beneath the kneecap. The Strike Zone shall be determined from the batter’s stance as the batter is prepared to swing at a pitched ball.” After watching games throughout the regular season and playoffs, it is easy to realize this is not the strike zone that is called. Each umpire has tendencies and dictates his own strike zone and how he will call a game. With the rise of PITCHf/x and Trackman in the last few years, umpires have been increasingly monitored and judged for their accuracy and impartiality. For this reason, umpires are criticized for incorrect calls more than ever before and I believe are now trending towards enforcing the rule-book strike zone more than in years past.

The purpose of this research will be to do two things. First, I will focus on identifying overarching themes where I look at finding how umpires are adjusting to modern technology but also how the rule-book strike zone is not the strike zone we know. After this, I will dive into a few umpire-specific tendencies. The latter would be helpful to teams in preparing their advance reports by knowing how certain umpires call “their” strike zone dictated by situations in a game.

Analysis

Using PITCHf/x downloaded through Baseball Savant, I have looked at major-league umpires since 2012 in regards to their accuracy in correctly labeling pitches, primarily strikes, and their tendencies dictated by specific situations. While the height of the strike zone is often influenced by the height of the batter, there are other factors to take into account such as the how the batter readies himself to swing at a pitch. Unfortunately, the information publicly available to conduct this research does not include the batter handedness, pitcher name, or measurements of individual strike-zone limits. For this reason, a stagnant strike zone serves our needs best. The height of the strike zone shall be known as 1.5 feet from the ground to 3.6 feet from the ground. This is the given strike zone of a batter while using the pitchRx package through RStudio when individual batter height is not included.

All PITCHf/x data is from the Catcher/Umpire perspective, having negative horizontal location to the left and positive to the right. The width of home plate is 17 inches, 8.5 inches to both sides where the middle of the plate represents 0 inches. After calculating the average diameter of a baseball at 2.91 inches, we add this to the width of the plate. Therefore our strike-zone width will be 17 + 5.82, or 22.82 inches. The limits we will then set are going to be -.951 to .951 feet (or 11.41/12 inches). Throughout the paper I will be referring to pitches that fall within the boundaries of our zone as “Actual Strikes” and pitches correctly identified as strikes within this zone as “Correctly Called Strikes.”

Called Strike Accuracy By Year

As Table 1 shows, correctly identifying strikes that fall in the parameters of the rule-book strike zone has risen substantially. While 2015 has a higher percentage of correctly called strikes, 2016 PITCHf/x data from Baseball Savant was incomplete, with 28 days’ worth of games unavailable at the time of this research. A rise of 5.90 percent correctly called strikes from 2012 to 2015 shows the rule-book strike zone is being more strictly enforced.

table-one

While this provides some information, we can also look into where strikes are correctly being called using binned zones. Understanding that the evolution of umpires over the last five years is taking place and trending toward correctly identifying strikes more today than in years past, we can analyze where, in the strike zone, strikes have been correctly labeled.

Called Strike Accuracy by Pitch Location

In Table 2, we can see a tendency among umpires. Strikes are called strikes more routinely over the middle of the plate and to the left (from umpire perspective). As I have mentioned before, the publicly available PITCHf/x data I used did not include batter handedness and I am unable to determine who is receiving the benefit or disadvantage of these calls. Presumably from previous research on the subject, lefties are having the away strike called more than their right-handed counterparts, explaining the separation between correctly identifying strikes in zones 11 and 13 versus 12 and 14.

Binned Strike Zone
binned-strike-zone

table-two

While one may argue that there should not be strikes in these bordering zones, we consider any pitch that crosses any portion of the plate a strike. Due to our zone including the diameter of the baseball on both sides of the plate, the outer portion of the plate includes pitches where the majority of the ball is located in one of these zones.

Called Strike Accuracy by Individual Umpire

When gauging an umpire’s ability to correctly identify a rule-book strike, an 85.67% success rate sets the mark with Bill Miller, while Tim Tschida ranks at the bottom of this list, only calling 71.57% correctly. We can infer from Tables Three and Four along with Table One, that while umpires are calling strikes within the strike zone more often, they are still missing over 17% of these pitches. It is important to note that this information does not take into account incorrectly identifying pitches outside the rule-book strike zone as strikes, which when considering an umpire’s overall accuracy, should absolutely be taken into account.


table-three

table-four

Called Strike and Ball Accuracy by Count

One of the most influential factors in whether a taken pitch is called a strike or a ball is the count of the at-bat. We have all seen pitches in a 3-0 count substantially off of the plate called a strike, just as we have seen 0-2 pitches over the plate ruled balls. Table Five shows the correct percentage of strikes and balls by pitch count. While this shows that umpires are overwhelmingly more accurate at identifying strikes as strikes in a 3-0 count (91.06%) as compared to an 0-2 count (56.66%), we must acknowledge this only paints part of the picture. Umpires are conversely most likely to correctly labels balls in 0-2 (98.73%) counts and misidentify balls in 3-0 (90.32%) counts. I included their accuracy of correctly identifying both strikes and balls here as opposed to throughout the entire paper because we can clearly tell through this information that umpires are giving hitters the benefit of the doubt over pitchers. Umpires are far more likely overall to correctly identify a ball than a strike, as evidenced by the fact that there are no counts during which umpires correctly call less than 90% of balls.

table-five

The data in Table Five is corroborated by the visualizations in Figure One and Figure Two. These visualizations of the strike zone include pitches off of the plate and we can see that in a 3-0 count, a more substantial portion of the rule-book strike zone is called strikes while also incorrectly identifying balls as strikes. While in a 0-2 count, a smaller shaded area of the rule-book strike zone works with our findings that less strikes are identified correctly but more balls are correctly called.

figure-one-and-two

Called Strike Accuracy by Pitch Type

The next area I looked at was whether pitch type significantly altered the accuracy of umpires. In order to do this, I grouped all variations of fastballs into “Fastball” and all other pitches into “Offspeed”, while omitting pitch outs and intentional balls. I was able to see how umpires fared in correctly identifying strikes by pitch type in Table Six.
table-six

Not surprisingly, we see Bill Miller near the top of the list with both Offspeed and Fastball accuracy. For umpires as a whole, the difference in accuracy between the two is not large (79.05% Offspeed accuracy vs. 78.91% Fastball strike accuracy). On the other hand, what may come as a surprise is the fact that eight of the top ten highest accuracies were for Offspeed pitches.

Called Strike Accuracy for Home and Away

One of the most-mentioned tendencies of referees or umpires in any sport is home-team favoritism. Whether a foul or no-foul call in basketball, in or out-of-bounds call in football, or a strike or ball ruling in baseball, many think that the home team receives more of an advantage than their visiting counterparts. Looking at top and bottom half of innings, away and home team respectively, we can identify trends and favoritism in major-league umpire strike zones.

While a difference of .62% accuracy may seem like a lot, especially in a sample size of over 650,000 total pitches, we can look at this on a game-by-game level to see the actual discrepancies. For simplicity’s sake, we can assume 162 games a season, making for roughly 11780 games played in our data set (this subtracts all games from the unavailable 2016 data). This leaves us with 23.03 Correctly Called Strikes out of 29.05 Actual Strikes for away teams per game, meaning that 6.02 strikes were not called. As for home teams, we have 22.04 Correctly Called Strikes a game with 28.02 as the Actual Strikes, averaging 5.98 missed strikes a game. By this measurement we can see that more hitter leniency was given to the away team than the home team.

During this time frame, while a higher percentage of strikes were judged correctly, hitters were given more leniency as the away team than the home team on a game-by-game basis.

table-seven

Called Strike Likeliness in Specific Game Situation

Included in Table Eight are the three most and least likely umpires to call any non-fastball a strike below the vertical midpoint of our zone. I split the strike zone at 2.55 vertical feet and looked at any pitch (not necessarily within the zone) below that height. Here, we are not judging an umpire’s accuracy of correctly identifying pitches, but rather looking at where a certain umpire may call specific pitches. We can see that Doug Eddings is 5.34% more likely to call a strike on a non-fastball as compared to Carlos Torres.

While this does not paint the entire picture, we are able to see how their tendencies can play an important role in the game. Information like this may be valuable to a team in deciding how to pitch a specific batter, which reliever to bring into a game, or factor into being more patient or aggressive while at the plate.
table-eight

Conclusion

External pressures and increased standards are undoubtable effects on umpire strike zones. As evidenced throughout this paper, strike zones are called smaller than the rule-book strike zone specifies. And while umpires are trending toward correctly identifying strikes, situations such as count and pitch type can affect their judgment.

While the system in place is not 100%, we must understand that these umpires are judging the fastest and most visually-deceptive pitches in the world and are the best at what they do. Major League Baseball must use modern technology to their advantage and provide the best training for umpires to achieve the goal of calling the rule-book strike zone. Another option, while more drastic and difficult to implement, may include adapting the definition of the rule-book strike zone, something that has not been changed since 1996.


The Least Interesting Player of 2016

Baseball is great! We all love baseball. That’s why we’re here. We love everything about it, but we especially love the players who stick out. You know, the ones who’ve done something we’ve never seen before, or the ones that make us think, “Wow, I didn’t know that could happen.” It’s fun to look at players who are especially good — or, let’s face it, especially bad — at some aspect of this game. They’re the most interesting part of this game we love.

But not everyone can be interesting. Some players are just plain uninteresting! Like this guy.
http://gfycat.com/TinyWeakBonobo
OMG taking a pitch? That’s boring. You’re boring everybody. Quit boring everyone!

https://gfycat.com/GargantuanCreamyAmberpenshell
You caught a routine fly ball? YAWN! Wake me when something interesting happens.

But it’s hopeless; nothing interesting will ever happen with Stephen Piscotty. I’m sure the two GIFs above have convinced you that he was the least interesting player in baseball last year. But, on the off-chance that you have some lingering doubts, we can quantify it. I’ve made a custom leaderboard of various statistics for all qualified batters in 2016. For each of these statistics, I computed the z-score and the square of the z-score. In this way, we can boil down how interesting each player was to one number — the sum of the squared z-scores. The idea is that if a player was interesting in even one of these statistics, they’d have a high number there. Here are the results:

Click through for an interactive version

I don’t need to tell you who the guy on the far right is. On the flip side, though, there are two data points on the left that stick out. The slightly higher of the two is Marcell Ozuna, with an interest score of 1.627. The one on the very far left is Stephen Piscotty, with an interest score of 0.997. That’s right — if you sum the squares of his z-scores, you don’t even get to 1! This is as boring and average as baseball players get.

Where the real fun begins, though, is when you start making scatter plots of these statistics against each other. I’ve made an interactive version where you can play around with making these yourself, but here are a few highlights:


AVG vs. SLG


IFFB% vs. OPS


ISO vs. wRC+

Pretty boring, right? But wait, there’s more! Let’s investigate a little further what went into his interest score. Remember how we summed his squared z-scores and got a value below 1? Well, let’s look at the individual components that went into that sum.

The Most Boring Table Ever
Statistic Squared z-score
LD% 0.108
GB% 0.002
PA 0.296
G 0.220
OPS 0.001
BB% 0.057
SLG 4.888e-05
WAR 0.007
BABIP 0.141
K% 0.103
IFFB% 0.0004
ISO 5.313e-05
FB% 0.007
wOBA 0.022
AVG 1.69e-29
wRC+ 0.025
OBP 0.006

Yes, you’re reading that right — where he stood out the most was in games played and plate appearances. Yay, we got to see that much more boring! Also, I think it is especially apt that his AVG was EXACTLY league average.

All right, time to step back and be serious for a second. As Brian Kenny is always reminding us, there is great value in being a league-average hitter. Piscotty was worth 2.8 WAR last year, just his second year in the league. He’s already a very valuable contributor to a very good team. Maybe it’s time we started noticing guys who do everything just as well as everyone else, and value their contributions too?

(Nah, I’m going to go back and pore over Barry Bonds’s early-2000s stats for the next few hours.)

All the code used to generate the data and visualizations for this post can be found on my GitHub.


dSCORE: Pitcher Evaluation by Stuff

Confession: fantasy baseball is life.

Second confession: the chance that I actually turn out to be a sabermetrician is <1%.

That being said, driven purely by competition and a need to have a leg up on the established vets in a 20-team, hyper-deep fantasy league, I had an idea to see if I could build a set of formulas that attempted to quantify a pitcher’s “true-talent level” by the performance of each pitch in his arsenal. Along with one of my buddies in the league who happens to be (much) better at numbers than yours truly, dSCORE was born.

dSCORE (“Dominance Score”) is designed as a luck-independent analysis (similar to FIP) — showing a pitcher might be overperforming/underperforming based on the quality of the pitches he throws. It analyzes each pitch at a pitcher’s disposal using outcome metrics (K-BB%, Hard/Soft%, contact metrics, swinging strikes, weighted pitch values), with each metric weighted by importance to success. For relievers, missing bats, limiting hard contact, and one to two premium pitches are better indicators of success; starting pitchers with a better overall arsenal plus contact and baserunner management tend to have more success. We designed dSCORE as a way to make early identification of possible high-leverage relievers or closers, as well as stripping out as much luck as possible to view a pitcher from as pure a talent point of view as possible.

We’ve finalized our evaluations of MLB relievers, so I’ll be going over those below. I’ll post our findings on starting pitchers as soon as we finish up that part — but you’ll be able to see the work in process in this Google Sheets link that also shows the finalized rankings for relievers.

Top Performing RP by Arsenal, 2016
Rank Name Team dSCORE
1 Aroldis Chapman Yankees 87
2 Andrew Miller Indians 86
3 Edwin Diaz Mariners 82
4 Carl Edwards Jr. Cubs 78
5 Dellin Betances Yankees 63
6 Ken Giles Astros 63
7 Zach Britton Orioles 61
8 Danny Duffy Royals 61
9 Kenley Jansen Dodgers 61
10 Seung Hwan Oh Cardinals 58
11 Luis Avilan Dodgers 57
12 Kelvin Herrera Royals 57
13 Pedro Strop Cubs 57
14 Grant Dayton Dodgers 52
15 Kyle Barraclough Marlins 50
16 Hector Neris Phillies 49
17 Christopher Devenski Astros 48
18 Boone Logan White Sox 46
19 Matt Bush Rangers 46
20 Luke Gregerson Astros 45
21 Roberto Osuna Blue Jays 44
22 Shawn Kelley Mariners 44
22 Alex Colome Rays 44
24 Bruce Rondon Tigers 43
25 Nate Jones White Sox 43

Any reliever list that’s headed up by Chapman and Miller should be on the right track. Danny Duffy shows up, even though he spent most of the summer in the starting rotation. I guess that shows just how good he was even in a starting role!

We had built the alpha version of this algorithm right as guys like Edwin Diaz and Carl Edwards Jr. were starting to get national helium as breakout talents. Even in our alpha version, they made the top 10, which was about as much of a proof-of-concept as could be asked for. Other possible impact guys identified include Grant Dayton (#14), Matt Bush (#19), Josh Smoker (#26), Dario Alvarez (#28), Michael Feliz (#29) and Pedro Baez (#30).

Since I led with the results, here’s how we got them. For relievers, we took these stats:

Set 1: K-BB%

Set 2: Hard%, Soft%

Set 3: Contact%, O-Contact%, Z-Contact%, SwStk%

Set 4: vPitch,

Set 5: wPitch Set 6: Pitch-X and Pitch-Z (where “Pitch” includes FA, FT, SL, CU, CH, FS for all of the above)

…and threw them in a weighting blender. I’ve already touched on the fact that relievers operate on a different set of ideal success indicators than starters, so for relievers we resolved on weights of 25% for Set 1, 10% for Set 2, 25% for Set 3, 10% for Set 4, 20% for set 5 and 10% for Set 6. Sum up the final weighted values, and you get each pitcher’s dSCORE. Before we weighted each arsenal, though, we compared each metric to the league mean, and gave it a numerical value based on how it stacked up to that mean. The higher the value, the better that pitch performed.

What the algorithm rolls out is an interesting, somewhat top-heavy curve that would be nice to paste in here if I could get media to upload, but I seem to be rather poor at life, so that didn’t happen — BUT it’s on the Sum tab in the link above. Adjusting the weightings obviously skews the results and therefore introduces a touch of bias, but it also has some interesting side effects when searching for players that are heavily affected by certain outcomes (e.g. someone that misses bats but the rest of the package is iffy). One last oddity/weakness we noticed was that pitchers with multiple plus-to-elite pitches got a boost in our rating system. The reason that could be an issue is guys like Kenley Jansen, who rely on a single dominant pitch, can get buried more than they deserve.


Maximizing the Minor Leagues

Throughout each level of the minor leagues, a lot of time and effort is devoted to travel. A more productive model would be for an entire level playing in one location. Spring training’s Grapefruit and Cactus Leagues are a great example. Like spring training, the goal of the minor leagues is to develop, not to win. In this system, players would have more time to work on strength, durability, and skill development. This system could be in effect until the prospect reaches Double-A. At that level, players could start assimilating themselves to playing ball all over the map. However, this is merely a pipe dream. The more realistic option to improving the minor leagues would be to raise each player’s salary.

In 2014, three ex-minor-league baseball players filed a lawsuit against Major League Baseball, commissioner Bud Selig and their former teams in U.S. District Court in California. Sports Illustrated attorney and sports law expert, Michael McCann, explained their case.

“The lawsuit portrays minor league players as members of the working poor, and that’s backed up by data. Most earn between $3,000 and $7,500 for a five-month season. As a point of comparison, fast food workers typically earn between $15,000 and $18,000 a year, or about two or three times what minor league players make. Some minor leaguers, particularly those with families, hold other jobs during the offseason and occasionally during the season. While the minimum salary in Major League Baseball is $500,000, many minor league players earn less than the federal poverty level, which is $11,490 for a single person and $23,550 for a family of four….

The three players suing baseball also stress that minor league salaries have effectively declined in recent decades. According to the complaint, while big league salaries have risen by more than 2,000 percent since 1976, minor league salaries have increased by just 75 percent during that time. When taking into account inflation, minor leaguers actually earn less than they did in 1976.”

Like many big corporations, MLB teams would never increase minor-league salary just because it is the right thing to do. What’s in it for them? Think about it like this.

economics-milb

At point A, when the average MiLB player has a wage set at W2, the player will take Q2 hours out of the day to work toward baseball. As you can see, there is room to improve, as point B is optimal. Accomplishing point B would mean increasing a player’s salary to W1. In turn, players could afford to take Q1 hours out of the day toward baseball. With most minor-league players needing to find work in the offseason or even during the baseball season, a raise in salary would give them the opportunity to be full-time baseball players. These prospects would spend more time mastering their craft, speeding up the developmental process.

With a season as long as 162 games, there is no telling how much depth could be needed in a given year. Just ask the Mets. That’s why it is important to maximize the development in a team’s farm system. At the end of the day, this is merely a marginal benefit. It will not take an organization’s farm system from worst to first. However, it only takes one player that unexpectedly steps up in September to alter a playoff race, proving worth to the investment.


The St. Louis Cardinals Have a Type

This series will cover various trends I’ve observed major-league baseball teams following. Some trends will be analytical while others will be more…”conceptual.” Trends may span a season, or even several, it doesn’t matter, I don’t want to limit myself out of the box. Ideally, I’d like to cover all 30 teams, but I also don’t want to expect too much of myself out of the box, either. After all, I don’t have Francisco Lindor’s smile to pull it off.

Image result for francisco lindor trips on bat gif

Maybe that kind of thinking is limiting — not the part about Lindor’s smile (though in a weird way it does tie in), but maybe I like to undertake something with the caveat that I might not follow through because of experience, mine or others (see Stevens, Sufjan — 50 states project). Or maybe I don’t want to underestimate the extent of my laziness. Or maybe I’m just a glass-half-empty kind of guy…

And maybe all of this relates to my face.

From Wikipedia: “Physiognomy is the assessment of a person’s character or personality from his or her outer appearance, especially the face.”

It’s no secret that we’re all judged on our outer appearance. Some studies have shown it even relates to how well we’re paid. A predisposition towards handsome exists in baseball, too. It’s in the old scouting maxim, “the good face,” which essentially is the baseball colloquialism for “hottie.” But it can also refer to the potential presence of naturally-elevated levels of testosterone, as a strong jaw and well-defined cheekbones are sometimes indicative of the hormone.

Hogwash! Right? Well, have you ever wondered what it would be like to look like Brad Pitt and thought about how differently people would react to you? Now, I’m not talking about a matter of right or wrong, but people would generally respond more positively to you, both socially and professionally, and that does have an impact on confidence, which plays a massive, albeit intangible role in a baseball player’s on-field success.

But, come on. With all the advanced methodology we have to evaluate players, isn’t the “The Good Face” adage a thing of the past? I’m sure it’s probably lost some of its weight in the player-evaluation process, but it hasn’t disappeared. In fact, in the evaluation process used by (arguably) the most successful team of this decade, it’s very much alive. In recent memory, there have been enough handsome doppelgangers in their mix to wonder if the “Cardinal way” isn’t some iron-clad philosophy the organization established to allow them to get the most out of their young players, but that it might just be a certain type of guy!

You’re at FanGraphs, and so I assume you’re a savvy individual and that you know a ruse when you read one, but I want to qualify this writing by saying that this proposition is roughly ~0.0000000000000001% serious. Okay, so essentially, there are six archetypes for Cardinals players’ faces.

  1. The Wain-Os

oval

Pseudoscience says: “If you have an oval face shape, you always know the right things to say.”

wain0

2. The Kozmakazies

square

Pseudoscience says: “If you have a square-shaped face, you are gung-ho and a total go-getter.”

squaress

3. The DesCarpenSons

rectang

Pseudoscience says: “You value logic and you’re a really good thinker. Plus, you’re an awesome planner.”
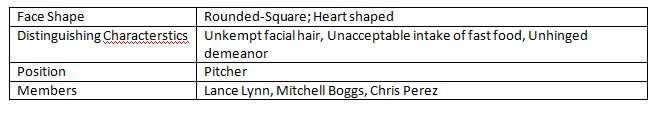
4. The Lynnburger

heart

5. The Ambiguous Pham

ambig

Pseudoscience says: “If you have a diamond face shape, you’re a control freak. You’re very detail-oriented…”

6. We Don’t Want No Scruggs

oblon

Pseudoscience says: See the Wain-Os

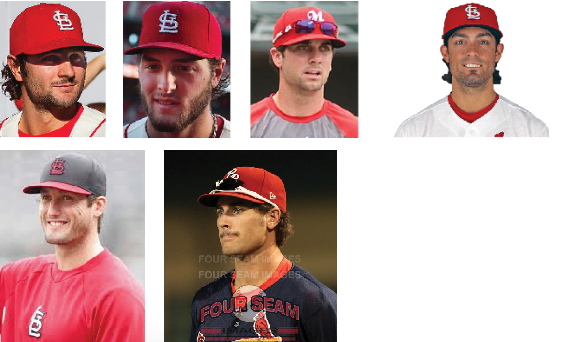
Yes, it helps they’re in the same uniform, and yes, I very obviously cherry-picked some of those, but aren’t you still a little floored? The variation here rivals the lack of distinguishability featured among the male contestants on the Bachelorette.

So isn’t this proof of old-school scouting at work? What gives with all the talk of the Cardinals’ cutting-edge front office — are they just masquerading with the hiring of NASA data analysts and organizational philosophies? Or have they truly married the new school and old school? Maybe there is something to building a roster of similar-looking players that prevents “fault lines” from forming.

Or maybe…

Think back to the hacking scandal of 2015. The Cardinals’ new Director of Scouting, Christopher Correa, hacked the Astros’ database for information on players regarding the draft, bonuses, and trade talks. Keep in mind, he was working for the Cardinals, not a brand-new expansion team; he could’ve hired anyone he wanted to work for him. He could’ve had his own NASA data analyst, just like Jeff Luhnow had done before him. I know that in the minds of these men, there’s a lot at stake, and so they look for any competitive advantage they can, but this scenario feels like it’s the smartest kid in class copying off the other smartest kid in class on a math test.

So what did Jeff Luhnow have access to that Correa didn’t?!

It was one file, actually. A file buried deep within the infrastructure of the Astros’ database. A file called “Stardust” (Yes, like in Rogue One). Allow me to explain.

This is daughter Luhnow. Her name and age are unknown (Jeff did not respond to my tweets), but my wife estimates her to be 19 in this photo. If we work off that number, she’s at least 20 now, and that means she’s probably been able to identify boys she thinks are cute for around 15 years, which lines up perfectly with when her dad was hired by the Cardinals in 2003.

Imagine it, “it’s easy if you try;” one day, a five-year-old daughter Luhnow wandered into her dad’s office and climbed up onto his lap while he was looking at some files of some players he was targeting to acquire. Mostly just talking to himself, Jeff explained the pros and cons of each player to his daughter and showed her their pictures. When he got to a young pitcher in the Atlanta Braves’ farm system, she put her hands to her mouth and giggled. “What’s so funny?” Jeff asked his suddenly-bashful daughter. Her face was nuzzled in her dad’s chest, so the words were a bit muffled, but Jeff heard them clear as day. “He’s cute,” she responded.

It was a strange moment for Jeff — he wrestled back the protective instincts welling up inside him, but as he looked at the picture of the lanky, young right-handed pitcher, he realized that she wasn’t wrong. Adam Wainwright was handsome in an awkward, President’s son kind of way.

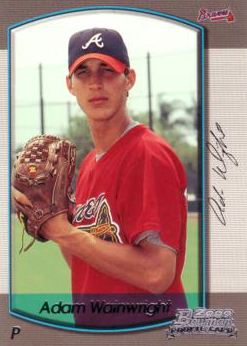
While this was the deciding factor for Jeff, he was thrilled that he wouldn’t have to admit that to his bosses, because Wainwright was also a top-100 prospect. So the Cardinals sent J.D. Drew and Eli Marrero to the Braves for Wainwright, Jason Marquis, and Ray King (an admittedly motley crew).

Jeff remembered that moment and would, from time to time, call his daughter into his office and gauge her reactions to the players he’d show her. Eventually, however, he didn’t need to call her in anymore. Daughter Luhnow liked baseball, and liked looking at the pictures of the young men; it was like reading a Teen Beat magazine with her dad!

Before I go any further, I want to note that this is one of those conceptual pieces I referred to in the intro, and that the parts about daughter Luhnow are entirely fictitious. There are also no underlying misogynistic themes at play here. I believe a woman could run a major-league baseball team as well as any man — I just think the idea of a team as renowned and successful as the Cardinals being run on the lustful whims of a teenage girl is really funny.

So the way I see it, she had her own Excel spreadsheet where she could rate the features of potential acquisitions on the same 20 – 80 scale as scouts. She could comb through high-school, college, minor-league, and major-league rosters and highlight her favorite guys by coming up with an overall score.

This authoritative list, while completely undisclosed until now, has unwittingly been at the center of a couple of controversies. It is what ultimately drove the wedge between Walt Jocketty and the Cardinals, and also, as previously mentioned, is the holy grail that Christopher Correa was in search of when he hacked the Astros’ database — and what he is currently serving a 46-month jail sentence for.

About the moves that Correa made without the elusive “Stardust” file. He had an idea of her type of guy based on previous transactions, and he was able to make some quality, daughter-Luhnow-inspired acquisitions. Of course, that’s hardly a silver lining. Try explaining to your cell mate that you’re in prison for hacking into someone else’s computer for a list of cute, young men (some of which are still in high school!).

You get it. You’re on board. The Cardinals’ success has largely been driven by a teenager’s romantic fantasies. Okay, maybe not. Regardless, I still have a hard time telling the difference between Adam Wainwright and Michael Wacha and I want to see if you are any better. Here are eight pictures of the two Cardinal pitchers, four of each; in the comments section, please attempt to sequence these correctly, and that’s it. This is what happens in the doldrums of the offseason!

answer-key


G-Beards v. W-Snappers: A New All-Star Event

A lot has been written about the youth movement in professional baseball. A bulge of pre-arb and arb-eligible studs are pushing out the hobbled gritty vets and reworking how the old ballgame is played, structured, and thought about. Aside from bullpen usage, this may be the biggest current trend in baseball, and the defining trait of the post-Moneyball, big-data, and steroid eras. The value and role remaining for baseball’s seniors is a question playing out on the field (Trea Turner) and in contract negotiations (Jose Bautista and Mike Napoli). But what if it was actually played out straight-up man versus child, craft versus skill, knee brace versus jock strap, once a year? A one-game exhibition between under-24s and over-34-year-olds. Graybeards versus Whippersnappers.

While the All-Star Game promises to be more entertaining now that Bud’s “This time it counts!” policy is no más, the majority of FanGraphs fans still likely prefer the weekend’s other event, the Futures Game. It’s a chance to see the abstract names and grades we’ve read about for so long on a real major-league diamond, showing what they can do against similar talent. A youth-versus-veteran competition would offer the same kind of spectacle. A chance to see how well the recently devalued old-timers, with their guile and years of experience, do against the heralded up-and-comers, with their loose swings and swagger. Who wouldn’t want to watch that? It would give players left off the All-Star roster but having respectable seasons a chance for publicity, and help create more generational fraternity among players in a way not based on locker-room hazing. It would be fun — there are not many avenues for inexperienced labor to directly challenge their seniors in any field of work — and I think it would also be surprisingly competitive.

Let’s imagine what this might have looked like last year in San Diego, using WAR leaders (100 PA or 10 innings pitched minimums) through the first half of the season for players 24 and under and 34 and older, not in the All-Star Game. For the actual selections, if this event ever took place, each team could send a player that fits each age bracket, or status quo could be maintained and fans could vote (in which case, I have a feeling Bartolo would start every year he’s not an All-Star).

Graybeards

Starters

(C) David Ross

(1B) Adrian Gonzalez

(2B) Ian Kinsler

(3B) Adrian Beltre

(SS) Jimmy Rollins

(OF) Nelson Cruz

(OF) Ichiro Suzuki

(OF) Curtis Granderson

(DH) Jose Bautista

Reserves

(OF) Rajai Davis

(2B) Chase Utley

(2B) Aaron Hill

(C) Victor Martinez

(OF) Jayson Werth

(OF) Marlon Byrd

(1B) Mike Napoli

(3B) Juan Uribe

(OF) Matt Holliday

(1B) Albert Pujols

(OF) Ryan Raburn

(C) A.J. Ellis

(OF) Coco Crisp

(OF) Nori Aoki

(2B) Brandon Phillips

(C) A.J. Pierzynski

Pitchers

Rich Hill

Adam Wainwright

John Lackey

CC Sabathia

Colby Lewis

Jake Peavy

Hisashi Iwakuma

R.A. Dickey

James Shields

Jonathan Papelbon (worth the price of admission)

Francisco Rodriguez

Brad Ziegler

Joe Blanton

Oliver Perez

Jason Grilli

Koji Uehara


Whippersnappers

Starters

(C) Christian Bethancourt

(1B) Miguel Sano

(2B) Jose Ramirez

(3B) Nick Castellanos

(SS) Trevor Story

(OF) Christian Yelich

(OF) Gregory Polanco

(OF) Joc Pederson

(DH) Javier Baez

Reserves

(2B) Jonathan Schoop

(3B) Maikel Franco

(2B) Rougned Odor

(SS) Tim Anderson

(2B) Jurickson Profar

(OF) Nomar Mazara

(OF) Michael Conforto

(OF) Max Kepler

(OF) Mallex Smith

(SS) Eugenio Suarez

(SS) Chris Owings

(OF) Byron Buxton

(1B) Tommy Joseph

(3B) Cheslor Cuthbert

(OF) Delino DeShields

(OF) Jorge Soler

Pitchers

Aaron Nola

Vince Velasquez

Carlos Martinez

Joe Ross

Lance McCullers

Michael Fulmer

Jon Gray

Robbie Ray

Carlos Rodon

Zach Davies

Matt Wisler

Julio Urias

Taijuan Walker

Blake Snell

Roberto Osuna


Those are pretty interesting lists of names. All-time greats like Ichiro and Pujols against great career starts like Odor and Story. The AL ROY (Fulmer), many former top prospects, and familiar names make up the pitchers. Almost all the elder statesmen have played in an All-Star Game before, and it’s likely many of the youngsters will get their chances soon. Some 2016 borderline All-Star snubs like Beltre, Kinsler, Yelich, Cruz, and Polanco would have had an opportunity to show what they can do in San Diego. Clearly, the lists show that shortstops don’t last as long and catchers take a while to mature. Youth is heavy on starters (suggesting they will either flame out or be converted to relievers) while age has more relievers sticking around, racking up WAR.

The W-Snappers’ position players edge the G-Beards in total WAR (26.7 to 19.2) and average wRC+ (103.8 to 98.04), but trail in rate stats (7.3 to 9.3 BB% and 23.4 to 18.2 K%) that tend to refine as players age. Counting stats show that under-24s lead in strength and speed (233 to 224 home runs and 96 to 78 stolen bases) despite having nearly 1000 fewer total plate appearances. Age wins in the “old-school” counting stats RBI (850 to 787) and runs (864 to 799). These tallies and plate appearances suggest that teams continue to use their veteran players more often and higher up the lineup than might be prudent. But the game would be a chance to see if savvy situational hitting by aged hitters, in fact, met the eye test. Despite these stats, it would be hard to bet against a lineup with Bautista, Beltre, Kinsler, and Cruz, but I do wonder if that is that only because I’ve been seeing those names for years? Surprisingly, both sides pull the ball and hit for hard contact at nearly the same rates (around 32 and 40% of the time respectively), although the younger players are luckier, with a 29-point higher BABIP (.317 to .288), likely due to their speed.

For pitchers, the two arsenals come in with nearly identical ERAs (3.9 for youth and 3.8 for age), BB/9 (around 3/9), and K/9 (around 9/9), but again the younger players have the edge in total WAR (21.9 to 15.8). Contact (77%), Zone (48%), Swing (46%), and Hard Contact (31%) rates are all uncannily similar across both teams. I suspect the similarities are because the sampling of player quality is roughly equivalent, but I had wondered if there would be more noticeable differences in how pitchers on opposite ends of the age spectrum were getting hitters out (nibbling and generating weak contact, for example).

To make the game more about the players, there would be an additional rule: player-managers for both sides. This would be a chance for managerial hopefuls like David Ross to audition and stir their dogged age-grades against the ravages of time. On the other side, young clubhouse leaders could emerge and rally their cohort against the stubborn establishment. Baseball is about rituals, and what is a more eternal ritual than coming-of-age ceremonies in which fathers initiate young men into adulthood, but not before a challenge of brawn? Imagine the storylines: brush-backs, pick-offs, and Ichiro beating out an infield single would all take on new meanings. Names would be made and stars would fade honorably into fatherly roles who could still show they had it.

Would players go for it? Probably not. They wouldn’t want to label themselves as old, and might see the game as a gimmicky sideshow to the weekend’s main attraction, where everyone would rather be playing. If it were going to work, it would need to be branded in a respectful way: MLB’s Mentorship Game (sponsored by The Boys and Girls Club of America!) between veterans and young guns. The Player’s Union would probably not like older players missing their chance to rest during the break, but it also might be enticing as an opportunity to demonstrate that both vets and youth have a place in the game, and that aging players should receive more contract interest and younger players should have more early-career leverage.

I highly doubt many emerging players would miss a chance to hang out with their elder heroes and show them up during All-Star weekend. So, the question is, what say you, Napoli and party — challenge accepted?


Running Into an Out as a Strategy

I tried to come up with a witty preamble to this but all I could come up with was a lame story about playing RBI Baseball 4 against my older brother. And unless you have mistakenly come to FanGraphs while trying to get to Farmers Almanac (no judgments, Google auto-complete can be weird sometimes) then you probably don’t care about that. So let’s dispense with the amusing introduction and get right to the question. (Or did I just subversively come up with a witty preamble by explaining how I did not have a witty preamble?!)

Scenario:

Runner on first with two out. 0-2 count.

Now anyone who is even slightly familiar with baseball will tell you that this is not a good situation for the offence. Those who are very familiar with baseball to the point that they read things like this post will probably even quote the run expectancy matrix to demonstrate how bad of a situation this is for the offence.

So, yeah, not looking good for the offence. The chance of scoring a run from that base/out state is 0.127. And that is without even accounting for the 0-2 count which obviously makes things worse. MLB as a whole slashed .155/.187/.237 with a 47.6 K% and a 10 wRC+ last year through two-out, 0-2 situations with runners on. In other words, the batter made the third out ~80% of the time. Even Mike Trout, who is Baseball Jesus, strikes out over half the time in 0-2 counts and is running a tOPS+ that is almost single digits. For all intents and purposes, the inning is likely over when it hits that situation.

But the team at the plate is not totally powerless. It can still decide how to end the inning, and they could do it in a way that gives them a more favourable outcome. Which brings me to the crux of this argument;

Why not have the guy on first just take off running?

Before the pitcher even comes set, just take off for second. Worst case, they tag him out and the inning ends (which was the most likely outcome anyway), but now the guy at the plate leads off the next inning in a fresh count, which is obviously a much more favourable scenario for a hitter. And best case, the defence screws up and the runner is now on second. Granted, that is an extreme outcome, and even two out and runner on second is still not a great scoring scenario. But referring back to the run expectancy matrix, it’s ~50% higher than when he was standing on first.

If the outcome of the scenario is almost overwhelmingly going to be an out, then you are not really giving away an out as much as you are just deciding who takes the out. If you have a good hitter at the plate, why have him continue to hit in what is a pretty futile situation, and waste one of his limited PAs, when you can reset the situation and give him what amounts to an extra PA by having the runner take the out instead?

Let’s look at Mike Trout’s career as an example since, well, since it’s fun to look at Mike Trout’s numbers.

No surprise, Mike Trout is a much, much, much better hitter overall than he is in 0-2 counts. Every hitter is. Now let’s also check back in with our friend, the run expectancy matrix.

So right off the bat (no pun intended), we see that the chances of scoring a run at the start of any inning are considerably better than scoring a run with two outs and a runner at first. Add in the fact that you have a very good hitter leading off in Trout and things have seemingly changed significantly for the better, simply by having your base-runner act like an 11-year-old exchange student on the base paths.

If Trout does anything to get on first (single, walk, HBP, dropped third strike, coming to the plate and performing a stand-up routine that is so good the opposing team just awards him first as a thank you, etc etc), now all of a sudden the chances of scoring a run in the inning have gone up to 0.416. Given that Mike Trout got on base nearly 45% of the time last year and is around 40% for his career, it seems like a fairly reasonable outcome. So by having your base-runner deliberately make an out to end the previous inning and saving Trout from doing so, you have gone from a situation where you had a .127 (or lower given the fact that the 0-2 count is not accounted for in the matrix) chance of scoring a run and your best hitter producing an out to a situation where you very likely have a 0.416 chance of scoring a run. And that does not even account for all the other things Trout might do new in this new PA. If he hits a lead-off double, your chances of scoring a run in the inning are now 0.614. If he hits a lead-off home run, your chances of scoring a run are….hold on, where is my calculator? Plus, you have also avoided what was highly likely an out for your best hitter and having to wait two or three innings for him to bat again.

Last year, MLB teams averaged 219 PAs where they had runners on and an 0-2 count. As stated above, in that situation the hitter wound up making the third out ~80% of the time. So that is ~200 innings that could have started with a different guy at the plate and ~200 outs at the plate that could theoretically have been something other than an out. How many innings would have been different by simply giving up the runner for the third out and letting the hitter lead off the next inning in a more favourable count? If you have a good hitter at the plate and he is down 0-2, it might be worthwhile strategy to just tell your base-runner to take off and let your hitter try again the next inning.

Or maybe I have had too much coffee today.