Archive for Outside the Box

Designated Fielders and Free Pinch-Runners

Most of the all-time great hitters, since I’ve been watching, are terrible fielders.  Sorted by wOBA, here are the top 15 hitters since the year 2000 and their cumulative career defensive scores.

Barry Bonds -37.7
Manny Ramirez -212.6
Larry Walker -7.2
Albert Pujols -78.8
Mike Trout 10.8
Miguel Cabrera -143
Todd Helton -88.6
Joey Votto -49.7
Alex Rodriguez 41.5
Jim Thome -145.5
Lance Berkman -109.9
Jason Giambi -150.8
Carlos Delgado -149.8
Chipper Jones -32.3
Paul Goldschmidt -37.2

 Here’s the top 15 cumulative defensive scorers, along with their ISO scores. Jim Thome had an ISO of .288, for reference.

Adrian Beltre 0.196
Yadier Molina 0.116
Andruw Jones 0.235
Placido Polanco 0.101
Scott Rolen 0.207
J.J. Hardy 0.159
Juan Uribe 0.164
Ivan Rodriguez 0.170
Jimmy Rollins 0.155
Chase Utley 0.199
Russell Martin 0.145
Ramon Hernandez 0.155
Jack Wilson 0.101
Brian McCann 0.195
Craig Counsell 0.089


The guy who can knock the crap out of the ball and the guy who can make the SportsCenter highlight defensive plays are usually different people.  Unfortunately, this tradeoff only really hurts fans.  The ‘defensive replacement’ comes in late in games and is rarely noticed.  We like web gems, and we like bombs, why not have both?

We’ve probably never seen the world’s best defensive player.

Hitting an MLB fastball is hard.  It’s a very specific, rare skill set.  Playing outfield, however, is something to which athletes from other sports could adapt.  I bet Cam Newton could play right field, for example.  There are some soccer goalies who could probably play shortstop.  There are guys at every position that are wasting away in the minors or worse because they can’t hit the elite pitching.  If there’s a freak athlete that can jump and catch balls three feet over the wall, I want to see it.

The designated fielder prevents injuries and keeps the stars in the game.

I’m having trouble finding data, but my guess is that a fair portion of playing injuries happen on defense.  Especially for outfielders running into each other and walls.  A designated fielder takes guys prone to aches and pains off the field but lets them contribute on offense, even in the National League.  It also makes big contracts less risky in the National League, which might lose out on an aging slugger like Albert Pujols.

It adds an element of strategy.

There will be tremendous temptation to play a catcher as your designated fielder.  They make your pitchers better and prevent stolen bases.  That said, what if you had a second-best catcher who could hit but an excellent outfielder who can’t hit?  The decision gets cloudy.  Teams might strategize based on the potential base-stealing skills of the opponent versus their expectations of fly balls.

A designated baserunner too?

My vision of the designated baserunner is more like a once-a-game power up you can use rather than a permanent fixture.  I’ve always though it was sort of lame that you had to take a guy completely out of the game to get somebody to run for him.  Currently, that dooms pinch-runners to the eighth or ninth inning.  Well, I and most fans enjoy stolen-base attempts and guys stretching a hit for an extra base.  It’s one of the more exciting parts of the game.  We know Albert Pujols isn’t going to steal too often.  Most catchers aren’t exactly speed demons either.  So, I propose, once a game, managers will be able to pinch-run without making the guy leave the game.  Could you imagine Usain Bolt on the base pads?  If teams wanted speed bad enough, it’s possible.

The right equilibrium.

I like to see baseball with a constant ebb and flow of teams threatening to overtake each other.  The designated fielder adds one more guy who can hit to the lineup.  Defensive shortstops and catchers won’t be weakly grounding out and popping up quite so often.  The ball will be in play more often and will sometimes be negated by amazing plays by the designated fielder.  Catchers with rocket arms will be behind the plate more often.  But, they’ll face more elite baserunners.  Would you pitch around Giancarlo Stanton, if you knew an elite baserunner would run for him?   Do you bring on a lefty to hold the runner on?

I favor letting pitchers hit, however.  I see this as a National League first experiment.  The sacrifice bunt attempt is a pretty exciting part of play, and the shock of watching a hurler rope a hit to left-center is worth it.  I don’t want to be inundated with offense; just enough to spice things up a little.

Any thoughts?


A Discrete Pitchers Study – Out & Base Runner Situations

(This is Part 4 of a four-part series answering common questions regarding starting pitchers by use of discrete probability models. In Part 1 we explored perfect game and no-hitter probabilities, in Part 2 we further investigated other hit probabilities in a complete game, and in Part 3 we predicted the winner of pitchers’ duels. Here we project the probability of scoring at least one run in various base runner and out scenarios.)

V.  I Don’t Know’s on Third!

Still far from a distant memory, the final out of the 2014 World Series was preceded by an unexpected single and a nerve-racking error that brought Alex Gordon to 3rd base with two outs. Closer Madison Bumgarner, who was on fire throughout the playoffs as a starter, allowed the hit but would be left in the game to finish the job. There is some debate as to whether Gordon should have been sent home rather than stopped at 3rd base , but it would have taken another error overshadowing Bill Buckner’s to get him home; also, next up to bat was Salvador Perez, the only player to ever ding a run off Bumgarner in three World Series. So even though the Royals’ 3rd Base Coach Mike Jirschele had to make a spur of the moment critical decision to stop Gordon as he approached 3rd base, it was a decision validated by both statistics and common sense. We will show our own evidence, by use of negative multinomial probabilities, of how unlikely the Royals would have scored the tying run off of Bumgarner with a runner on 3rd with two outs and we will also consider other potential game-tying or winning situations.

Runs are generally strung together from sequences of hits, walks, and outs; in the situations we will consider, we will only focus on those sequences that lead to at least one run scoring and those that do not. Events not controlled by the batter in the box, such as steals and errors, could also potentially reshape the situation and lead to runs, but we’ll take a very conservative approach and assume a cautious situation where steals are discouraged and errors are extremely unlikely.

Let A and B be random variables for hits and walks and let P(H) and P(BB) be their respective probabilities for a specific pitcher, such that OBP = P(H) + P(BB) + P(HBP) and (1-OBP) is the probability of an out; we combine the hit-by-pitch probability into the walk probability, such that P(BB) is really P(BB) + P(HBP) because we excluded hit-by-pitches from our models, P(HBP) > 0 against Bumgarner in the 2014 World Series, and the result on the base paths is the same as a walk. The first negative multinomial probability formula we’ll introduce considers the sequences of hits, walks, and an out that can occur after two outs have been accumulated, setting the hypothetical stage for the last play in Game 7 of the 2014 World Series.

Formula 5.1

In the 2014 World Series, Bumgarner’s dominantly low P(H) and P(BB) were respectively 0.123 and 0.027 and his (1-OBP) was 0.849; by applying these values to the formula above we can generate the probabilities of various hit and walk combinations shown in Table 5.1. The yellow highlighted cells in the table represent the combination of hits and walks that would let Bumgarner escape the inning without allowing the tying run (given a runner on 3rd with two outs and a one run lead). By combining these yellow cells, we see that the odds were overwhelmingly in in Bumgarner’s favor (0.873); all he had to do was get Perez out, walk Perez and get the next batter out, or walk two batters and get the third out.

Table 5.1: Probability of Hit and Walk Combinations after 2 Outs

0 Hits 1 Hit 2 Hits 3 Hits 4 Hits
0 Walks 0.849 0.105 0.013 0.002 0.000
1 Walk 0.023 0.006 0.001 0.000 0.000
2 Walks 0.001 0.000 0.000 0.000 0.000
3 Walks 0.000 0.000 0.000 0.000 0.000
4 Walks 0.000 0.000 0.000 0.000 0.000

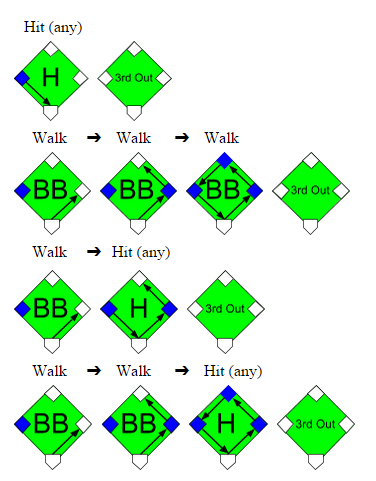
The Royals could have contrarily tied the game with a simple hit from Perez given the runner on 3rd and two outs, yet this wasn’t the only sequence that would have kept the Royals hopes alive. Three consecutive walks, one walk and one hit, or any combination of walks and one hit could have also done the job; examples of these sequences are shown in the graphics below:

Graphic 5.1

Generally, any combination of walks and hits not highlighted yellow in Table 5.1 would have tied or won the World Series for the Royals. This glimmer of hope was a quantifiable 0.127 probability for Kansas City, so it was justified that Gordon was kept at 3rd rather than sent home after shortstop Brandon Crawford just received the ball. It would have taken an error from Crawford or Buster Posey, with respective 0.033 and 0.006 2014 error rates, to get Gordon home safely. The probability 0.127 of winning the game from the batter’s box is noticeably three times greater than the probability of winning it from the base paths (where Crawford and Posey’s joint error probability was 0.039).

We should note that the layout in Table 5.1 is a simplification of what could occur with a runner on 3rd, two outs, and a one run lead, because it only applies to innings where a walk off is not possible. In innings where a walkoff can occur, such as the bottom of the 9th, the combinations of walks and hits captured in the red highlighted cells are not possible because they would occur after the winning run has scored and the game has ended. However, Bumgarner was so dominant in the World Series that these probabilities are almost non-existent, thereby making our model is still applicable; we would otherwise exclude these red-celled probabilities for less successful pitchers.

The next probability formula considers the sequences of walks, hits, and outs that can occur after one out has been accumulated, which is situation definitely worth examining if there is a lone runner on 2nd base.

Formula 5.2

Once again we’ll use Bumgarner’s 2014 World Series statistics to evaluate this formula and insert the probabilities into Table 5.2. According to the sum of the yellow cells, Bumgarner would be able to prevent the tying run from scoring (from 2nd base with one out) with a probability of 0.762 and would otherwise allow the tying run with a probability of 0.238.

Table 5.2: Probability of Hit and Walk Combinations after 1 Out

0 Hits 1 Hit 2 Hits 3 Hits 4 Hits
0 Walks 0.721 0.178 0.033 0.005 0.001
1 Walk 0.040 0.015 0.004 0.001 0.000
2 Walks 0.002 0.001 0.000 0.000 0.000
3 Walks 0.000 0.000 0.000 0.000 0.000
4 Walks 0.000 0.000 0.000 0.000 0.000

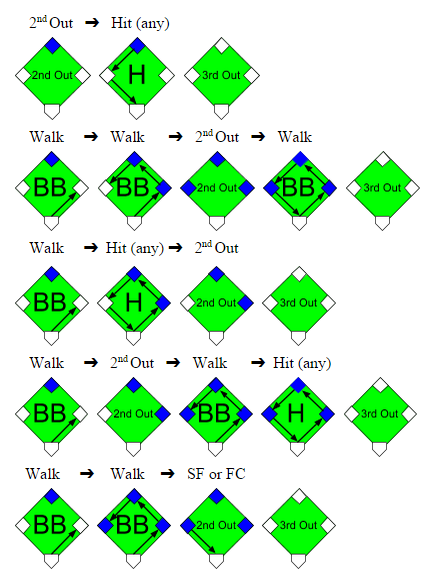
To get out of the inning unscathed, Bumgarner would need to prevent any further hits or allow fewer than 3 walks given a runner on 2nd with 1 out; it would be possible to advance the runner to on 3rd with 2 walks and then sacrifice him home in this situation (with no hits), but this probability is insignificantly tiny especially for a dominant pitcher like Bumgarner. Once again we depict these sequences that could get the tying run home from 2nd with 1 out, with the second out inserted randomly.

Graphic 5.2

A runner on 2nd base with one out is a scenario commonly manufactured in an attempt to tie the game from a runner on 1st with no outs situation. The logic is that if the hitting team is down by one run and the first batter leads off the inning with a single or walk, the next batter can control getting him into scoring position and hope that either of the next two batters knocks the run in with a hit. However, this method of control, a bunt, sacrifices an out to move the runner from 1st to 2nd. The defense will usually allow the hitting team to move the runner into scoring position for an out, but the out wasn’t the only sacrifice made. The inning is truncated for the hitting team with one less batter and the potential to have more hitters bat and drive in runs is reduced. Indeed, against a pitcher like Bumgarner, the out is likely not worth the meager 0.238 probability of getting that runner home.  We’ll see in the next section what exactly gets sacrificed for this chance at tying the game.

We should note that in this “runner on 2nd with 1 out” model we added few more assumptions to those we made in the prior “runner on 3rd with 2 outs” model, neither of which should be farfetched. The first assumption is that with the game close and the manager intent on tying the game rather than piling on runs, he should have a runner on 2nd base fast enough to score on a single. Another assumption is that the base runners will be precautious enough not to cause an out on the base paths, yet aggressive enough not to get doubled up or have the lead runner sacrificed in a fielder’s choice play. Lastly, we assume that the combinations of hits, walks, and outs are random, even though we know the current state of base runners and outs can have a predictive effect on the next outcome and the defensive strategy used. By using these assumptions we simplify the factors and outcomes accounted for in these models and reduce the variability between each model.

The final probability formula considers the sequences of walks, hits, and outs that can occur when we start with no outs accumulated; this allows to forge situation will allow us to forge the outcomes from a runner on 1st with no outs scenario and compare them to a runner on 2nd with 1 out scenario.

Formula 5.3

Table 5.3 below uses Bumgarner’s 2014 World Series statistics, the same as before, although in this model we deal with more uncertainty because the sequences captured in each box are not as clear cut between run scoring or not given a runner on 1st with no outs. The yellow and non-highlighted cells are still the respective probabilities of not allowing and allowing the tying run to score, however, we now introduce the green probabilities to represent the hit and walk combinations that could potentially score a run but are dependent on the hit types, sequences of events, and the use of productive outs. These factors were unnecessary in the prior two models because in those models any hit would have scored the run, the sequence of events was inconsequential, and the use of productive outs was unnecessary with the runner is already on 2nd or 3rd base (except when there is a runner on 3rd and a sacrifice fly or fielder’s choice could bring him home).

Table 5.3: Probability of Hit and Walk Combinations after 0 Outs

0 Hits 1 Hit 2 Hits 3 Hits 4 Hits
0 Walks 0.613 0.227 0.056 0.011 0.002
1 Walk 0.050 0.025 0.008 0.002 0.000
2 Walks 0.003 0.002 0.001 0.000 0.000
3 Walks 0.000 0.000 0.000 0.000 0.000
4 Walks 0.000 0.000 0.000 0.000 0.000

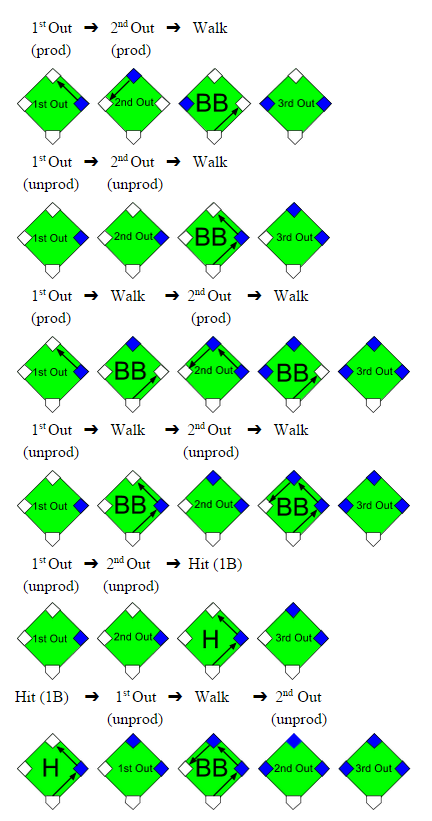
We must break down each green probability into subsets of yellow probabilities representing the specific sequences that would not score the tying run from 1st base with no outs; we depict these sequences below, but for simplicity, not all are depicted.

Graphic 5.3

Now that we know the conditions when a run would not score, we take the probabilities from the green cells in Table 5.3, narrow them down according to the proportion of sequences and the proportion of hit types that would not score the run, and separate them based on the usage of productive and unproductive outs; the results are displayed in Table 5.4. For example, there are 6 possible combinations for 1 hit, 1 walk, and 3 outs and 3 of these 6 combinations would not score the tying run on a single, where P(1B | H) = 0.755, with unproductive outs; yet, the run would score with productive outs, with unproductive outs on a double or better, or with unproductive outs and the other 3 combinations. When we finally sum these yellow cells, they tell us that an aggressive manager would score the tying run against Bumgarner with a 0.370 probability and Bumgarner would escape the inning with a 0.630 probability. Otherwise, a less aggressive manager would score the tying run with a mere 0.154 probability and Bumgarner would leave unscathed with a significant 0.846 probability.

Table 5.4: Probability of No Runs Scoring after 0 Outs

Productive Outs Unproductive Outs
0 Hits 1 Hit 0 Hits 1 Hit
0 Walks 0.613 x (1/1) 0.227 x (0/3) 0.613 x (1/1) 0.227 x (3/3) x 0.755
1 Walk 0.050 x (1/3) 0.025 x (0/6) 0.050 x (3/3) 0.025 x (3/6) x 0.755
2 Walks 0.003 x (2/6) N/A 0.003 x (6/6) N/A

We summarize the results from Tables 5.1-5.4 into Table 5.5 from the perspective of the hitting team.  We compare their chances of success not only against Madison Bumgarner from the 2014 World Series but also against Tim Lincecum, Matt Cain, and Jonathan Sanchez from the 2010 World Series.

Table 5.5: Probability of Allowing at least One Run to Score

2010 Tim Lincecum 2010 Matt Cain 2010 Jonathan Sanchez 2014 Madison Bumgarner
Runner on 1st & 0 Outs w/Unproductive Outs 0.305 0.224 0.531 0.154
Runner on 1st & 0 Outs w/Productive Outs 0.576 0.475 0.758 0.370
Runner on 2nd & 1 Out 0.382 0.288 0.543 0.238
Runner on 3rd & 2 Outs 0.212 0.154 0.318 0.127

Let’s return to the scenario that is the launching point for this study… The hitting team is down by one run and there is a runner on 1st base with no outs. If the game is in its early innings, where it is not mandatory that this runner at 1st gets home, the manager will likely decide against being aggressive and avoid sacrificing outs in order to increase his chances of extending the inning to score more runs; there are several studies supporting this logic. Yet, if the game is in the latter innings and base runners are hard to come by, the manager should lean towards utilizing productive outs and intentionally sacrifice the runner from 1st to 2nd base. His shortsighted goal should only be to tie the game.  By forcing productive outs rather than being conservative on the base paths, his chances of tying the game increase significantly (between 0.216 and 0.271) against our four pitchers given a runner on 1st and no outs scenario.

However, the if the manager does successfully orchestrate the runner from 1st to 2nd base with a productive out, he does still lose a little bit of probability of tying the game; between 0.132 and 0.215 of probability is lost against our pitchers. And if he decides to sacrifice the runner further from 2nd to 3rd base with another out, his team’s chances would decrease again by a comparable amount; this decision is ill-advised because a hit is likely going to be needed to tie the game and the hitting team would be sacrificing one of two guaranteed chances to hit in this situation. In general, the probability of scoring at least one run decreases as more outs are accumulated, regardless of the base runners advancing with each out. The manager could contrarily decide against sacrificing his batter if he has confidence that his batter can hit the pitcher or draw a walk, yet the imperative goal is still to tie the game. The odds of tying the game actually favor an aggressive hitting team that is able to get the runner to 2nd base with one out, by an improvement ranging from 0.012 to 0.084, over a less aggressive team with a runner at 1st with no outs. Thus, even though sacrificing the runner from 1st to 2nd base does decrease the chances of tying the game, it would be worse to approach the game lifelessly when the situation demands otherwise.


Which Cellar-Dweller Still Has a Chance?

Today we’re going to look at the teams in the cellar of their respected AL divisions. As it stands today, those teams are the Boston Red Sox, Chicago White Sox and the Oakland A’s. With a closer look at the numbers, I think we can find which team, if any, still has a chance of contending this year. Let’s start with the Boston Red Sox.

The Red Sox are currently 8.5 games back going into action today. They are 11-22 in the AL East and have an overall record of 32-41. They have a -43 run differential and a team ERA of 4.46. Starting pitching has clearly been the problem for Boston this year, and although the offense hasn’t been as bad as the other teams we’ll look at, it just hasn’t been enough to compete in a stacked AL East. The Red Sox are last among last-place teams in SP ERA (4.77), K/9 (7.08), BB/9 (2.86) and WHIP (1.34). And as the run differential shows, they haven’t been able to outscore opponents to make up for sub-par pitching. This combined with a tough division makes it hard to believe Boston can turn it around this year. And although a trade for a starting pitcher is possible, it still seems unlikely the Red Sox are one piece away from contending; from the look of things, it seems more like 2 or 3 pieces. But have no fear Boston, although the Red Sox have played poorly, they haven’t played as bad as the Chicago White Sox.

The White Sox were a trendy pick going into the season. With the addition of Jeff Samardzija, David Robertson, Melky Cabrera, Adam LaRoche and the return of Jose Abreu, it seemed like the White Sox could compete this year. So far, they’ve done anything but compete. They’re currently 11 games back in the AL Central and are 14-23 in the division. They have a -79 run differential, worst among last-place teams, and have a team ERA of 4.09. Unlike Boston, the White Sox starting pitching hasn’t been horrible; it hasn’t been great but it hasn’t been the reason for their lack of success. They lead all last-place teams in SP K/9 (8.36) and RP ERA (3.84). They’re also second in SP ERA (4.19) and BB/9 (2.62) but run into the same problem the Red Sox have — they play in an extremely competitive division, perhaps the best in the AL. With Kansas City, Minnesota and Detroit playing solid baseball, it has made the climb for the White Sox quite difficult.

What makes it harder, and perhaps the most shocking, is the White Sox aren’t hitting at all. They haven’t all year and show no signs of turning it around. They’re last among the cellar-dwellers in AVG (.237), wOBA (.282), BABIP (.282), OBP (.292), ISO (.108), K% (20.2) and BB% (6.3). All of that adds up to the worst statistical offense in baseball and hardly seems like an easy fix. GM Rick Hahn had what seemed like a productive offseason, and we’ll see if he can figure out a way to turn things around, but like the Red Sox, it doesn’t appear to be a simple fix. All that brings us to the final last-place team, the Oakland A’s.

The A’s, like the Red and White Sox, had a busy offseason, but unlike Boston and Chicago, no one really expected them to contend this year. Billy Beane blew up what was a successful 2014 squad in order to retool and make another run but so far it hasn’t exactly worked out this year. Oakland is 9 games back in the AL West, looking up at Houston, Texas, Los Angeles and Seattle. They have a 16-22 record in the division but have the only plus run differential (43) among last-place teams and rank second to the Houston Astros in the division with (47).

The A’s have succeeded where Boston and Chicago have failed. Oakland leads all last-place teams in SP ERA (3.00), BABIP (.271), BB/9 (2.68), HR/FB (9%), HR/9 (.81) and WHIP (1.22). They also stack up well in their division: the A’s are first in the AL West in ERA, BABIP, HR/FB, HR/9 and WHIP. Their offense hasn’t been bad either; along with their plus run differential, they’re first among last-place teams in AVG (.259), BABIP (.297) and OBP (.323). Although they can’t hit the long ball like Houston can, Oakland seems to have an efficient offense and good starting pitching, and both of those things could come in handy if the Astros start to falter down the stretch.

Oakland’s biggest issue seems to be the bullpen, as they’re last among last-place teams in RP ERA (4.77) and HR/9 (1.24). They’re also last in the AL West in RP ERA (4.77) and BABIP (.306). The Kansas City Royals showed everybody last year how important a shutdown bullpen can be and although Oakland has performed well in other categories, the bullpen seems to be hurting them the most. Another aspect of Oakland’s game that is hurting them is their defense. The A’s are currently last in the AL West with a -28.7 UZR; that’s more then double what any other division opponent has. If the bullpen can’t shut down the offense and defense isn’t doing you any favors, it becomes very hard to win enough games to contend.

But alas, all is not lost. The AL West is not nearly as competitive as the East or Central and although the Astros have played tremendous baseball, they’re still a young team that lives and dies by the home run. If Oakland can find a way to shore up the bullpen and defense, either through a trade or in-house, it’s not unlikely for them to make a run and cover some ground. They have 35 games left with AL West opponents and Houston seems to be the clear #1 enemy. The Rangers and Angels both seem like middle-of-the-road teams, neither succeeding or failing in any particular category but not dominant enough to move forward. The Astros’ bullpen and offense has been phenomenal this season, leading the AL West in RP ERA (2.62), BABIP (.236), K/9 (9.66), BB/9 (2.36) and WHIP (.94). And although their offense strikes out a lot, they’re leading the West in BB% (8.4%), ISO (.186) and wOBA (.320). They may swing and miss a lot but when they make contact, watch out. The reason to believe the West is still anybody’s to grab is Houston’s starting pitching. They’re last in the division in SP ERA (4.19) and HR/FB (11.5%) and second to last in SP BABIP (.297), K/9 (6.91), BB/9 (2.80) and WHIP (1.30).

Now we are getting closer to the trade deadline and making a move for a starting pitcher may behoove the Astros more so than any other division leader but if they can’t swing a deal, I think it definitely leaves the door open for a team to contend. As unlikely as it appears now, I wouldn’t be surprised if that team were the Oakland Athletics. They have to make moves to improve the bullpen and defense but with their efficient offense and quality starting pitching, I think they’re the only team in the division that can beat Houston and in turn, I believe they’re the only last-place team that still has a chance.


The Astros and Password Hygiene

Earlier this week, the New York Times reported on the FBI investigation of the Houston Astros’ compromised database and the current suspicion that the culprit are none other than the St. Louis Cardinals. The hacking of Houston’s proprietary in-house information sharing system, called Ground Control, caused major waves last year when Deadspin published excerpts from their internal discussions about players and trade negotiations. The Astros ended up with some egg on their face, and Jeff Luhnow was quoted as saying he was avoiding electronic communication during the early days of the known leak for fear that the Astros’ systems remained unsecured.

What is so shocking about the (alleged) penetration of the Astros’ systems by members of the Cardinals’ front office is that it does not appear to be a high-tech hack: according to the NYT, the likely intrusion vector was Astros’ general manager Jeff Luhnow’s own user credentials, which reused the same password that he had formerly used to access the Cardinals’ own proprietary system (codenamed Redbird) when he worked there.

Targeting credentials of users who reuse the same password to access multiple systems is a popular method of hacking. A surprising number of smart, highly-placed individuals (like Luhnow) often don’t perceive the risk that they take by using the same password across multiple accounts. Hackers look for sites and apps that have poor password security, steal the passwords from those less-secure places, and then test the passwords against higher-security systems. Some examples of poor password security practices include storing passwords in plain text in the database, not encrypting passwords with a one-way hash where the password can’t be taken back out of the database, or using an inexpensive encryption method that can easily be broken by throwing computing power at the problem. (The Cardinals were allegedly able to pull Luhnow’s password out of the database, so Redbird’s passwords were likely either stored in plain text or encrypted using a less-safe two-way encryption technique.)

Reusing passwords across multiple accounts is an example of poor “password hygiene”. As email addresses become increasingly popular as usernames, it has become easier to guess one half of the username-password credentials pair for a user of a site or application. The most effective strategy for proper password hygiene is to use a unique password for every account you have and to use a password manager to securely store those credentials. I use 1Password because it works on Mac, PC, iOS, and Android and stores credentials on my own devices rather than on someone else’s server, but there are plenty of other popular solutions such as LastPass, KeePass, and Dashlane.

An additional strategy for improved security is two-factor authentication (2FA). The idea behind 2FA is that you authenticate yourself with “something you know” (your password), and “something you have” (your phone). The second part can be a text message that’s sent to you when you log in, or a special code that is generated every few seconds that you can use as a sort of second password. Those special codes are generated using a hardware device (if you’ve ever seen an RSA keychain token, that’s an example of hardware 2FA) or by a software app such as Google Authenticator or Authy. 2FA helps protect you against someone stealing your password, because unless they also have your mobile phone, they can’t get into your accounts. Many sites feature 2FA as an option, and the list continues to grow.

My last piece of advice is to rotate passwords on a regular basis. 1Password reminds me when a given password has been in use for too long, and I can go ahead and change it. (It even flags accounts that have had reported breaches, which is a great help.) If Jeff Luhnow had been rotating his password regularly, even though the Cardinals (or whoever the bad guys were) started out with his credentials, they would have lost access whenever he rotated, which helps stop the bleeding of confidential information.

If you think you’re not important enough to be hacked, it can be an ugly surprise to discover that hackers target everyone. The consequences of sloppy hygiene could be your bank account being drained, your Gmail messages or your wedding photos being deleted, or your Facebook account being seized. These things happen to “normal” people every day. The additional effort for a little bit of extra security goes a very long way. The bad guys are often looking for the easiest targets. Making yourself a little harder to attack is the first line of defense.


Closer by Conference Committee: The Stats Behind the Congressional Baseball Game

The 2014–2015 offseason was not kind to Mike Doyle. The 10-year manager lost two of his team’s best hitters, and his ace pitcher is coming off shoulder surgery. Meanwhile, his opposite number, Joe Barton, has problems of his own. He has the impossible task of unearthing a pitcher capable of stopping Doyle’s offense, or else face a seventh straight loss to their archrivals in this year’s championship game. Yes, against all odds, and despite all your preconceptions, there’s a lot on the line at this year’s annual Congressional Baseball Game.

There’s plenty of uncertainty about what will happen this Thursday night, when Doyle’s Democrats meet Barton’s Republicans under the Nationals Park floodlights. But one thing we don’t have to be unsure of is the numbers. One year ago, I posted here at FanGraphs about a groundbreaking new dataset: advanced metrics for the most legit office baseball league of all time. (Thanks to those of you who responded favorably—and who didn’t immediately laugh me out of the virtual room. Your reward is 1,500 more words on the subject!)

The CBG’s own mini FanGraphs Leaderboard—looking suspiciously like a Google spreadsheet—is now updated with the past six years of statistics (as always, many thanks to the game’s dedicated scorekeepers who provided the data). Like the real FanGraphs Leaderboard and individual player pages, it is divided into Standard, Advanced, and Value statistics, all calculated according to this site’s official methodology. Figures earlier than 2009 and more advanced than those three sections are sadly unavailable (my FOIA for Pitch F/X data is taking forever…).

Of course, any statistics are meaningless without context, so I’ll give you some. Here’s how the teams break down for what’s likely to be the closest Congressional Baseball Game in years.

Projected Democratic Lineup

Player Slash Line wRC+
SS Tim Ryan .500/.500/.600 130
2B Raul Ruiz .333/.429/.500 107
P Cedric Richmond .833/.882/1.167 238
CF Patrick Murphy .600/.750/1.000 193
LF Jared Polis .583/.600/.750 153
1B Joe Donnelly .286/.412/.357 92
C Chris Murphy .250/.333/.250 67
3B Hakeem Jeffries .333/.333/.333 74
RF Kurt Schrader .500/.667/.500 144

The once-mighty Democratic offense (averaging 15.2 runs per game the past six years) has major holes to fill this year at third base and in the leadoff slot. Since 2009, 3B Tim Bishop and OF Adam Smith have each generated 8 wRC, a mark exceeded by only one other congressional ballplayer; both are gone this year. Bishop, a patient-but-lumbering Adam Dunn–type, was designated for assignment by the voters of New York last November, while veteran tablesetter Smith (.444/.565/.500) is a casualty of hip surgery.

However, that still leaves the Democrats with four elite hitters—the top four, in fact, going by WAR for position players. Florida’s Patrick Murphy (.687 wOBA) and Colorado’s Jared Polis (.556 wOBA) have demonstrated impressive power, while the more speed-dependent Tim Ryan of Ohio feels like a natural successor to leadoff. But these swing-state swingers don’t even play in the same universe as Louisiana congressman Cedric Richmond. The man does everything: walk (29.4% BB%), hit for power (.333 ISO), and, oh yeah, pitch (spoiler alert!; see below). His offensive runs above replacement, at 6.7, is higher than the rest of the Democratic roster combined (6.0). It’s little wonder that GOP manager Barton opted to intentionally walk him three times in last year’s game. When a guy’s slugging percentage (1.167) indicates he averages over a base per plate appearance, he probably deserves a free pass every time he’s up this year.

Beyond the starting nine, the Democrats have a few nice complementary pieces off the bench. Pinch-running artist Eric Swalwell has scored five runs and stolen five bases in just two games, causing him to lead the league in wSB and Base Running value. Jersey number IX (for Title IX) Linda Sánchez, the only woman on either roster, is a feared pinch-hitter with her .857 OPS.

The one weak spot in the order—as in many an MLB lineup—may be catcher, where Connecticut Senator Chris Murphy has OPSed just .583 since 2009. However, his job is safe, as Democratic coaches swear by his defense and game-calling ability. Defense has been a team-wide Democratic focus during their current winning streak; the team hasn’t made an error in its last two games. More tellingly for the FanGraphs crowd, Republican batsmen have a .338 BABIP off Dem pitcher Richmond—pretty low for a league of 50-year-old fielders covering a big-league-sized field. (By comparison, Democratic hitters have a .476 BABIP the past six years, reflecting a less polished GOP defense.)

Projected Republican Lineup

Player Slash Line wRC+
3B Jeff Flake .286/.286/.500 85
2B Kevin Brady .313/.421/.375 95
P John Shimkus .429/.429/.429 99
SS Steve Scalise .500/.750/.500 156
RF Bill Shuster .235/.263/.294 58
1B Tom Rooney .167/.167/.250 39
LF Dennis Ross .111/.200/.111 32
C Rodney Davis .250/.400/.250 82
CF Rand Paul .200/.200/.200 144

Democrats may aspire to switch places with the majority GOP in the halls of Congress, but they’d never trade their baseball lineup for this one. Yet Republicans aren’t as bad as they look; our six years of data overlap neatly with their six-year losing streak, and those wRC+ numbers are dragged down by an overall offensive environment grossly inflated by Democratic blowouts.

The GOP’s one hitter who rates above even that lofty baseline is Majority Whip Steve Scalise of Louisiana. One of the Republicans’ hardest-working players, Scalise has forced his way into the starting lineup after years as a bench player with the league’s fifth-highest wRAA—behind only the Democrats’ four elite sluggers. Texan Kevin Brady and Illinois’s John Shimkus have played in the CBG since the 1990s, when their stellar play (in 1997, Shimkus hit the game’s most recent over-the-fence home run) fueled a 12-year Republican dynasty. The grizzled veterans may have lost a step since then, but they have slumped less than the Republicans’ other players. Finally, Senator Jeff Flake, like former fellow Arizonan Mark Trumbo, has a real gift for power (.214 ISO) but doesn’t get on base well (zero walks in his last 14 plate appearances). It makes him a curious choice for leadoff—one that Barton will hopefully reconsider in 2015.

The bottom of the lineup drops off sharply and features the bottom three CBG players by WAR. Bill Shuster, Tom Rooney, and Dennis Ross each clock in at –0.2 wins above replacement, although bad luck has been a factor. Ross, who represents the Tigers’ spring training home of Lakeland, FL, sports an unfortunate .167 BABIP and has at least displayed the ability to draw a walk (10% walk rate). Yet putting the ball in play at all has proven to be a problem. In 41 combined plate appearances, Shuster, Rooney, and Ross have combined for 10 whiffs. (By contrast, in 40 plate appearances of their own in the Congressional Baseball Game, Democrats Murphy, Polis, and Richmond have never struck out.)

A poor eye is a theme for Republican hitters. Their active roster has a 7.1% walk rate and a 27.6% strikeout rate; that’s bad even if you’re facing Major League pitching, let alone the still-good-but-not-Clayton Kershaw Democratic staff. Barton should be preaching patience to his team, noting that, in last year’s game, Democrats actually had more walks than hits en route to 15 runs.

Projected Democratic Pitchers

Player ERA FIP K/7 BB/7
RHP Cedric Richmond 2.59 5.64 9.85 2.59

For four years running, only one man has taken the hill for the Democrats—and one is all they’ve needed. The team’s best hitter, Richmond, is also their workhorse pitcher, and he is in absolute control of the game when he’s on. An unparalleled two-way threat, Richmond has a total WAR (combining offensive and pitching value) of 1.5—in just four games! In four complete games pitched (caveat: the Congressional Baseball Game is seven innings long, not nine), he has taken a no-hitter into the final inning as well as thrown a shutout (and that was in two separate games). His Game Scores by year have been 77, 55, and 76 before dipping to 33 last year. Ominously, Richmond was pitching through an injury last year, and he is still recovering from November shoulder surgery here in 2015. The GOP will take another game like last year’s, when they were able to hang six runs on him, while Democrats are just holding their breath for the long-term health of their 41-year-old ace—still a spring chicken by CBG standards.

Projected Republican Pitchers

Player ERA FIP K/7 BB/7
RHP John Shimkus 8.08 7.30 4.04 3.23
RHP Pat Meehan 7.74 7.53 11.05 7.74
RHP Marlin Stutzman 14.44 9.71 7.88 9.19

To put it gently, the Republicans are better at twirling government shutdowns than shutdown innings. Though their hitting may not be top-shelf, that’s not their real obstacle in trying to reclaim congressional bragging rights; their (in)ability to get Democrats out is.

It’s unclear whom Barton will tap to start the 2015 game. Pennsylvania righty Pat Meehan has an impressive strikeout rate but a scary walk rate, and he has only ever been used in relief. Marlin Stutzman of Indiana probably won’t get a second chance after giving up six runs and only getting four outs in his 2014 start. I endorsed him for the start last year on the strength of a good K-BB%, but I fell victim to small sample size; he now has thrown more balls than strikes in his (slightly longer) career.

For whatever my recommendation is worth nowadays, the Republicans should start Shimkus. As unsightly as that FIP is, a 100 FIP- tells us that it’s actually league average (remember, this is a really hitter-happy league). He’s also the only GOP hurler with good command—his 7.8% BB% is even lower than Richmond’s. Like many ageing pitchers, he’s reinvented himself as a control artist who doesn’t miss many bats (9.8% K%). As with his offense, Shimkus used to be more dominating on the mound; he pitched the Republicans to multiple wins in the mid-2000s. If Barton does indeed give Shimkus the ball on Thursday, he’ll see a very different approach, but he hopes it can still add up to the same old result.


Assembling the Avengers

A big part of baseball and sports in general is playing the “what if” game. What if Babe Ruth was never traded to the Yankees? What if Pete Rose never bet on baseball? What if Bill Buckner had fielded that ground ball cleanly? As a proponent of sabermetrics, I am fascinated by numbers and what they say about each individual player’s performance. One of my most interesting projects has focused on assembling the greatest lineup of hitters to ever play the game. To do this, I found the players with the highest all-time on base percentage (OBP) at each position, and structured them accordingly to create a run-producing powerhouse. The reason behind choosing OBP over popular statistics such as batting average and home runs is because on-base percentage is one of the most accurate indicators of run value. If a batter gets on base, the team has a higher chance to score more runs, and more runs means a greater chance of winning. Each of these players has a particular set of skills (just like the Avengers, and Liam Neeson), that could be utilized to create the most successful lineup. Here is the order I came up with:


Billy Hamilton CF (Line: .344/.455/.432)- No, I do not mean the speedy sensation for the Cincinnati Reds. I’m talking about the turn-of-the-century, Hall-of-Fame outfielder who had one of the greatest seasons in the history of Major League Baseball. In 1894, Hamilton posted an unbelievable stat line, hitting .403 with a .521 on base. He cashed out 225 hits to go along with 128 base on balls, and swiped 100 bases. Oh and did I mention that Hamilton scored 198 runs? One. Nine. Eight. That record has yet to be broken.

Babe Ruth RF (Line: .342/.474/.690)- There’s no question that the Sultan of Swat would be in this elite assembly, but I want to make a case for the great slugger batting second. With Hamilton’s hefty OBP and base path presence, Ruth would see an increase in fastballs per plate appearance in the number two spot. The reasoning behind this is that because a fastball will reach the plate faster, there is a higher likelihood that the catcher will be able to release the ball quickly when trying to catch the lead off hitter stealing second.

Ted Williams LF (Line: .344/.482/.634)- If the number three batter is often described as the best hitter on the team, then this lineup will have the greatest hitter who ever lived in that spot as well. Ted Williams was just that. With the highest on base percentage of all time, Ted Williams was a master of plate discipline. He could analyze a pitch like no other, and capitalize on even the smallest mistake made by a pitcher.

Lou Gehrig 1B (Line: .340/.447/.632)- Gehrig was an artist of driving in runs, shown by his astounding 7 seasons of 150+ runs batted in. He is the perfect all-time cleanup hitter, and a dangerous force behind Ruth and Williams.What’s scary is that Gehrig and Ruth had the chance to play on the same team, a fierce combination that was dubbed “Murderer’s Row.”

Rogers Hornsby 2B (Line: .358/.434/.577)- There are few second basemen in the history of the game that have shown as much offensive prowess as Hornsby. The Cardinal slugger won 7 batting titles to go along with 2 triple crowns during a time where his production was overshadowed by the likes of Ruth and Gehrig. His 1922 season was one for the books: 42 big flies, 152 RBIs, 250 hits, and a line of .401/.459/.722. That’s about as good as it gets ladies and gentlemen.

Mickey Cochrane C (Line: .320/.419/.478)- Despite only playing 13 years in the majors, the Hall-of-Fame catcher won 2 MVP awards and posted a .419 lifetime on base percentage. Names like Johnny Bench, Yogi Berra, and Mike Piazza are labeled as having the better offensive force, but none was more consistent than Cochrane in getting on base and into scoring position.Yes I am still bitter about Cochrane defeating Gehrig in the 1934 MVP race, but as a  phenomenal catcher for a playoff bound Tigers squad, he definitely had the credentials.

Arky Vaughan SS (Line: .318/.406/.453)- Vaughan’s reign in the big leagues came over a decade after his predecessor, Pirate short stop Honus Wagner, ended his career ranked third all time in hits. Although Wagner received greater attention and ranks significantly higher in several offensive categories, Vaughan wins the spot in this lineup based purely on his OBP. He was also a triples machine, averaging 12 per year in his first 9 seasons.

John McGraw 3B (Line: .334/.466/.410)- McGraw follows the same pattern as the men at the bottom of this lineup: not a big name and no popular accomplishments. However, this third baseman could beat you every which way on the base path. A lifetime .466 on base and 436 stolen bases, it pains me to put McGraw in the 8 spot, but someone had to be there. His power numbers aren’t as good as Vaughan or Cochrane’s, but that was mainly due to a different ball era and McGraw could do well at any of the 6-8 positions.

Les Sweetland P (Line: .272/.341/.338)- Who??? Yeah, I don’t blame you. Lester Leo Sweetland pitched 5 years in the majors, going 33-58 with a whopping 6.10 ERA. This guy’s only black ink was the 15 batters he hit during the 1928 season. Despite the terrible pitching campaign, Sweetland hit .272 with a .341 on base in 325 career plate appearances, making him one of the greatest hitting pitchers of all time (THE greatest in terms of on base).


Who’s Wilin to Give Rosario a Chance?

So the seemingly inevitable came to fruition last week when the Colorado Rockies sent Wilin Rosario down to Triple-A Albuquerque after just 14 at-bats with the Rockies this year. According to the man himself, it was to allow another bullpen arm to join the big-league club. Fair enough you might say, the team’s immediate needs are a priority (try telling Kris Bryant that) and the Rockies needed another pitcher in the pen.

Just a couple of years ago, Rosario posted a .270 batting average, tallying 28 home runs and an .843 OPS in 426 plate appearances in the most demanding of positions as a 23-year-old rookie.

What did he do for an encore? Well in 2013 Rosario managed a .292 batting average but launched only 21 home runs and his OPS dropped to a paltry .801 in 466 plate appearances. I jest. Still very productive for a young catcher, even if he gets the assistance of Coors field 50% of the time.

So how did it reach the point where this seemingly top prospect is now battling for a spot in the Majors aged 26?

Well, it begins with Rosario’s skills behind the plate. As a 23 year old, the Rockies knew Rosario had the bat to play but needed to improve defensively to become an everyday catcher in the Majors. Bumps and hiccups are to be expected and in 2012 he had 13 errors and 21 passed balls in 105 games.

This improved in 2013, when Rosario committed nine errors and cut passed balls to nine in 106 games.

But then in 2014, things began to fall apart again and in just 96 games, he had 12 passed balls and seven errors. Granted, a strained left wrist troubled him much of the season, and landed him on the disabled list. In May, a nasty bout with type-B influenza cost him 12 games and 11 pounds. All this culminated in a drop in production at the plate. The batting average dropped to .267, homers fell to 13 and his OPS to .739 whilst appearing at the plate 410 times.

On paper, the batting stats don’t look too bad for a catcher suffering illnesses and injuries. After two good years, one disappointing one couldn’t undo all the potential shown in the previous two seasons, surely?

Looking a little deeper then, there’s the issues Rosario has had with facing righties during his career. Below is a breakdown of his 2012, ’13 and ’14 seasons, showing his splits against RHP and LHP.

2012

Split PA H 2B 3B HR BB SO BA OBP SLG OPS
vs RHP 308 68 15 0 14 19 78 .239 .286 .440 .726
vs LHP 118 39 4 0 14 6 21 .348 .381 .759 1.140

2013

Split PA H 2B 3B HR BB SO BA OBP SLG OPS
vs RHP 328 89 14 1 14 8 85 .279 .299 .461 .760
vs LHP 138 42 8 0 7 7 24 .323 .355 .546 .901

2014

Split PA H 2B 3B HR BB SO BA OBP SLG OPS
vs RHP 303 70 16 0 5 18 56 .249 .290 .359 .650
vs LHP 107 32 9 0 8 5 14 .317 .346 .644 .989

Rosario is considered someone who cannot hit righties effectively and one highly-regarded publication even had written this about him heading into 2015. If every opposing pitcher was a lefty, he’d win an MVP. Any hope for solving RHPs? “. Not exactly a ringing endorsement. But again, his stats against righties aren’t terrible for a young catcher in the National League, certainly serviceable.

However, you now have enough question marks to take stock at what you have; someone who had a bad year, who struggles against right handed pitching and is not performing defensively. So the Rockies had a solution, move him over to first base. His WAR had dropped from starter level in 2012 and 2013 (both years he sported a 2.1 WAR) to replacement level in 2014 (-0.1 WAR). So it seemed like a good idea. Rosario is yet to hit his peak, his bat has more than enough upside for long-term production and without the pressures of needing to improve at the immensely challenging catcher position anymore, things can only trend up.

But then a spanner is thrown into the works in the form of Justin Morneau and his $12.5 million two-year contract which runs through the 2015 season (with a mutual option for 2016). So the simplest short-term solution is to keep Rosario in Triple-A for the season, work out his issues against righties, develop his skills at first and decline the option on Morneau’s contract for 2016, freeing up monies to be used elsewhere. Rosario is arbitration-eligible the next two years and cannot become an unrestricted free agent until 2018 but a long stint in the minors could add an extra year of team control.

So let’s play a bit of devil’s advocate for a moment. If the Rockies extend Morneau through 2016, if the Rockies don’t see Rosario as an everyday first baseman going forward, if they think they can use Rosario to get better elsewhere it begs the question: Who could be Wilin to give Rosario a chance?

As things stand, the Rockies have a winning record and it’s still too early to say if they’ll be contending this year or whether they’ll try to rebuild a little. So let’s look at three possible trades the Rockies could target at the end of this season if they feel the need to move on from Rosario.

Boston Red Sox

Mike Napoli’s contract ends this year and the Red Sox won’t be renewing it. He’s having a bad year and injuries have caught up with him. Rosario on the other hand could be the perfect fit what with the Green Monster and its hitter friendly confines. So the Red Sox could do with getting Rosario. But who could they trade? The Rockies need pitching above all else (which hasn’t bothered the front office too much in the past) but the Red Sox don’t really have any pitching options to trade. If anything, they need the help too.

So let’s look at the outfield. The Red Sox will enter 2016 with Mookie Betts, Rusney Castillo, Jackie Bradley Jr, Daniel Nava and Allen Craig as outfield options, whilst the Rockies will have Corey Dickerson, Carlos Gonzalez and Charlie Blackmon (based on existing contracts and no renewals/trades). So there’s one name which may intrigue. Brock Holt.

Brock Holt is a bit of a utility guy the Red Sox are trying to find at-bats for so one could perceive a trade for an everyday first baseman as ideal. The Rockies don’t have the depth of the Red Sox so they can find ways to give Holt more regular playing time and keep an effective batting lineup.

The likelihood of this trade happening is slim, but it’s intriguing nonetheless.

Philadelphia Phillies

It’s no secret the Phillies are reluctantly rebuilding after prolonged efforts to bury their head in the sand. They still field a lineup containing Ryan Howard and Carlos Ruiz despite father time having caught up with them both (not forgetting Chase Utley).

Ryan Howard continues to be the Phillies everyday first baseman and while he’s still signed through 2016, sooner or later, they need to bite the bullet and accept whatever they can get for him. Carlos Ruiz is also signed through 2016 so maybe if at least one can be moved on, Rosario could fill in for twelve months, covering either spot with a view of an everyday first base role from 2016. He’s young enough to form a part of the rebuild and is a clear upside on both Ruiz and Howard’s bat so this makes sense.

Cole Hamels is the big star the Rockies would love, but the Phillies are looking for a big prospect haul so unless some form of Dickerson, Arenado and top prospects were sent the other way, this just isn’t happening. They don’t have any other starter who could conceivably be considered by the Rockies either. Their main pitching prospects of Aaron Nola, Yoel Mecias, Zach Eflin, Jesse Biddle and Ben Lively are all probably out of play if they get serious about rebuilding so maybe a lower level guy like Nefi Ogando is possible. But this would be a big risk for the Rockies, trading for a mid-tier (at best) pitching prospect.

So maybe some bullpen help to go with it? Ken Giles is the closer in waiting for the Phillies once Papelbon leaves behind the fans who adore him so. But he’s struggle early in 2015 but again, the likelihood of the Phillies losing a potential closer for the next few years to bring in Rosario is unlikely so at best a package of two or three decent arms could be conceived by both parties.

Although it’d be difficult to see a trade here, I think a big enough scratch beneath the service could see something done to benefit the long term goals of each side. Stranger things have happened so only time would tell if the Rockies and Phillies could get something done.

Seattle Mariners

Finally we reach the most intriguing possible destination. The Seattle Mariners have invested big to get to the World Series in recent years. Big name free agent acquisitions of Robinson Cano and Nelson Cruz on the last two off-seasons has added to their chances whilst tying up King Felix long term has given them the ace they need. They’ve constructed a good rotation and a solid batting lineup with one notable exception; first base.

Logan Morrison has been the Mariners starting first baseman so far in 2015, after they waived Justin Smoak last October. First base has become a position synonymous with power hitters in recent times, with offense on the decline throughout baseball it’s a focal position for contending teams batting lineups. I’m not disparaging Logan Morrison, I don’t know the guy and he’s a far better baseball player than I’ll ever be, but he’s not a starting first baseman for a Major League contending team. Last year was the first time since 2010 he posted a positive WAR. Even in 2011 when he hit 23 homers, his WAR was -0.6. 2011 also marked the last time he played at least 100 games in a Major League season.

So there’s clearly a need to upgrade here. Is Wilin Rosario a clear upgrade? Well he is enough of one to matter, especially considering Morrison bats leftie. Morrison actually has a better career batting average against lefties (.260 compared to .243 against righties) but that’s as far as it goes for hitting lefties. Just a glance at his over stats will show this. As a sample, he hits a homerun every 28.65 at-bats against righties and one every 42.36 at-bats against lefties. Below is Morrison’s career splits.

Split PA AB H 2B 3B HR BB SO BA OBP SLG OPS
vs RHP 1393 1232 299 67 15 43 148 219 .243 .326 .426 .752
vs LHP 522 466 121 26 1 11 44 113 .260 .333 .391 .724

The Mariners also have the advantage of the DH. They can easily keep Morrison, form some kind of platoon between Rosario and Morrison whilst still giving Rosario at bats against righties with either of them DHing. Rosario would be a cheaper option at first than most alternatives so improving their lineup without breaking the bank is a good thing right? Things are starting to make sense all of a sudden.

But what could the Mariners give up in order to acquire Rosario. Although Rosario would make sense, they certainly aren’t going to overpay for him. This is where things could get interesting…….

Rockies still haven’t pinned everything on Tulowitzki. If they ever trade him away, it’ll be in the next year so heading into 2016, the Rockies may need a shortstop. I present to you, Mr. Bradley Miller. Before you start up, I’m in no way suggesting Miller is a direct replacement for Tulowitzki!

The Mariners looked like giving Chris Taylor the starting shortstop gig in 2015, until a broken wrist curtailed that idea, giving Brad Miller another chance to shine. He’s been pretty good so far this year, but Chris Taylor is back and Miller certainly hasn’t shown the promise the Mariners hoped he would. If Taylor can hit well in Triple-A (he’s already hitting .328 with 2 homers, 5 steals and an .894 OPS) he’ll be with the big league club sooner rather than later. It’d be a downgrade at shortstop for the Rockies I grant you, but would free up a lot of cap space to go out and get something resembling a decent rotation.

But even if the Rockies do keep hold of Tulowitzki (and why wouldn’t you?), we come back to their need for pitching. The Mariners aren’t exactly steeped with pitching but certainly have enough to trade a piece away. They’d be unlikely to want to lose one of their more established “prospects” in order to get Rosario (Taijuan Walker, Roenis Elias, and James Paxton).

But there’s also Danny Hultzen, who has started the year well in Triple-A after rotator cuff surgery (currently sporting a 2.05 ERA through 30+ innings). Tyler Olsen is currently in the Mariner bullpen but was considered a 4th/5th starter during his minor league career and Ryan Yarbrough is continuing to impress in low A ball and at age 23, could easily be in the Majors within a couple of years. So the Mariners have enough depth to make a trade without harming their rotation. Whether or not they value any of these guys on a par with Rosario however is a different matter.

Looking at the three possible destinations, the Mariners appear to be the best chance of getting something done, but I’d be more inclined to suggest Wilin Rosario starts 2016 as the Rockies first baseman. And who’s to say he won’t finish 2015 in the role. Just as it wouldn’t surprise me in the least if he gets traded tomorrow, but that’s baseball. Nothing is ever set in stone and should the Rockies look to move on, there are certainly enough options out there to get something done.


Three Simple Rules for Breaking My Heart

So here’s the deal. I’ve seen loads of articles with great analysis and research and truthfully, I’d love to be all up in that. I love the nerdy side of the game and wish I could quote and analyse the tiniest statistics. I have great admiration for those who do. But the simple fact is I’m not that type of guy. Maybe I can’t comprehend certain stats and figures bounded about in modern baseball society. It could be I don’t have enough time to commit to breaking through in this field. Or simply it’s a case that I lack the “get up and go” as my old teachers used to say. I like to think it’s a combination of factors which contribute to me having never published an article of any kind, anywhere, ever. But here we are, I’m ready to do it, just not in the traditional sense some of you more avid fans would have become accustomed to…….

A little background first. I’m 31, born and raised in London, England and have been a big baseball fan for well over a decade. I like to think I have read and watched enough about the history of the sport and the current state of the game to be able to hold my own in any conversation with more baseball educated fellows. I started playing fantasy baseball 3 years ago after being randomly invited to join a long standing league by someone in a mock draft and have been hooked ever since. My winters are spent plotting my draft tactic and reading countless articles to help me draft my dream team. My rankings are done by Christmas and altered ad-nauseam until spring commences before the draft day hits the day the season starts. And here we are, at the reason I have taken time out of my working day private life to write this article. What on Earth was I thinking during the draft?!?!?!

Our league is standard scoring categories, snake re-draft with standard 25 man rosters and is Head-to-Head (which I know some experts detest but for the more casual yet serious player, I like it). And this year expanded to twelve teams from the usual ten. I was sat there with my rankings, myriad spreadsheets and utilities ready to complete the perfect draft. I set myself three clear and concise rules;

  1. Do not draft too many players from one team. Reasoning is quite personal but I feel if there’s a team wide issue causing a slump and you have three or four guys from that team, the impact could be huge. I carried this over from my Chicago Bears Fantasy Football disaster a year ago.
  1. Do not draft a pitcher in the first 6 rounds. I had spent a massive portion of my research looking at guys I can get pretty late to form a strong pitching core and had enough confidence in myself to execute this successfully.
  1. Only draft closers guaranteed the role. This league has a stronger emphasis on closers as one or two teams will only draft relievers, nearly guaranteeing them WHIP, ERA and Saves whilst punting Wins and K’s which means relievers are generally drafted way too early (I’ll maybe do a write up on this one day but one step at a time huh).

With all this in mind, I logged on, found I was the 10th pick and wasn’t too bothered. Hey, I was that confident I could have missed the first round pick altogether and still put together a title winning team. Thirty minutes and three picks into the draft, I had Edwin Encarnacion, Jose Bautista and Stephen Strasburg. A couple more hours had passed, and I owned Dellin Betances in the 9th round and Ken Giles in the 17th. Well done dude, that’s two of the three rules out the window but as long as you don’t draft any more Blue Jays, this is salvageable. By the end of round 22, I had Dalton Pompey and Drew Hutchison rostered. I sit here now as a Devon Travis and Miguel Castro owner to boot.

So how did it come to this I now ask myself? Why do I have 6 Blue Jays, a 3rd round pitcher and two relievers who don’t close, one of which came to me in the 9th round?!?!?! AAARRRRRGGGGGGHHHHHHHH

Well it’s pretty simple really; something I like to call Fantasy Dynamics. No doubt this phrase has been used the world over, but I think it’s apt here. This is the part of the article where I try to put over some wisdom and insight. Why have I put these self-imposed rules in place and why have I proceeded to break them with no more than a “how do you do”?

Best place to start is Rule 1; Do not draft too many players from one team; I wanted power early in the draft, get power guys early and cheap speed later, so with Encarnacion still out there after the first 9 picks, he kinda just fell into my lap. It was either him, Abreu or Rizzo and his back injury in spring aside, I felt Encarnacion was the safest bet with his track record for continued elite power. Abreu and Rizzo actually went in the next two picks and so onto my second pick, 15th overall. More power I cried, I NEED MORE POWER. Ah look, Jose Bautista is still out there, he’ll do.

So without even fathoming my rules, within two minutes I had two Blue Jays. But I wasn’t bothered at this point. They served my purpose of getting elite power early. Granted, there was a couple of question marks over them but I’m not one for overpaying for the shiny new toy when there’s a perfectly good product on the shelf which does the same thing year in, year out for less. Neither player has much in the way of competition for their place this year and I actually believe the Blue Jays are a very good shout for the AL East so why shouldn’t I own their two best hitters?

As the draft went on, I needed an outfielder and lacked some speed. Ben Revere had been drafted too soon for my taste (152nd overall pick) and by the late teen rounds there wasn’t much in the way of cheap speed. I considered Marisnick, but his playing time concerned me more than Pompey’s, so I plumped for the Toronto native especially given his propensity to run in the Minors.

Then we head into the 22nd round and where I’m looking to pick up some low end starting pitching with upside. As mentioned before, this is a league where two teams ended up drafting only relievers which meant some SPs were going a lot later than expected. None more so than Drew Hutchison, someone I’d looked at in detail over the Winter and had warmed to considerably to fill the role of a low price, high upside pitcher. The fact his ADP was around the 220 mark and this was the 255th pick overall, I had to pull the trigger. His upside at this price to too high to ignore, especially considering Bud Norris went in the same round. And then there were 4 Blue Jays!

So the end of the draft, I have 4 guys rostered who play north of the border. That’s cool, not the end of the world. And then the season begins and who do I have as my middle infielder on opening day…….Danny Santana. Now I really hated this guy going into the draft and was raging at the fact it was me who drafted him, but middle infielders were going way sooner than expected and some too soon for my liking (some examples below) so I had to get him to fill a spot if nothing else. So the season starts and I figured, “hey, why not take a chance on Devon Travis”. He’d been named as Toronto’s starting second baseman and in this side, could be productive so why not. That makes it 5 Blue Jays.

Jimmy Rollins             ADP 131         Selected 71st overall      -60

Alcides Escobar          ADP 176         Selected 132nd overall  -44

Daniel Murphy            ADP 142         Selected 109th overall -33

Scooter Gennett         ADP 220         Selected 187th overall -33

Closing the end of the season’s first week, the news breaks that Brett Cecil is out as Toronto’s closer and John Gibbons’ faith is being thrust onto Miguel Castro, a 20 year old upstart who was so under the radar, I couldn’t even find any information about him pre-season. But this is a league where closers are gold-dust and I was first to find this information out (thanks Twitter). So there I was, 6 Blue Jays just one week into the season. Rule 1, thanks for playing but goodbye.

But I could justify it to myself, I went power early, needed a speedy outfielder late, really liked Drew Hutchison, hated Danny Santana and had the chance for another bit of gold closer. So it’s not all bad, right. Granted a couple of the picks haven’t worked out early doors (I’m looking at you Drew and Jose’s shoulder) but looking back, I’m not sure there’s a whole lot I would have done differently given the same set of circumstances. With hindsight, maybe, but as Helen Reddy once said “Hindsight is wonderful. It’s always very easy to second guess after the fact”.

Then Rule 2; Do not draft a pitcher in the first 6 rounds. I had no need to, I’ll load up power early, get a couple of SP2 types around the 7th and 8th rounds and then draft the best player in the need I had. Simple. Until I got to my 3rd round pick (no 34 overall). I had already seen 6 SPs drafted at this point (Kershaw, Felix, Scherzer, Sale, Bumgarner and Price) but no one seemed to want Stephen Strasburg to this point.  Why? I thought he’d take another step this year to being the ace he is already and would have been snapped up by now. But he wasn’t. I couldn’t chance he’d still be there by my next pick so why risk the wait? I had to do it, I just had to. And I did. Ta-Da, Rule 2 is outta here.

So why did I do it, what possible justification could I give myself for doing it? Well, it’s simple. I thought he was undervalued and was the best player available at the time of my pick. I could still achieve my target of stocking up with power early and now had an ace. I wouldn’t need two SP2 types, I’d only need the one and could easily bag some decent pop around the 6th, 7th and 8th rounds so this is a good thing. I’ve done something I didn’t want to and it should actually make my team better now, so yay me!

And then Rule 3; Only draft closers guaranteed the role. By the time of my 9th round pick (106th overall) I had the power I needed, had the two starters I wanted and only had a gap at shortstop which at the time, I figured I could fill in easily (hindsight again). Nine (count ‘em NINE) closers had been drafted at this point. I couldn’t sit on the fence any longer, knowing closers were disappearing faster than donuts at Homer Simpson’s house. So who could I get? The elite ones had gone; the next tier of guys had been drained. Or had they? Dellin Betances was still waiting for a roster spot. All the talk from the Yankees was a committee, Andrew Miller could be taking saves away but Betances was so good last year, is a righty with great stuff. He’d get the job sooner rather than later all to himself. Let’s do this.

I had no regrets, of course Betances will be closing, its a shoe-in. So by the time my 17th round pick arrives (202 overall), I figured it’s a good time to pick up another guy who can get me saves. By now, 31 relievers had been drafted, but Ken Giles was not one of them. The Phillies are desperate to cut ties with Papelbon and Giles is next up. They’ll find a buyer for Papelbon within the first week of the season. Papelbon doesn’t want to be in Philadelphia anymore. Papelbon will be gone within a week. Papelbon, PAPELBON, PAPELBONNNNNNNN………………

I was sure I had now got two guys, undervalued in this league that will close, give me plenty of strikeouts and be big factors in my triumph. At the end of the draft, I grinned to myself and was satisfied with my evening’s work. I looked at my “closers” and my grin subsided a little. What about Rule 3? Why have I now got 2 relievers not guaranteed to close?

Well as I mentioned in Betances case, I was so sure of his stuff and makeup, he’d be the full time closer within a couple of weeks. Maybe he’d lose a few saves to Miller during the season but so be it. I’m a Yankee fan (noticed I’ve waited this long to out myself in case any of you stopped reading as soon as I uttered those words). I know Betances will close, Girardi talking about a committee is pre-season bluster. D’oh.

And Ken Giles……well that I’m finding it harder to justify. There’s nothing guaranteed about Papelbon leaving the Phillies any time soon. Any potential buyer has gone silent and until trade deadline day looms, I think he stays put (maybe even beyond). Earlier this week I actually dropped Giles and he’s still sat in free agency which in this league, shows how limited his value has been so far. He’s been nowhere near last season’s level and is pretty much valueless in this league’s format. So well done to me for drafting him.

So that’s my draft day story, 3 simple rules, all of which have been broken. Why have I felt the need to write this? Is it somewhat cathartic? Well yes. But I’m not going to end on a big epiphany. People can take this for what they want it to be. Some of you will come out of this taking nothing away and that’s cool too. But the one thing it’s got me thinking about, is how much more flexible I need to be. When I first started to play, I almost had my team written down before the draft and barring one or two players, I wasn’t far wrong. It was as near to set in stone as could be. All because of my rigid nature in the draft. I’ve gotten better at that, I’m more open to making changes before, during and after the draft, seeking value rather than my overriding desire to own a particular player.

But this year I set myself three rules, based on my own experience, other people’s experience and every bit of research I had done. And yet all 3 still went out the window. Simple rules which won’t impact my plans and ideas, won’t hinder myself in the draft and should guide me to glory. And all I can muster is that flexibility is vital in drafts and during the season, keeping an open mind helps you as much as all the research you do. Don’t make rules you’re willing to break people!

No doubt, there’s much more seasoned Fantasy Baseball players who have read this and thought “what’s the point in this? I know what I’m doing, why should I listen to anything this guy has to say”. Some of you fellow newbies might also think the same, “How dumb is this guy?” But everyone who has ventured into this wonderful world we call Fantasy Baseball can take some sustenance from this, whether you learnt this lesson long ago, or simply don’t care about this and it’s given you something to gripe about, it’s done something.

Despite all of my rule breaking, I’m still happy with my team. It’s pretty much got the same MO as the team I had planned to have and there’s very little I would have done differently without hindsight. I think I can contend this year if I get that essential bit of luck everyone needs to succeed. I think this year could be my year. So let me close with a relevant quote which has some relevance, from my all-time favourite wordsmith; Mr Yogi Berra.

“If you don’t know where you are going, you’ll end up someplace else.”


Insurance in Baseball is Like a Black Hole

How much gravity does insurance have in Major League Baseball front office decisions?

Puns aside, let me tell you the funny thing about a black hole. You see astronomers cannot really see one, instead they are detected through their effects on the universe around them. Although less extreme, insurance is similar in this regard on its impact on baseball teams. Most teams insure some of their larger contracts in case their players cannot play due to an exterior factor such as injury. Perhaps the impacts of this major facet of the game does not cross our mind often because it is not eminently visible. However, make no mistake that insurance is a major factor when teams make major decisions regarding the DL, contract extensions, playing time and so on.

First, consider the history of baseball insurance to better understand why it impacts baseball. It can be said that by the late 1990s it had become common place for teams to insure their larger contracts. The first time baseball and insurance first truly started getting media attention was with Albert Belle in 2001 due to confusion over his insurance contract. Albert Belle had suffered a career-ending hip injury with the Orioles. Fans grew excited however despite the disheartening news when in 2002 the all-star slugger was added back onto the Orioles’ 40 man roster. Disappointed Orioles fans can tell you that Belle never played another MLB game however. Instead, he was added back onto the 40-man roster so the Orioles could collect insurance on his contract (some MLB insurance contracts do not cover a player unless they remain on the 40-man roster). At the time the MLB insurance contract covered the remainder of the salary owed on Belle’s contract. According to writer Michael Branda, the Orioles recovered an astounding 27.3 million out of a 39-million-dollar loss represented by Belle’s injury. Since the huge losses on Belle’s contract in the early 2000s, insurers in baseball have become much more stringent with their underwriting in baseball contracts.

Belle was not the only reason for teams being more stringent with their underwriting. The associated risks with insuring a MLB player have increased. One reason is PEDs. The MLB really did not enforce its ban on PEDs up until the late 2000s, but now being caught using PEDs can result in a significant loss in playing time. According to MLB Trade Rumors a syndicate of the MLB, Ervin Santana a first-time offender was suspended for 80 games on April 3rd of 2015. Santana was expected to make 13.5 million dollars this season. Despite being suspended, the Minnesota Twins are expected to still have to pay half of Santana’s salary (only players caught for the second time or more for steroids lose most of their salary).

To account for this insurers enforce a 60 to 90 day deductible policy in order to shield themselves from these sort of losses as well as claims made for short-term injuries. In addition to the 90 day deductible insurance policies are typically term policies of about three years with an option for renewal after the conclusion of the contract. As a result, if a contract proves to incur severe losses the liabilities will be only in the short term. Obviously to further protect themselves insurers only cover players with no preexisting injuries and all players must be inspected by the insurer. Furthermore, with wide variability and unpredictability in player health an insurer can in a way readjust its rate every three years to better reflect the player’s risk of not playing.

These more stringent underwriting practices have influenced the game, oftentimes when deciding when to take a pitcher off of the DL. Adam Kilgore of the Washington Post explained it best when he talked about how in 2012 Stephen Strasburg was “shut down” during a playoff push for the Nationals due to potential health concerns. In this decision there appeared to be a delicate balance between contention and the considerations of the insurance company that would not have covered Strasburg if he had been injured due to these health concerns. It is not crazy to think that finances come into play when making a decision on baseball players. Jeff Moorad, a decision maker for the Padres explained that in 2010 Chris Young was eligible to come off the DL. The Padres ultimately chose to put Young back on the field but Moorad added, “the accounting department much preferred that he [had stayed] on the disabled list.”

Baseball insurance has grown steadily more expensive. Although it is difficult to ascertain how much a team actually spends on insurance it is clear that it can be a burden for smaller teams. For instance, the Arizona Diamondbacks’ rotation once featured the dominant starting pitcher Brandon Webb. Between 2006 and 2008 Brandon Webb made three all-star games and finished first, second and second respectively in Cy Young voting. In this span Webb also led the league in innings pitched once. In essence Webb was due for a large payday once his contract expired. However contract negotiations between Webb and the Diamondbacks hit a snag in June of 2008. Despite a track record as a durable starter, no insurance company was willing to write a policy for injury risk to the Diamondbacks hurler. The reason is because insurance companies refused to accept the risk of Webb injuring his arm or if they were willing to, they were going to charge exorbitant rates.

As a result, the Diamondbacks could not get an insurance contract that did not have an exclusion on arm, shoulder or elbow injuries, all vital and injury-prone body parts for pitchers. According to AZCentral, a news outlet that covers the Arizona Diamondbacks, due to Webb not being insurable the Diamondbacks broke off all contract negotiations. In the long run, this proved to be a smart move since ten months later after contract talks ceased Brandon Webb never pitched in the majors again due to injuries. The point of this is that not only is baseball insurance so expensive it can prove to be impractical, it shows that most insurers are unwilling to insure some pitchers. Walt Jocketty, the former general manager for the middle-market St. Louis Cardinals explained that insurance has “become so expensive that it’s a cost item we really have to look at when you put your payroll together.”

In addition to insurance contracts altering how teams manage their rosters they influence how teams treat their players. In essence there is a human side to these contracts. Consider Josh Hamilton who is in the middle of a massive five-year, 125-million-dollar contract with the Angels and who has been playing quite ineffectively relative to his salary. Josh Hamilton who recently suffered a relapse on his drug addiction before the 2015 season is a prime example of insurance influencing teams to treat their players in a way they hopefully normally would not. Despite being a repeat offender, an arbitrator chose not to suspend Hamilton for any period of time. What makes this story scandalous is the Angels’ seemingly acerbic response to this news. It appears that the Angels almost wanted Hamilton to be suspended to spare them the expense of his failed contract. Clearly the Angels have little incentive to help Hamilton recover from his addiction. Instead, it is in their interest to see that Hamilton never plays another game of baseball again because if he does not play for an extended period of time the Angels can potentially collect insurance and definitely reduce their payroll.

Insurance influences baseball more than many people may realize. When it comes to playing time, DL decisions and contract negotiations, insurance seems to be an integral piece in the decision-making process. For me though, part of what makes baseball great is the inherent competition of players, often with disregard to their own body (*cough* Adam Eaton *cough*). There is little harm of teams protecting themselves from the inherent risks of baseball players becoming injured. The risk is that insurance becomes an incentive for teams to make decisions that may be bad for the game, such as not playing players for financial gain. Let’s hope that ultimately, teams do not get engulfed into this black hole.


Z-Scores in Sports (a Supporting Argument for zDefense)

This is part 3 of the Player Evaluator and Calculated Expectancy (PEACE) model, which is an alternative to Wins Above Replacement.  This article will introduce evidence that z-scores can be converted into runs (or points in other sports) with accuracy and reliability, as well as analyze the results that zDefense has produced.

Recall that zDefense is broken down into 4 components: zFielding, zRange, zOuts, and zDoublePlays.  The fielding and range components depend on the accuracy of Calculated Runs Expectancy, which I introduced in Part 1.  Outs and double plays, though, use a different technique: they take z-scores for the relevant rate statistics, then multiply by factors of playing time.  Here were the equations:

  • zOuts = [(Player O/BIZ – Positional O/BIZ) / Positional O/BIZ Standard Deviation] * (Player Innings / Team Innings) * (√ Player BIZ / 2)
  • zDoublePlays = [(Player DP/BIZ – Positional DP/BIZ) / Positional DP/BIZ Standard Deviation] * (Player Innings / Team Innings) * (√ Player BIZ / 2) * Positional DP/BIZ


We can set up models in other sports that estimate point differentials using very similar techniques.  I’ve developed one for college football and another for the NBA.

For the first model, I’ve used the data for every Division I FBS football team from 2000-2014 (1,802 teams), and I defined the relevant statistics and their “weights” as such:

  • zPassing = [[Completion Percentage z-score * Completions per Game] + [Passing Yards per Attempt z-score * Passing Attempts per Game]] / 10
  • zRushing = [Rushing Yards per Attempt z-score * Rushing Attempts per Game] / 10
  • zTurnovers = [Turnovers per Game z-score]
  • zPlays = [Number of Offensive Plays per Game z-score] 


These 4 components summed make up zOffense, while taking each team’s opponents’ calculations results in zDefense.

What I found after summing the different components was that the resulting number, when divided by the number of games played, was a very accurate estimator for a team’s average point differential.

Among the nearly 2,000 college football teams, the average difference between zPoints (calculated margin of victory) and actual MOV was just 3.21 points, with a median of 2.77, and a max difference of 13.97 points.  About 20% of teams’ MOV were calculated to within 1 point or less, 53% were accurate to 3 points or less, 79% to 5 points or less, and 99% to 10 points or less.  The regression model for this dataset can be seen below:

http://imgur.com/kUDwbA7


The NBA model has similar results using 6 parts:

  • z3P (3-point shots) = [[3P FG% z-score * 3-point attempts * 3] / 10
  • z2P (2-point shots) = [2P FG% z-score * 2-point attempts * 2] / 10
  • zFreeThrows = [FT% z-score * free throw attempts] / 10
  • zTurnovers = [Turnovers per Minute z-score * League Average Points per Possession] * 2
  • zORB (offensive rebounds) = [Offensive Rebounds per Minute z-score * League Average Points per Possession]
  • zDRB (defensive rebounds) = [Defensive Rebounds per Minute z-score * League Average Points per Possession] 


Similar to the football model, these 6 components make up zOffense, while each team’s opponents’ calculations make zDefense.  I particularly like z3P, z2P, and zFT because they multiply the z-score by the “weight”: 1, 2, or 3 points.  Recall that zRange is multiplied by the IF/OF Constant, which is just the difference, on average, in runs between balls hit to the outfield vs. balls that remain in the infield.

I’ve only done the calculations for the 2013-2014 season, where teams averaged 1.033 points per possession.  To convert to zPoints in this model, add zOffense and zDefense, then divide by 5.

In most seasons, elite teams will have an average point differential of +10, while terrible ones will hover around -10.  On average, the NBA model had an average difference between the calculated and actual differential of just 1.331 points, with a median of 0.800.  17 out of 30 teams were calculated within 1 point, 25 within 2, and 29 out of 30 were accurate to within 5 points per game.

The fact that these models can be created using the same general principle (rate statistic z-scores multiplied by a factor of playing time equates relative points) provides some evidence that similar results are calculable in baseball.  This is the basis for zDefense in PEACE.  Let’s look at the results.

Most sabermetricians would turn to the Fielding Bible Awards for a list of the best fielders by position in any given year, so we’ll use those results to compare.  If we assume that the Fielding Bible is accurate, then we would expect zDefense to produce similar conclusions.  Comparing the 2014 winners to the players ranked as the best at their position by zDefense, we can see some overlap.  The number in parentheses is the positional ranking of the Fielding Bible Award winner by zDefense.

  • Position: Fielding Bible Winner (#)…zDefense Winner
  • C: Jonathan Lucroy (12)…Yadier Molina
  • 1B: Adrian Gonzalez (1)…Adrian Gonzalez
  • 2B: Dustin Pedroia (2)…Ian Kinsler
  • 3B: Josh Donaldson (2)…Kyle Seager
  • SS: Andrelton Simmons (8)…Zack Cozart
  • LF:Alex Gordon (1)…Alex Gordon
  • CF: Juan Lagares (3)…Jacoby Ellsbury
  • RF: Jason Heyward (1)…Jason Heyward
  • P: Dallas Keuchel (5)…Hisashi Iwakuma

The multi-position winner, Lorenzo Cain, was also rated very favorably by zDefense.  While most positions don’t have a perfect match, every single Fielding Bible winner was near the very top of their position for zDefense.  This is the case for almost every instance, which isn’t surprising: if there were drastic disagreements about who is truly elite, then we would suspect one of the metrics to be egregiously inaccurate.  Instead, we see many similarities at the top, which provides some solid evidence that zDefense is a valid measure.

As always, feel free to comment with any questions, thoughts, or concerns.