Archive for Outside the Box

53 Things About a 53-Second Finnish Baseball Video

With no baseball being played on this Monday night as I write this, I thought I’d throw this out for a quick fix.  Granted, this is baseball as it’s played in Finland:


Below is a second-by-second recap of all the glorious action.

{note – because the Stone-Age author doesn’t know how to post GIFs into an article, you’ll have to pause the video yourself to freeze the action for each of the 53 seconds}

0:01 – Dude in the white-striped uniform way off the plate, obviously trying to avoid catcher’s interference because of the dude in the orange-and-blue uniform.

0:02 – Orange-and-blue apparently spots the pitcher striding towards the pitcher’s mound, which I guess in Finnish is the “tikli”.

0:03 – There’s a “ski” on the back of the hitter’s jersey, so he must be Sami Haapakoski.  Not likely to be another Polish guy on a Finnish baseball team.

0:04 – And he’s got his hands backwards.  (I’d love to see how he holds a light bulb to screw it in)

0:05 – And now the catcher flips the ball up in the air!  A combination hidden-ball trick/quick-pitch.

0:06 – First baseman charging in…Sami charging at the offering, which can only mean…

0:07 – A line drive over the first baseman’s head.  Well played Sami!

0:08 – Sami now runs down the THIRD-BASE LINE!!!! (being half-Polish myself I have no more capacity to joke).  This means that the runner who’s already there (Jeano Segurannen) has to start running to second.

0:09 – What’s with the water hazard inside the park?  I guess with this being Finnish baseball, they’ve replaced right field with a right fjord.

0:10 – I like the greenery in right fjord.  Gives it a Wrigley-like ambiance (this is the Obligatory 2016 Cubs Reference™ for this article)

0:11 – Crowd going wild, screaming for Sami to run the bases the right way and not blow a well-earned ground-rule double.

0:12 – Or maybe it’s a ground-rule triple if it gets stuck in the poison ivy.  Not sure.

0:13 – Love the hustle on the guy in right fjord.  Plays the game the right way, he does.

0:14 – And emerging from behind a tree there’s an umpire, checking to see if the ball lodged in the poison ivy for a triple or into the water for a double….what, the ball’s IN PLAY??!?

0:15 – Yep. The right fjorder (Jonni Damonen) swiftly tosses a relay to one of his fellow outfjorders.

0:16 – Unfortunately, Ryän Raburninnen isn’t known for having the best “handle” in this sport

0:17 – Average water temperatures in Finland are colder than anywhere in the continental USA.  That’s because they’re measured in degrees Celsius.

0:18 – Look, there’s Jeano rounding the bases the right way

0:19 – Poor right fjorder takes his second plunge in the last five seconds.  Someone please fire up a sauna for ol’ Jonni.

0:20 – And there’s Sami flying like a Finn right behind him.  All this fumbling of the frigid fjord-frozen ball in right fjord has allowed them to finally move forward again.

0:21 – Nice flip by the right fjorder.  Maybe they should move him to second base, wherever the hell they put that in Finland.

0:22 – Nice use of the split screen for the fielding and baserunning portions of the play.  Might catch on for MLB telecasts if they ever tried it.

0:23 – Here comes Sami to his jubilant teammates….

0:24 – …PSYCH!!…

0:25 – …running up the third-base line without him

0:26 – The right fjorder pulls his hypothermic body up Tallinn’s Hill, his efforts having been to no avail.

0:27 – Why are they running out there with their bats?  I am so thoroughly confused.

0:28 – Led Zeppelin, the official sponsor of the third-base warning track.

0:29 – Those uniforms make these guys look like a NASCAR pit crew.  Waiting for one of them to hand Sami a champagne bottle to spray the place.

0:30 – Some guy in a blue jacket is taking a stroll in from left field, apparently oblivious to all the mayhem.

0:31 – This part of the field is also used for the Finnish Capture The Flag League.

0:32 – Finnish vodka is excellent.  Just ask the camera guy.

0:33 – Guy in blue jacket has a helmet on.  Must be from a different pit crew.

0:34 – Ebullient Finnish yelling.

0:35 – This part of the field was formerly used by the local Finnish Basketball Association team.  The team disbanded once it was discovered that someone forgot to put up an actual basket.

0:36 – The one guy with a green helmet comes towards the camera with his bat in ready position.  Must be the team’s enforcer.

0:37 – “HAYYYYY!!!”

0:38 – Another yell sounding like “BASEBALLLL!!!!”

0:39 – Coach about to give Sami a water bottle for all his efforts with the bat and on the basepaths (both clockwise and counterclockwise)

0:40 – Fun fact: one of those long Finnish words on Sami’s uni means “this space available for sale”.  I forgot exactly which one it was.

0:41 – At least Sami holds the water bottle correctly.

0:42 – How come there’s no left fjord?

0:43 – Fuzzy blue feet can only mean one thing — a mascot!  Wonder who/what they have for mascots in Finland?

0:44 – It’s the love child of these two!  Sweet!

0:45 – Not sure what that thing is over the bleachers behind home plate (home Frisbee?).  Looks vaguely aerodynamic.

0:46 – Someone obviously has a job that includes coordinating handtowels to these guys’ uniforms.  The age of specialization is not merely a North American phenomenon.

0:47 – Because Finnish baseballs are often contaminated with fjord-borne bacteria, used handtowels are the souvenir of choice.

0:48 – Eriko is like… what?

0:49 – Ignoring the two kids waving for the towel in the front, Sami fires a Hail Mary pass for the blonde in the top row.

0:50 – Notice all the parkas and heavy winter clothing on these fans.  Although the average game-time temperature in Finland is about 17°C, the temperature on this evening was only 10°C, which is just 10 degrees above the freezing point of the right fjorder’s uniform.

0:51 – Nobody bothered to man the lemonade stand in left field just past the bleachers.  Guy in the blue jacket probably just walked off with the lemons.

0:52 – Can the Finnish president override a vimpelin veto?

0:53 – Fun fact:  the official logo of Superpesis, the major league of Finnish baseball, has basically the same logo as the NBC peacock.

Thank you for watching, and have a nice day.


Rick Porcello’s Shot at the Cy Young Award

You’ve probably read countless treatises on the reasons that Chris Sale, Corey Kluber, or Justin Verlander would be more deserving of the Cy Young Award this year.

Well, I’m sorry to disappoint, but Rick Porcello is probably going to win the award. It’s going to upset a lot of quantitative purists that adjust for everything. Pick your favourite value-added statistic, and Rick probably doesn’t quite win it, or there is an inherent flaw where you can take something away from him on the stats that he did lead (WHIP and BB allowed). The truth is that this year’s winner will reflect quantitative and qualitative considerations.

Consistency, volume, and increasing difficulty  

He, of the never-meltdown. Rick allowed five runs once, and never failed to give his team 5.0 IP in any start this year. Not to suggest that innings-eating alone should be rewarded — Wade Miley, take a bow — but Porcello has provided a quality start in every start since June 28 (with the exception of one 4 ER, 6.2IP appearance on July 24). Tim Britton captures it well in a recent article for the Providence Journal, noting that every other candidate has been shelled a few times, and Hamels not once, not twice, but fifce! I’m sure it was nice for the boys in the dugout to know that if they played reasonably well offensively, that there was a very good chance to win every time Porcello was on the mound, and with it, a good chance that losing streaks would be rare for the team. A casual observation, much as any season-ticket holder in Boston might note, is that Porcello made one of the worst pitchers’ parks into a graveyard. 13-1, with a 2.88 ERA in Fenway, is no easy task.

With a decent start Friday night, Porcello finished with 223 IP. Both Sale and Verlander just clipped that, but Porcello finished near the highest inning total of the candidates, so workload could also be a consideration.

It also got no easier as the game wore on as he was better each time through the order: .264, .230, .195, and .121. Yes, Kluber has managed to pitch to some of the best soft contact this season, but that alone is not going to win the award, and is a fringy measure that does not have full traction from the press.

Image

Porcello puts in the work, keeps his head down, and would appear to be pretty humble about it. Most people didn’t even notice him over there in Boston. Porcello perhaps did not need to contend with throwback jerseys, but making confetti of your uniform isn’t the spirit of the game, and may well have left a Windy City starter as another man out this year.

Punishing wins & The Contender Effect

While it may be in vogue to punish pitchers for having good teammates, making allowance for consistency, Porcello has still won 22 games. Say what you will, but most people want a winner. A winner in a big market, with big stories, and a big slugger, are good things all-around for the league. Too often pitchers are victimized for the fielders behind them, but what is rarely addressed is that a pitcher can sometimes deploy this to his advantage, and Porcello has certainly made the best use of his team in this regard.

Frequency bias in the awarding of the AL Cy Young

Major League Baseball’s penchant for sharing has been well documented. This is well covered by a certain Managing Editor with a man who hits and walks, and who has been oft-written as being the ‘best-hitting guy’ every year, but who will likely finish second because, gosh, he’d much rather share with a friend from Boston with a winning smile. The writers association hasn’t allowed a repeat AL Cy Young winner since Pedro in the 99 & 00 seasons, and what I will call a ‘gap’ winner since 04 & 06 with Johan Santana. In both those cases, first-place votes were unanimous, and that certainly won’t be the case with this year’s crop. Kluber is ‘too soon’ (2014) and Verlander is too, well, I don’t know what, but he won it in 2011. Since Detroit failed to make the playoffs, I suppose you could pull in the Contender Effect that leaks into the psyche of proletariat, and certainly to some extent, with the voters.

Conclusion

It’s not that Porcello is so much more deserving of the award, but rather, that nobody else has distanced themselves from the pack so as to make themselves most deserving. In addition, he’s made a timely run for it against other guys who have ‘been here before’ or have given other reasons to not vote for them. He’s had some luck, but he has also shone in two of the leading controllable areas — by limiting walks (first among starters) and hits (first among starters in WHIP). There are qualitative factors that will affect the outcome and for these reasons, I think we’ll be crowning someone that has not won the award yet and that’s good for the game.


Why Extending the Blue Jays Spring Training Location Isn’t In Tampa Bay’s Best Interest

Last week, the Tampa Bay Times reported that the City of Dunedin and the Toronto Blue Jays put together a proposal that would keep the Blue Jays in Dunedin for another 25 years at a cost of $81 million dollars. The money invested in the project would be spent to upgrade the Blue Jays training facility, making it a year-round operating facility for the organization, and refurbish Florida Auto Exchange Stadium, expanding the stadium from 5,000 to 8,000 seats.

For nearly three years, my writing has taken a holistic view on baseball in Tampa Bay. I have taken to heart the premise of Major League Baseball and the mayors of our largest cities that Tampa Bay is a Major League region. In May of this year, I wrote an article for regional political website that asked whether local politicians believe this premise. I argued that unfortunately local politicians are acting in their own local self-interest and dividing Tampa Bay into four spring training/Minor League regions.

Last season, I wrote a post on another Rays blog that stated Tampa Bay is the fifth-most overextended sports market in America. The data for this post, from the American City Business Journals, stated Tampa Bay is currently $86 billion below where they need to be in personal income to support all the pro sports in the market. The study unfortunately did not include arena league football (Tampa Bay Storm), lower-level professional soccer (Tampa Bay Rowdies), and spring training, all of which locals in Tampa Bay spend money on.

This is why extending the Blue Jays in Tampa Bay is a bad idea. Allowing the Blue Jays to leave would allow other sports to receive fan dollars and aid their existence, removing one obstacle from an already overcrowded market. If the region values its major sports, it must allow the minor sports to walk away.

There are plenty of arguments used by the Blue Jays, the City of Dunedin, Bonn Marketing, and the team of hired economists that show why extending the Blue Jays is a good idea. This post will look at many of these points and provide alternate or opposing views.

Market Assumptions

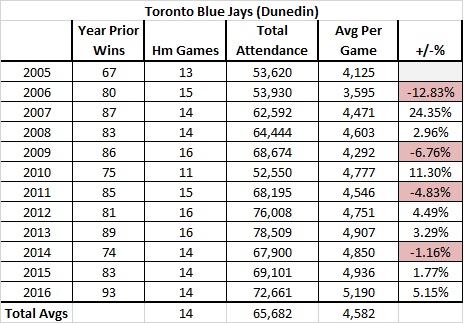
In 2016, Blue Jays Spring Training attendance increased 5%. They were the only team in the Tampa Bay area that had a spring training attendance increase in 2016. Here is the Blue Jays spring training attendance since 2005.

First, the Blue Jays had their highest attendance the same year they had their most wins in 11 years. While this is not coincidence, there is little correlation between wins and attendance in previous seasons. This year, they again have a chance to win 90 games and make the playoffs. That should bode well for spring training attendance in 2017 and we can probably predict a similar turnout to 2016.

But what happens when the Jays stop winning? Will attendance fall below 5,000 again?

Second, the released economic studies detail how valuable spring training is to Pinellas County. The study states that of the over 70,000 fans that attended Blue Jays spring training, 79% resided outside of Pinellas County. These tourists brought in $70.6 million in income to Pinellas County.

If we subtract 5% from the $70.6 2016 income, we can estimate a $67 million impact in 2015. In 2015, the tourism total for Pinellas County was $4.65 billion.

Therefore in 2015, the Blue Jays accounted for 1.4% of Pinellas County’s tourism income.

The Dunedin-Blue Jays study fails to account for the other spring training venues. If 23,539 (32.4%) of the Jays spring training attendance stayed in Pinellas County, did they see the Phillies and Yankees who also train in the local region? If the Jays left, the region might only lose one night of visitors’ stay, not the entire 7.4 nights reported. Because of the other local teams, the Jays cannot assume they are the only cause of visitors.

Next, let’s breakdown the Blue Jays 2016 spring training attendance:

  • 72,652 total
  • Non-county attendance: 57,395 (78.9%)
  • In county attendance: 19,257 (26.5%)
  • Out of state: 23,539 (32.4%)
  • In state/Out of county: 33,856 (58.9%)

While we can safely assume the out of state fans stay in local hotels, what about the “in state/out of county”?

Local Spring Training Market Conflicts

Of the Jays 16 games in Dunedin in 2016, 7 were against teams with local ties (Phillies, Yankees, and Rays). Fans for those games could have either been from Hillsborough County or stayed at a hotel to also see another team’s games.

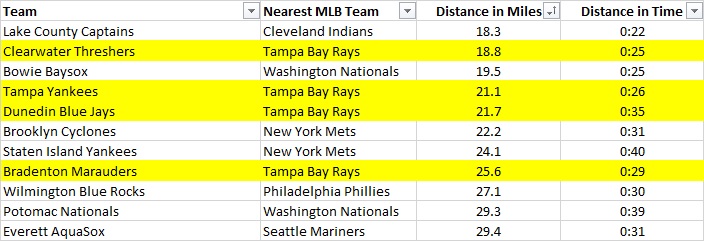
As for the 19,257 Pinellas County residents that went to see the Blue Jays spring training in 2016, their money could be spent on any other leisure activity, to include supporting the Tampa Bay Rays regular season games a month later and 21.7 miles away.

Many spring training supporters do not understand regional money spent on spring training could be spent on the Rays. They argue that the Rays don’t train in Tampa Bay, so they are not potential gainers of local spring training spending. Proponents of this view need to understand that money in hand on March 30 does not disappear on April 1. Fans of 28 other teams (Arizona excluded) wait until April to spend leisure money on baseball. If they are fans of an out-of-town team, they wait until that team visits their local team. This spending behavior is done all over the nation.

Waiting until the Blue Jays visit Tropicana Field would help the Rays’ bottom line and support Major League Baseball in the region. When locals buy tickets to spring training, they are spending their annual leisure money on a replacement good available before the premium product is released.

In 2016, the Rays accounted for 60% of all baseball tickets sold in the Tampa Bay area. This was an increase from the 58% in 2015, but far from the 71% of tickets sold to Rays games in 2009 and 2010. As a small-market team, the Rays can’t afford to have that much revenue diverted from their pockets. The Dunedin-Blue Jays agreement might even decrease the Rays percentage and give them less market share.

According to the Tampa Bay Times, 40% of the $81 million cost will go to stadium renovations. The goal is to expand capacity at Florida Auto Exchange Stadium by over 30%. If the Jays sell-out every spring training game (highly unlikely, but possible), their total spring training attendance will be 112,000. This would place the Blue Jays on level with the Pirates in Bradenton, who play in 8,500-seat McKechnie Field. Florida Auto Exchange Stadium would still be smaller than Bright House Field in Clearwater and Steinbrenner Field in Tampa.

A key missing piece in the presentations provided by the Blue Jays and the City of Dunedin is expected attendance. Where is an indicator of increased demand? Just because they’ll build it, doesn’t mean fans will come.

If fans do fill the new 8,000 facility, does the city and the team expect an increased amount of out-of-state fans to visit the new stadium or do they expect the same ratio of demand?

Using the same ratio of people from Pinellas County (26.4%) and assuming 100% sell-outs, 29,568 local residents will be spending money on a substitute baseball product in March 2019 onward. That is 10,000 more tickets purchased by money that could be going to the local Major League team.

Florida State League Market Impact

Following spring training, the facility will still be in use for the Florida State League season. Attendance for Florida State League baseball in Dunedin has been less than stellar. From 2010 to 2015, the Dunedin Blue Jays ranked last in the Florida State League in total and per game attendance. They did not rank last in 2016 due to the relocation of the Lakeland Flying Tigers to a smaller facility while their home stadium was being refurbished.

The current population of Dunedin is less than 40,000. Dunedin is one of the smallest towns in America to host a Minor League team. To fill an expanded Florida Auto Exchange Stadium would mean 20% of the entire population would have to attend. That is a huge demand for a small town.

Only 5.4 miles from the home of the Dunedin Blue Jays is Bright House Field, home of the Clearwater Threshers. Although they rarely play on the same day (only seven times in 2016), these two teams are in direct competition for hyperlocal dollars. They are the same product at the same level for the same cost. The Clearwater Threshers, however, play in a stadium off a major thoroughfare and have excelled in promotions, enabling them to close in on Florida State League attendance records.

The Dunedin Blue Jays would have to increase attendance by at least 300% to match the Clearwater Threshers. Unless new fans are created, expanding Florida Auto Exchange Stadium would likely cannibalize the attendance of the Clearwater Threshers, especially when the Dunedin park is in its “honeymoon phase”.

Emotional Factors

The City of Dunedin promotes that Dunedin is the only location the Blue Jays have called their spring home in their 40-year existence. While this has emotional value, the Dodgers were in Vero Beach from 1949 to 2008 before moving to Arizona and Dodgertown was among the most revered spring training locations in Florida. Teams move; it is the nature of finding the best place for business.

While there may be a bond between the Blue Jays and the City of Dunedin, according to polling, that bond has not translated into support for the Blue Jays. According the New York Times/Facebook survey in 2014, the top three most “liked” teams in Zip Code 34698 are the Rays (49%), the Yankees (16%), and the Red Sox (6%).

Understandably, Dunedin Mayor Julie Bujalski does not want the Blue Jays to leave. She is an elected official and maintaining the status quo is preferred to a loss that could cost her in the next election. She also doesn’t want to be the mayor who lost local revenue provided by spring training, although there is dispute whether or not revenue actually is what team-sponsored studies say it is.

On the other hand, there are many reports of areas such as Winter Haven, Florida, that have lost spring training and not suffered at all economically. University of South Florida Economics Professor Phillip Porter has been often quoted saying that “nothing changes” when a team skips town. Doubtful the City of Dunedin contacted Porter. They did however, contact Bonn Marketing, a Tallahassee, FL marketing firm that has written positive reports about spring training in Florida since 2009.

Other Blue Jays Options

Instead of reinvesting in Dunedin, the Toronto Blue Jays had several other options. They could have done any of the following:

  • Move to Clearwater and split the Phillies facility
  • Move to Viera, Florida where the Nationals recently vacated
  • Move to Kissimmee, Florida where the Astros recently vacated
  • Move to Port Charlotte and split the Rays facility

Of these options, only moving to Clearwater would keep the Blue Jays in a Major League market.

Due to the closed nature of the Dunedin and Toronto Blue Jays negotiations, we will never know what other options the Blue Jays considered. All we know is what they want in Dunedin and that Dunedin seemingly bid against itself.

Conclusion

Contrary to what the City of Dunedin, the Toronto Blue Jays, Bonn Marketing, and their hired economists have promoted, extending the Blue Jays in Dunedin is a bad idea. Until the Tampa Bay Rays are a successful franchise and have the same potential revenue as other small-market teams, local officials should decline renewal of spring training facilities in Tampa Bay. They should stop hedging their bets against the Rays and providing local residents inferior baseball goods in which to spend their money.

Even with tourism, Tampa Bay is not a big enough market to support Major League Baseball, four spring training facilities, and four Minor League teams. Declining to renew the Blue Jays and allowing them to find a new home in Florida is in the best interest of the region.


Someone Give Juan Uribe a Job

Todd Frazier has 38 home runs this year. That’s probably a strange way to start off a post about Juan Uribe but hang with me.

Todd Frazier has 38 home runs this year. Todd Frazier also has a wRC+ of 100 this year. That is a pretty remarkable combination. According to wRC+ Frazier has been exactly an average hitter this year despite the fact that he is currently 8th in all of baseball in home runs. This interesting and seemingly unlikely union piqued my curiosity and sent me down a statistical rabbit hole in search of home runs and terrible wRC+’s. At the bottom of that rabbit hole is where I ran into Juan Uribe.

Juan Uribe has not played an MLB game since July 30th. In that game he went 0-for-3 and he was released by Cleveland a few days later on August 6th. This probably wasn’t a surprise to most people as A) Most people probably would be more surprised to learn he was still in the league to begin with, and B) he was running a 54 wRC+ over 259 PA with Cleveland this year.

But I’m not here to argue that someone should give Uribe a job because his current talent level deserves one (although you probably could; he was nearly a 2-WAR player as recently as last year). I’m here to argue for someone to give him a job because Juan Uribe is on the cusp of history. Juan Uribe has 199 career home runs.

You might think that 200 career home runs isn’t that much of a milestone and it’s only because humans love round numbers that we even recognize it as a milestone. And you would be absolutely correct in saying that. But much like Todd Frazier’s 38 home runs this year, Juan Uribe’s 200 career home runs would be fairly unique. In fact they would be entirely unlike anyone before him because Juan Uribe would be the worst hitter to ever hit 200 home runs.


table1


That is the board of directors of the Terrible 200 Club (patent pending) and as you can see Juan Uribe is poised to unseat Tony “why the hell am I standing sideways at the plate” Batista as CEO with one more measly home run, and by a pretty decent margin. Obviously though his bid is now under threat because he is 37 years old, has been without a team for over a month now and was absolutely awful when he did have a team. It is entirely possible, maybe even likely, that he never hits another MLB home run. And it’s not like there is another current player who is a slam dunk to make a run at Batista if Uribe never steps into the batter’s box again:


table2


Brandon Phillips will get to 200 but he is sneaky old. He turned 35 in June, so while he is nowhere near what he was earlier in his career it seems unlikely that he plays long enough to see his career wRC+ fall below 90.

AJ Pierzynksi is all but done at this point. At 39 years old and nearly a win below replacement level this year it’s probably more likely that the ghost of Clete Boyer gets signed and hits 38 home runs to get to 200 as it is Pierzynski hits 12 more in his career.

-Which bring us to James Jerry Hardy. Hardy seemed to be doing his best to crater his wRC+, posting a dreadful 50 last year, but he has rebounded (relatively speaking) to post a 93 so far this year. One has to wonder if he can even get to 200 home runs (he still needs 16 more to get there and he has hit only 26 over his past 1404 PAs), and secondly, if he does, will he post a wRC+ low enough to “best” Batista? You could probably argue that any version of Hardy that is good enough to get to 200 homers is probably also good enough to not decimate his career wRC+.

The easiest solution is for some intrepid and/or awful team to just give Uribe a spot so that he can chase history with each swing. Atlanta, Arizona, Minnesota, what have you guys got to lose? Would a Kickstarter or GoFundMe to pay some of his salary help? It would just be such a shame for the baseball public to be denied a potentially marvelous thing when it’s so close to realization. Like teasing a dog by pretending to throw a ball or every season after the first one of Homeland.

Somewhere Tony Batista is sitting in a recliner, probably in some crazy way that no one else sits in recliners because he is Tony Batista, just waiting for the news that Uribe has been picked up by someone so he can hand the crown to the new king of the Terrible 200 (patent pending). He just needs a little help. Let’s make this happen, MLB.


Bases Produced and a Consideration of the 2016 AL/NL MVPs

Bases Produced is the keystone stat in a paradigm for baseball statistics that I have been developing, off and on, for the past 18 years.* Bases Produced measures a player’s overall offensive productivity by counting, quite simply, the number of times that player enables either himself or a teammate to advance to the next base. Each time this happens, a player is considered to have “produced a base.” Counting these events is important because producing bases is quite literally the only way that a baseball player can contribute to the scoring of runs by his team. When a player scores a run, after all, he has done nothing more than advance to all four bases in succession.

The Bases Produced system assigns credit for the production of these bases in a way that is based on traditional baseball statistics, but is also an expansion thereof. This expansion enables most traditional numbers to be tied together into a unified whole, evaluated in terms of Bases Produced, rather than remaining the haphazard collection of unrelated counts that they have always seemed to be.

How does it work? To calculate Bases Produced (BP), I first unify all of a player’s productive batting stats into one sub-total called “Batting Bases Produced” (BBP). This counts each base the player reaches on his own base hits, walks, or times hit by pitch:

BBP = 1 * 1B + 2 * 2B + 3 * 3B + 4 * HR + BB + HBP

A player’s success at producing BBP may be contextualized by dividing his BBP by his total number of “Batting Base Production Chances” (BBPC). This total includes all of a player’s plate appearances (PA), except for those times when a player has attempted to lay down a sacrifice bunt (SHA) — where his primary goal is ostensibly to produce bases for his teammates, rather than himself — and also his catcher’s interferences (CI), where the defense literally takes away his ability to put the ball in play.

BBPC = PA – SHA – CI

The ratio of BBP to BBPC then becomes a player’s “Batting Base Production Average” (BBPAVG):

BBPAVG = BBP / BBPC

Secondly, a player may produce bases for himself as a runner, by either stealing bases (SB), advancing on fielder’s indifference (FI), or “gaining” bases (BG). “Gaining Bases” is the term I use for a player who advances a base when the defense attempts to make a play on a runner somewhere else on the basepaths. For example, if a runner tries to score from second on a single, the batter may advance to second when the defense tries to throw out the runner at the plate. In this case, the batter/runner “gains” second base.

Taken altogether, the bases a player produces for himself as a runner are then called “Running Bases Produced” (RBP):

RBP = SB + FI + BG

Lastly, an offensive player can produce bases for teammates who are already on base by either drawing walks, getting hit by a pitch, or by putting the ball in play. Collectively, these bases are known as “Team Bases Produced” (TBP). The number of times a batter enables a teammate to reach home (TBP4) can be intuitively understood as the number of RBIs he has produced for his teammates, without including any that he has produced for himself. Overall, Team Bases Produced expands this concept by including the number of times a player enables his teammates to advance to second (TBP2) or third (TBP3), as well:

TBP = TBP2 + TBP3 + TBP4

While of course the batter depends on the presence — and subsequent baserunning actions — of a teammate on base to produce these bases, I assign the credit for producing them solely to the batter, without whose actions the runner(s) would not be able to advance on the play. The presence of the runners on base, however, is important to recognize when trying to evaluate how successful a batter is at producing team bases; each runner on base therefore counts as one “Team Base Production Chance” (TBPC) for a batter. (Note: When a batter draws an intentional walk, I do not count TBPC for runners whom the batter cannot force ahead to the next base.)

A batter’s Team Base Production Average (TBPAVG) then becomes, generally (and simply):

TBPAVG = TBP/TBPC

Overall, a player’s total Bases Produced (BP) is simply the sum of his Batting Bases Produced, Running Bases Produced and Team Bases Produced:

BP = BBP + RBP + TBP

This number may also be evaluated in terms of the player’s total number of chances to produce bases (BPC), including his Plate Appearances, Team Base Production Chances, and the number of times he enters the game as a pinch runner (PRS):

BPC = PA + PRS + TBPC

Rounding out this approach, I calculate a general measure of “Base Production Average” as the ratio of Bases Produced to Base Production Chances:

BPAVG = BP / BPC

On my website, www.basesproduced.com, I fill in the blanks of this general paradigm with similar breakdowns for “Outs Produced” and “Bases Run” (= bases a player reaches, but does not necessarily produce); interested readers may follow the link to learn all of the gruesome details for themselves. On the same website, I also calculate and update the BP stats for the current MLB season on a daily basis. You are welcome to check it out to follow along and see how they play out in real life.

While the Bases Produced paradigm may not enjoy all of the mathematical sophistication that goes into many modern sabermetric measures of offensive performance, it does have the advantage of reflecting straightforward facts and events that take place in every baseball game that any fan can quickly recognize and easily count for themselves (with or without a smartphone!). A grand slam home run, for instance, counts as 10 BP: 4 for the batter, 3 for the runner at first, 2 for the runner at second, and 1 for the runner at third. 10 Bases Produced is also a pretty good standard for an excellent game of baseball: I’ll mention in passing that there were just 7 performances of 10 BP or greater in last night’s (9/16) slate of 15 MLB games, with 14 BP topping the list (by three different players).

On basesproduced.com, I have also tabulated the same stats, using data from retrosheet.org, going back to the 1922 season. For those who are curious, the highest single-season BP total in history is 1005, by Lou Gehrig in 1927, while the highest BPAVG of all time is Barry Bonds’ .885, in 2004. There are still many bases produced statistics left to be calculated from the very olden days of baseball, however, before any of these numbers might be considered “records.”

Although Bases Produced is not, strictly speaking, a system that was designed to determine who ought to be the “Most Valuable Player” in any given season (whatever you might interpret that to mean), it is fun to use as another data point in the never-ending discussions about who most deserves the MVP award each year. So let’s consider what the system can show us about the best players in the American and National Leagues in 2016.

The AL MVP race has generally been described this season as a five-man horse race between David Ortiz, Mike Trout, Jose Altuve, Josh Donaldson and Mookie Betts. The Base Production Average numbers back that perception up, as all five of those players sit on top of the current AL BPAVG leaderboard, as of September 16th:

Player                             BPAVG      BBPAVG     TBPAVG

1. David Ortiz               .709            .673              .760

2. Mike Trout               .649            .628              .613

3. Jose Altuve              .645             .590             .652

4. Josh Donaldson      .644             .630             .651

5. Mookie Betts            .605             .564             .607

Although these numbers should ideally be normalized to account for the influence of hitter-friendly venues like Fenway Park, Ortiz is still enjoying his best season there ever (his previous season high BPAVG was .697, in 2007), and he’s well ahead of his career BPAVG of .620, too. As far as base-production statistics are concerned, David Ortiz is unambiguously the 2016 AL MVP.

Over in the National League, I have heard many people talk about the great year that Kris Bryant is having, but his performance fails to even register in the NL’s top five base producers, by average:

Player                             BPAVG      BBPAVG     TBPAVG

1. Daniel Murphy         .665            .619              .718

2. Anthony Rizzo         .634            .607              .659

3. Joey Votto                .619             .602             .617

4. Nolan Arenado        .617             .607             .624

5. Freddie Freeman    .612             .612              .597

(9. Kris Bryant             .601             .618             .541)

Daniel Murphy of the Nationals has clearly had the standout year, instead. And it is worth noting that Bryant’s teammate, Anthony Rizzo, is actually doing considerably better than Bryant in overall BPAVG. The big difference amongst these three players can largely be attributed to Bryant’s mediocre TBPAVG, which is near the National League median of .529 (Aledmys Diaz). That difference can, in turn, be attributed to a combination of Bryant’s high strikeout percentage (.219) and very low ground-out percentage (.113). The one outcome of a plate appearance that never produces bases for teammates is a strikeout, and ground outs tend to be about three times as team-productive as fly outs, in those situations where a batter hasn’t succeeded in producing a base for himself. Bryant’s current numbers place him squarely on the wrong side of both of these team-base-production tendencies.

While Kris Bryant has had a great baserunning season this year…these numbers give reason to question any suggestion that he might have been the best player in the league this season — or even, for that matter, the best player on his own team. But at least it is manifestly clear that Joe Maddon has Bryant and Rizzo in the correct order in the Cubs’ lineup. 🙂

*While I am not as up on the current literature in baseball statistical analysis as I should be, I do know that others have developed similar statistical measures independently of me, including at least Gary Hardegree, Alfredo Nasiff Fors, and someone named EvanJ on this forum. If there are other similar thinkers out there, then I apologize for my ignorance of their work.


The WIS Corollary

Interestingly enough, one of the major postwar genres of Anglo-American literature was the academic comedy. Popularized in large part by Philip Larkin and the “Movement,” authors strove to poke fun at academic institutions and the conventions followed by the terrifically aloof professors. The most famous novel to fall into this genre is Lucky Jim by Kingsley Amis. The book features Jim Dixon, a poverty-stricken pseudo-pedant with a probationary position in the history department of a provincial university. A veritable alcoholic, Dixon attempts to solidify his position by penning a hopelessly yawn-inducing piece entitled “The Economic Influence of the Developments in Shipbuilding Techniques, 1450 to 1485.” Short novel made shorter, it doesn’t help him retain his position, but it does succeed in illustrating the banal formalities that academic writing necessitates.

In sabermetrics, there is a heavy reliance on sometimes inscrutable jargon, acronyms that sound like baby words (“FIP!”), and Mike Trout’s historical comps (Chappie Snodgrass is not a very good one in case anyone is wondering) that quite understandably renders the average fan mildly frustrated and the average fan over sixty wondering how we will ever make baseball great again. Typically, I enjoy those articles very much because they communicate news efficiently and analytically. Occasionally, however, articles stray into the Jim Dixon range of absolute obscurity, examining the baseball equivalent of “Shipbuilding Techniques,” whatever that may be. Such writings form the cornerstone of sabermetrics as they mesh history, theory, and sometimes economics.

Fortunately or unfortunately, my article today isn’t quite Dixon-esque, but it retains some of that style’s more tedious elements. It falls more closely into the category of two-minute ESPN quick sabermetric theory update. I don’t think that’s a thing. Seemingly pointless introduction aside, please consider what you know about DIPS theory. I won’t insult your intelligence, but it was developed by Voros McCracken at the turn of the millennium and has served as one of the principal tenets of the pitching side of sabermetrics ever since then. The theory, in its most atomic form, essentially posits that pitchers should be evaluated independently of defense because it’s something they cannot control. Hence “defense-independent pitching statistics.”

Certainly, it was a revolutionary concept and one that has even gained quite a bit of traction in the mainstream sports media. Announcers talk about how a certain pitcher would look a lot better pitching in front of, say, the Giants instead of the Twins. Metrics like xFIP only serve to quantify that idea.

But every grand theory or doctrine (DIPS is essentially sabermetric doctrine at this point) requires a corollary to frame it. And so I propose something I like to call the “WIS Corollary to DIPS,” where WIS stands for Weather Independent Statistics. The natural extension of evaluating pitcher performance independently of defense is to evaluate players independently of weather because it also exists outside of player control.

The basic idea of this is that weather plays enough of a role in enough games to superficially alter the statistics of players such that they cannot be accurately and precisely compared with the other players in the league because all of them face different environmental conditions. Taking that into consideration, all efforts must be made to strip out the effects of weather when making serious player comparisons. Coors Field is why Colorado performances are regarded with such skepticism, while the nature of San Francisco weather and AT&T Park is supposedly why that location serves as an apt environment for the development of pitchers.

Think about it — it’s something we already do. We look at home/road splits, we evaluate park factors, we try and put players on +/- scales. We talk about this constantly even at youth games. I have heard parents say many times, “If only the wind hadn’t been blowing in so hard he might have hit the fence.” It’s honestly a commonly held, yet generally unquantified, notion that the general public has.

Player X hits a blooper at Stadium C that falls in front of the left fielder for a hit. Player Y hits a blooper at Stadium D with the exact same exit velocity and launch angle as Player X’s ball, but it carries into the glove of an expectant left fielder. Should Player X really get credit for a hit and Player Y for an out? Basically all statistics, striving to communicate objective information, would say yes. If this kind of thing happens enough times over the course of a season, it can make a significant difference. A couple of fly balls that leave the park instead of being caught at the fence would put a dent in a pitcher’s ERA, while changing a player’s wRC+ by no small sum.

For that reason, players should be measured as if they play in a vacuum. One of the biggest goals of sabermetrics is to isolate player performance in order to evaluate him independently of variables he cannot necessarily control. Certainly, this has some far-reaching consequences if the idea gets carried out to its natural conclusion. Someone would likely end up developing a model that standardized stadium size, defensive alignment for varied player types, and other things of that nature. I’m not necessarily advocating for that, just for stripping out the effects of weather.

WIS by itself isn’t radical, but the extent to which it’s applied could be considered as such. As of now, it’s something consciously applied a relatively small portion of the time, but I think that it’s something that should be considered as much as possible. Obviously, there are issues with this. You can’t very well modify “raw” statistics like batting average or ERA so that they reflect play in a vacuum. What you could conceivably do is create a rather complicated model that requires a complicated explanation in order to describe how the players should have performed. And that’s something which brings us to an important point; the metrics that would employ this information would not be for the average fan; rather, they would be aimed at the serious analyst.

This is something I’ve already tried to employ with a metric I created called xHR, which uses the launch angle and exit velocity of batted balls to retroactively predict the number of home runs a player should have hit. The metric is still in development, but I think it’s something that works relatively well and can be applied to other types of metrics. For instance, an incredibly complex and comprehensive expected batting average could utilize Statcast information to determine whether a given fly ball would have been a hit in a vacuum based on fielder routes and the physics of the hit. By no means am I trying to assert that I have all, if any, of the answers. The only thing I’m trying to do here is to bring debate to a small corner of the internet regarding the proper way to evaluate baseball players.

Probably the most crucial thing to understand here is that the point of sabermetrics is to accurately and precisely evaluate players in the best possible way. Sabermetricians already do an incredible job of doing just that, but perhaps it’s time to take things a step further in the evaluation process by developing metrics that put performances in a vacuum. I know that baseball doesn’t happen in a void, but the best possible way to compare players is to measure them* as if they do.

WIS Corollary — One must strip out the effects of weather on players in order to have the most accurate and precise comparison between them.

*Oftentimes it’s necessary to compare players while including uncontrollable factors, like sequencing, especially when doing historical comparisons. It’s important to note that the WIS Corollary is applicable only in very specialized situations, and would generally go unused.


Remembering Black Holes

Do you ever look at a daily lineup and find yourself disappointed with one of the names in it? Do you ever ask why the manager continues to bat a clearly inferior player when there are clearly better options on the bench or in the minors or in your softball league? Do you ever celebrate when a player gets designated for assignment and you never have to see them bat second in front of like six clearly better hitters? Well then I am very sorry, but it’s time to relive some bad memories, team by team, from the past ten years.

Yes, it’s time to talk about the black holes of the recent past.

Now what makes a player a black hole?

Read the rest of this entry »


A One-Man Marte Partay Between the Bases

This article originally appeared on the Pirates blog Bucco’s Cove.

“Speed kills.” –Al Davis

Starling Marte is having a hell of a season stealing bases and this is one of the things that should have propelled him into the All Star Game without needing the stupid final vote. He is the top baserunner in the NL this year, he’s second in the league with 25 stolen bases, and he has a better percentage than the leader Jonathan Villar.

A recent game against the Cardinals gave a strong piece of evidence of Marte’s preternatural baserunning ability when he stole second base with Carlos Martinez pitching in the sixth inning:

The Pirates’ announcers commented on the fact that people very rarely steal off of Martinez. I went to look at the numbers: in 399 2/3 innings since entering MLB, Martinez has yielded only 10 stolen bases in 19 attempts. I think the 19 attempts is really indicative of his abilities to control the running game; people just don’t even try to run on Carlos Martinez. Martinez ranks 36th among all pitchers in SB/IP who have thrown at least 200 innings since 2013, which is decent. However, if we limit ourselves to looking at only righty starters over this time period (since it is much harder to steal against lefties and game circumstances are a bit different between starters and relievers), Martinez ranks 13th among pitchers with the same innings restrictions. (I’m not including tables for all of these stats, but if you want to see for yourself, mosey on over to the Baseball Reference Play Index, where all of this data comes from.)

Martinez has really shut down the running game since becoming a full-time starter in 2015, however. Over that time period, he ranks fourth among all pitchers (lefty, righty, starter, and reliever alike) having at least 250 innings in SB/IP, yielding only four SB in nine attempts over 282 innings.

Rank Player SB IP SB/IP
1 David Price 1 336.2 0.00297
2 Wade Miley 2 281 0.00712
3 Yordano Ventura 3 250.2 0.01199
4 Carlos Martinez 4 282 0.01418
5 Chris Tillman 4 279.1 0.01433
6 Wei-Yin Chen 5 290 0.01724
7 Danny Salazar 5 284 0.01761
8 Johnny Cueto 6 334.1 0.01796
9 Chris Sale 6 328.2 0.01828
10 R.A. Dickey 6 324 0.01852

(Note: If you bump this down to 150 innings to get more relievers on the list, Martinez is still in the top 10 for SB/IP.)

Of the four pitchers ahead of him in the table, two are lefties. (Sidebar: How the hell is R.A. Dickey on this list given the fact that he throws a knuckleball? It seems like it should be really easy to steal on him given that.) Martinez is similarly ranked (fifth) if you look at SB/Total Baserunners over the same period; in short, Martinez is really, really good at controlling the running game.

Furthermore, reigning eight-time Gold Glove winner Yadier Molina was behind the dish attempting to throw Marte out. Molina ranks first among all catchers since 2002 in his ability to control the running game by the defensive metric rSB. Obviously Martinez’s ability to prevent the stolen base is helped by having Molina behind the dish, but the combination of these two has been deadly over the past season and a half, making Marte’s accomplishment all the more impressive.

The Martinez/Molina duo (and Martinez in general) has only allowed one other stolen base this season so far. Who was it? None other than Bartolo Colon! Actually, I’m kidding, it was Starling Marte, which is almost as crazy! He has the only two stolen bases this season against a guy who only gave up two all of last season. These are also the only two attempts against Martinez all season. On May 6, after a bunch of false starts, pickoff moves, foul balls, and laughs between Molina and Marte, he finally got his stolen base:

The thing I find most entertaining is how loose everyone seems, goofing off and laughing about the play that just happened, which seems relatively rare in this day of boring interviews and generic soundbites. Molina had a good laugh about that one, but he was pretty upset about the more recent stolen base.

There’s nothing to be mad about, though; Martinez and Molina simply got burned by the best baserunner in the game right now.


Inverse Clayton Kershaw

Clayton Kershaw is great. Really really great. Maybe hurt — but definitely great. But I’m not interested in examining Clayton Kershaw; I’m interested in examining Inverse Clayton Kershaw. I want to find the pitchers that have been most unlike Kershaw during the last calendar year. Kershaw has been the best — I want to find the worst.

Clayton Kershaw vs. League Average – Past Calendar Year
ERA FIP xFIP K% BB% HR/9 SwStr%
Clayton Kershaw 1.50 1.56 2.08 33.8% 2.9% 0.36 16.1%
League Average 4.13  4.11 4.07 20.8% 8.5% 1.11 10.0%
Difference -2.63 -2.55 -1.99 13.0% -5.6% -0.75 6.1%
Inverse Kershaw 6.76 6.66 6.06 7.8% 14.1% 1.86 3.9%
Data pulled 6/29/16

So wow. Did I mention Kershaw is great? Anyway, time to find Inverse Kershaw. First, I want to point out that the players below are still incredible at baseball. They are some of the most elite in the world, way better than all of us. Caveat aside, I’ll now examine the pitchers over the past calendar year who are most unlike Kershaw in each of the stats above — i.e. if Kershaw’s ERA is 2.63 below league average, whose is 2.63 above league average. When in doubt, I’ll defer to the guy with the most IP. At the end, I will name the Inverse Kershaw!

ERA

So, whose ERA has been a whopping 2.63 runs above league average? Coming in with an ERA of 6.75 we have Carlos Contreras. Contreras pitched 18.2 innings within the last year for the Reds out of the bullpen. You probably expected some 2016 Reds relievers to qualify, but Contreras posted these numbers exclusively in 2015 and then did not make the 2016 Reds bullpen. Yikes.

FIP

Noe Ramirez has worked to a 6.65 FIP in 24 IP for the Red Sox over the last year. Prior to 2016, then lead prospect analyst Dan Farnsworth said of Ramirez, “his stuff likely isn’t good enough to be more than bullpen filler.” Maybe not even that good.

xFIP

Well I’ll be damned. With 18.2 IP with an xFIP of 6.05 out of the Reds bullpen we have…Carlos Contreras.

K%

With a K% of exactly 7.8%, we find the final 13 IP of Dodger right-hander Carlos Frias‘ 2015 season (he hasn’t pitched yet in 2016). As a Cistulli darling, I imagine this is just a speed bump in Frias’ journey to becoming a Cy Young winner.

BB%

In 39.2 IP, Elvis Araujo of the Phillies has walked 14.0% of batters faced. In related news, Araujo was optioned to Triple-A Lehigh Valley on June 26.

HR/9

Matching our criteria exactly with 1.86 HR/9 allowed in 67.2 IP is Toronto starter Drew Hutchison. This figure doesn’t factor in his excellent work in Triple-A (.77 HR/9 allowed), and according to the Toronto Sun, Hutchison figures to be called up soon. Hopefully he can get the gopheritis under control and contribute for the Jays down the stretch.

SwStr%

I made a judgement call here. The pitcher with the most IP within 0.2% of the required 3.9% SwStr% is Jon Moscot and his 4.1% SwStr%. Moscot has posted that rate across 21.1 IP in five starts for the…gulp…Reds this year. Poor Reds fans.

The Inverse Kershaw

It is all fine and good (bad) to post inverse Kershaw numbers in one category, but I wanted to know the single pitcher that was most unlike Clayton Kershaw. More accurately, I wanted to find the pitcher whose performance has been as far below average as Kershaw’s has been above average. To do this, I began with a sample of all pitchers appearing in MLB over the last calendar year. I then calculated the number of standard deviations each of their component statistics were from the Inverse Kershaw numbers in the table above. The pitcher with the lowest sum of standard deviations will be named the Inverse Kershaw. This is exactly the methodology used by Jeff Sullivan for his pitch comps.

And the winner (loser?) is….Matt Harrison, formerly of the Texas Rangers, currently of the Phillies Disabled List. You may remember Harrison as the salary dump portion of the Cole Hamels to the Rangers trade. You will hopefully now remember him as the past calendar year’s Inverse Kershaw. The final numbers are below.

Clayton Kershaw vs. Matt Harrison – Past Calendar Year
ERA FIP xFIP K% BB% HR/9 SwStr%
Clayton Kershaw 1.50 1.56 2.08 33.8% 2.9% 0.36 16.1%
League Average 4.13  4.11 4.07 20.8% 8.5% 1.11 10.0%
Inverse Kershaw 6.76 6.66 6.06 7.8% 14.1% 1.86 3.9%
Matt Harrison 6.75 6.07 5.66 7.3% 8.7% 1.69 3.3%
Data pulled 6/29/16

So there you have it, the pitcher coming closest to being as far below average as Clayton Kershaw has been above average over the last year is Matt Harrison — the Inverse Kershaw. Just for fun, here is the same table as above, subbing out the 2016 Reds Bullpen for Matt Harrison.

Clayton Kershaw vs. Matt Harrison – Past Calendar Year
ERA FIP xFIP K% BB% HR/9 SwStr%
Clayton Kershaw 1.50 1.56 2.08 33.8% 2.9% 0.36 16.1%
League Average 4.13  4.11 4.07 20.8% 8.5% 1.11 10.0%
Inverse Kershaw 6.76 6.66 6.06 7.8% 14.1% 1.86 3.9%
2016 Reds Bullpen 6.08 6.02 5.16 18.9% 11.9% 1.95 9.7%
Data pulled 6/29/16

Poor Reds fans.


Identifying HR/FB Surgers Using Statcast

It seems that 2016 will be the year that Statcast begins to permeate Fantasy Baseball analysis. Recently there has been a wealth of articles exploring the possibilities of using these kinds of data. These pieces have provided relevant insights on how to improve our understanding of well-hit balls and launch angles. Also, they’ve facilitated access to information on exit velocity leaders and surgers, as well as provided thoughtful analyses to the possible workings behind some early-season breakouts.

However, there is still a lot we don’t know about Statcast data. For instance, we are uncertain of how consistent these skills are over time, both across seasons or within seasons. Also we don’t know what constitutes a relevant sample size or when rates are likely to stabilize. All in all, this makes using 2016 Statcast data to predict rest of season performance a potentially brash and faulty proposition. Having said that, we can’t help but to try; so here’s our attempt at using early-season 2016 Statcast data to partially predict future performance.

One of the early gospels of Statcast data analysis posits that the “sweet spot” for hitting homers comes from a combination of a launch angle in the range of 25 – 30 degrees and a 95+ MPH exit velocity. If this is indeed the ideal combination for hitting home runs, one could argue that players that have a higher share of fly balls that meet these criteria should perform better in other more traditional metrics such as HR/FB%.

Following this line of thought we dug up all the batted balls under the “sweet spot” criteria, and divided them by all balls hit at a launch angle of 25 degrees or higher (which MLB determines as fly balls) to come up with a Sweet Spot%. In an attempt to identify potential HR/FB% surgers, we compare Sweet Spot% and HR/FB% z-scores (to normalize each rate) for all qualified hitters with at least 25 fly balls and highlight the biggest gaps.  Here are the Top five gaps considering the games up to May 28th:

Name Team HR/FB  % HR/FB  %         Z-Score Sweet Spot % Sweet Spot % Z-Score Z-Score Diff
Kole Calhoun Angels 6% -1.15 26% 2.24 3.39
Stephen Piscotty Cardinals 11% -0.35 26% 2.33 2.68
Matt Carpenter Cardinals 16% 0.44 29% 2.73 2.29
Denard Span Giants 3% -1.66 15% 0.52 2.18
Yonder Alonso Athletics 3% -1.69 15% 0.43 2.12

Calhoun seems like a good candidate for a power uptick. He has the third-highest Sweet Spot% of 2016, and he has sustained similar Hard% and FB% to the previous two seasons. Yet somehow he has managed to cut his HR/FB% to less than half of what he put together in either 2014 or 2015.  More so, he has had some bad luck with balls hit in the “sweet spot”; his batting average in these kinds of balls is .500, whereas the league average is around .680. He is not killing fly balls in general, with an average exit velocity of 84.6 MPH, but if he keeps consistently hitting balls in the “sweet spot” range he should improve in the power department. Look out for a potential turnaround in the coming weeks and a return to 2015 HR/FB% levels.

Piscotty holds second place in the Sweet Spot% rankings. However, his FB% is very similar to what he did in 2015 whilst his Hard% is down from 38.5% to 32.5%. Lastly, he plays half of his games in Busch Stadium, which has a history of suppressing home runs. I would be cautious of expecting a major home-run surge, but in any case Piscotty is likely to at least sustain his performance in the power department, which would be welcome news to owners that got him at bargain prices.

Carpenter is another dweller of Busch Stadium, however his outlook might be a bit different. He is the absolute leader in Sweet Spot%. He is posting the highest Hard% and FB% marks of his career. Carpenter is also crushing his fly balls in general, with an average Exit Velocity of 93.7 MPH. Just as a point of reference Miguel Cabrera, Josh Donaldson and Giancarlo Stanton fail to reach an average of 93 MPH on their own fly balls. Lastly, he has had some tough luck with balls hit in the “sweet spot”, posting a batting average of just .420. Carpenter is already putting up the highest HR/FB% of his career, and he is a 30-year-old veteran of slap-hitting fame, but the power looks legit and perhaps there is more to come.

Denard Span and Yonder Alonso show up in this list not because of their Sweet Spot% prowess but rather due to their putrid HR/FB%. They barely crack the Top 50 in Sweet Spot%. They play half their games in two of the bottom three parks for HR Park Factor. Span is putting up his lowest FB% and Hard% rates since 2013, when he ended up with a HR/FB% of 3.4%. Meanwhile, Yonder’s rates most closely resemble those of 2012, when he had a HR/FB of 6.2%. Whilst their batting average of “sweet spot” batted balls is just .500, there is nothing to look here. In any case, their power situation looks to improve from bad to mediocre.

If you are interested in the perusing the Top 50 gaps between HR/FB% and Sweet Spot%, please find them below:

Name Team HR/FB  % HR/FB  %          Z-Score Sweet Spot % Sweet Spot % Z-Score Z-Score Diff
Kole Calhoun Angels 6% -1.15 26% 2.24 3.39
Stephen Piscotty Cardinals 11% -0.35 26% 2.33 2.68
Matt Carpenter Cardinals 16% 0.44 29% 2.73 2.29
Denard Span Giants 3% -1.66 15% 0.52 2.18
Yonder Alonso Athletics 3% -1.69 15% 0.43 2.12
Kendrys Morales Royals 10% -0.61 21% 1.38 1.99
Addison Russell Cubs 12% -0.27 22% 1.67 1.94
Yadier Molina Cardinals 2% -1.72 13% 0.11 1.83
Adam Jones Orioles 11% -0.46 20% 1.29 1.75
Alcides Escobar Royals 0% -2.10 10% -0.44 1.66
Jose Abreu White Sox 11% -0.35 19% 1.11 1.46
Joe Mauer Twins 17% 0.56 24% 1.96 1.40
Chris Owings Diamondbacks 3% -1.59 11% -0.26 1.32
Jacoby Ellsbury Yankees 5% -1.28 12% -0.09 1.19
Justin Turner Dodgers 6% -1.20 12% -0.01 1.19
Victor Martinez Tigers 12% -0.19 18% 0.95 1.14
Daniel Murphy Nationals 10% -0.60 16% 0.54 1.14
Justin Upton Tigers 4% -1.43 11% -0.29 1.14
Josh Harrison Pirates 5% -1.37 11% -0.25 1.12
Anthony Rendon Nationals 6% -1.23 12% -0.11 1.12
Corey Dickerson Rays 16% 0.42 21% 1.50 1.07
Brandon Crawford Giants 11% -0.41 16% 0.66 1.07
Ian Desmond Rangers 16% 0.35 21% 1.41 1.06
Derek Norris Padres 12% -0.30 17% 0.74 1.04
Ryan Zimmerman Nationals 19% 0.78 23% 1.81 1.03
Gregory Polanco Pirates 14% 0.11 19% 1.11 1.00
Austin Jackson White Sox 0% -2.10 6% -1.13 0.97
Nick Markakis Braves 2% -1.79 7% -0.86 0.93
Corey Seager Dodgers 18% 0.66 22% 1.56 0.91
Michael Saunders Blue Jays 20% 1.00 24% 1.88 0.89
Mike Napoli Indians 23% 1.38 26% 2.27 0.88
Brandon Belt Giants 7% -0.97 11% -0.15 0.81
Matt Kemp Padres 17% 0.59 20% 1.36 0.77
Nick Ahmed Diamondbacks 8% -0.81 12% -0.05 0.77
Matt Duffy Giants 4% -1.45 8% -0.73 0.71
David Ortiz Red Sox 19% 0.90 21% 1.53 0.63
Joe Panik Giants 9% -0.69 12% -0.06 0.63
Elvis Andrus Rangers 2% -1.72 6% -1.10 0.63
Brandon Phillips Reds 11% -0.41 14% 0.21 0.62
Adam Eaton White Sox 8% -0.81 11% -0.20 0.62
Gerardo Parra Rockies 8% -0.87 11% -0.26 0.61
C.J. Cron Angels 6% -1.18 9% -0.58 0.61
Dexter Fowler Cubs 13% -0.04 16% 0.56 0.60
Jose Altuve Astros 17% 0.53 19% 1.11 0.58
Prince Fielder Rangers 4% -1.42 7% -0.90 0.51
Jose Ramirez Indians 7% -1.09 9% -0.58 0.51
Joey Rickard Orioles 8% -0.91 10% -0.42 0.48
Asdrubal Cabrera Mets 7% -1.00 9% -0.53 0.46
Mark Teixeira Yankees 10% -0.50 12% -0.05 0.46
Ben Zobrist Cubs 13% -0.12 14% 0.34 0.45

Note: This analysis is also featured in our emerging blog www.theimperfectgame.com