Archive for Hall of Fame

Predicting Hall of Famers with Machine Learning

The questions of who should and who will make it into the Baseball Hall of Fame have inspired countless debates, books, articles, and statistics. From the early days of statistical milestones like 3,000 hits, 500 home runs, and 300 wins to more advanced measurements like WAR and JAWS, and throughout baseball’s many eras, many have attempted to tackle the task. The discussion is more or less ongoing but peaks whenever a prominent player retires and during every winter ballot season. Innovations like the Hall of Fame Tracker have only added fuel to the fire.

I wanted to see if machine learning was up to the task of predicting who’ll get enshrined. I trained and evaluated a prediction model and used it to predict induction chances for current and recently retired players. I specifically wanted to see if I could get a sense of how some of the game’s younger superstars are doing, because who doesn’t want to talk about how good Juan Soto is?

In this article I discuss building and evaluating the model and show the predictions it makes. If you’re interested in the former, continue reading; if you’re interested only in the predictions, feel free to skip to the end. Read the rest of this entry »


Dick Arndt and the Saga of Henry Aaron’s Historic No. 755

On July 20, 1976, Dick Arndt got up in the morning and shuffled off to his job as a vocational rehabilitation counselor. Once his day shift ended, Dick headed to his part-time gig as the Brewers’ groundskeeper at Milwaukee County Stadium, where he was in charge of opening and closing the gate for the bullpen cart. This, however, would be no ordinary day for Arndt.

Aaron ball 1-page-0
Photo credit: Journal Photo/Eugene Burton

The sparse crowd of 10,134 that night — about a fifth of capacity — was there to see the Angels take on the lowly Brewers, part of the draw being 42-year-old Hank Aaron during his farewell season. In the seventh inning, Arndt was sitting in the left-field stands keeping a lookout for any signals that a pitching change was to be made. With the Brewers ahead 2-1, George Scott hit a two-run home run, increasing the Milwaukee lead. Aaron came up next and drove a Dick Drago offering on a line into the left-field seats, flying about 10 feet over Arndt’s head. The ball settled into an empty row, where Arndt quickly retrieved it. Read the rest of this entry »


The Brief But Brilliant Pitcher

With the regular season over, my routine Baseball-Reference wanderings brought me to the JAWS rankings for pitchers. I had been tracking a handful of current players throughout the year and I wanted to see where they’d finished up. Before getting very far, however, I was quickly reminded that there’s a lot to be desired when it comes to pitcher recognition in the Hall of Fame. Why is it that owners of some of the best pitching seasons of the twentieth century have been left out of the Hall of Fame? Surely there is a level of brilliance that eclipses brevity and manages to leave an indelible mark in baseball history.

Sandy Koufax is a prime example of this. He had just six seasons of 100-plus innings where he had an ERA+ over 106, accumulating 48.9 career WAR and 46.0 peak WAR for a JAWS score of 47.4, far short of the Hall of Fame averages of 73.2/49.9/61.5 for starting pitchers. In a vacuum, one could view his JAWS numbers and dismiss his career as good but not worth of the Hall of Fame. But we don’t live in a vacuum. Despite falling short across the JAWS board, Mr. Koufax was nevertheless inducted in his first year of eligibility by appearing on a healthy 86.9% of ballots due to the fact that his final four years were the greatest final four years by a pitcher in baseball history. In terms of WAR, they each rank among the top 220 pitching seasons since 1920, with his 1963 and ’66 seasons ranking 13th and 22nd best of all time, respectively. Averaging 24 wins, eight shutouts, 298 innings, 307 strikeouts, and 9.1 WAR, these seasons have come to define the era. The 1972 baseball writers understood that his brilliance outshone his brevity when they voted him in.

However, while Koufax may be the archetype of the brilliant but brief ace, he was an outlier only in terms of how his meteoric career was recognized by Hall of Fame voters. When sampling the 250 greatest pitching seasons by WAR since 1920, did you know that only 43% of them belong to Hall of Famers? As a basis of comparison, 61% of the 250 greatest position players’ seasons by WAR since 1920 belong to Hall of Famers. These differences become even more stark as we narrow down to the 100, 50, 25, and 10 greatest seasons and exclude not-yet-eligible players, players connected to steroid allegations, or players banned from the game (Pete Rose). Read the rest of this entry »


Mike Trout and The 1% Club

Like many other followers of FanGraphs, I never seem to get enough articles about Mike Trout — the general theme being: “another way Mike Trout is so great” — so I want to share one of my own. Contrary to popular belief, Trout did not invent WAR; even more shocking, the metric wasn’t developed for the primary purpose of showcasing how valuable he is. But that of course is what it does do. Many readers may know that beginning with his first full season, at age 20, and continuing up to his most recent, age 26, Kid Fish has had the most WAR through every season but one — his age-25 season, when he missed nearly fifty games with an injury — than any other player in history. So it shouldn’t be surprising that he is one of just 20 members of what I call The 1% Club: players who have equaled or exceeded 0.010 WAR per PA for their entire careers.

In fact, he’s currently second only to Babe Ruth:

Career War/PA Of 0.010 Or Greater
Player fWAR/PA (career) fWAR/PA (age 26)
Babe Ruth 0.0159 0.0172
Mike Trout 0.0138 0.0138
Rogers Hornsby 0.0138 0.0134
Ted Williams 0.0133 0.0139
Barry Bonds 0.0130 0.0107
Lou Gehrig 0.0120 0.0121
Willie Mays 0.0120 0.0120
Honus Wagner 0.0118 0.0080
Ty Cobb 0.0114 0.0131
Mickey Mantle 0.0113 0.0129
Tris Speaker 0.0109 0.0123
Joe DiMaggio 0.0108 0.0123
Joe Jackson 0.0106 0.0109
Mike Schmidt 0.0106 0.0109
Jackie Robinson 0.0106*
Jimmy Foxx 0.0105 0.0122
Dan Brouthers 0.0104 0.0118
Nap LaJoie 0.0103* 0.0095
Eddie Collins 0.0100 0.0125
Stan Musial 0.0100 0.0116
*rWAR

This list is based mostly on FanGraphs’s fWAR, and is for players with a minimum of 50 career WAR. However, two players, Nap LaJoie and Jackie Robinson, don’t quite qualify by fWAR, but they do if we use Baseball Reference’s rWAR (all the others on the list qualify using either metric). Trout is the only active player on the list, though if we lower the bar to 30 career fWAR, three more players appear, including Mookie Betts, who is at 0.0104. Even lowering the criterion to just 10 fWAR adds just one more active player, Aaron Judge (0.0103). Read the rest of this entry »


Who’s the Best (non-Bonds*) Baseball Family in History?

One of my favorite things about baseball is its deep reverence for history. While the relatively recent advent of sabermetrics is sometimes scorned by “traditionalists,” baseball has always been a data-loving sport. So much so, the man credited with inventing the box score all the way back in 1859 — a full year before Abraham Lincoln was elected President — was given a prestigious spot in the Hall of Fame. Any discussion of “who’s the best?” is always going to be subjective, and that’s part of the fun.  Whether you’re a casual fan, avid Fangraphs reader, or true baseball historian, I think this article will offer some insight (and fun debate) for everyone.

As it happens, the term “WAR” meant something very different then.

Even casual baseball fans have an understanding of batting average, home runs, runs batted in — all statistics that have been around for more than a century — and still have plenty of relevance even in the era of analytics. Some might say, baseball’s respect for tradition runs so deep, that there was (and still is) a great deal of mismanagement and inefficiency in areas like scouting, player utilization, and player valuation. Perhaps one thing that worries traditionalists is that the game is being reduced to a “science” such that we are removing the fun of debating things like “who’s the best?” While I hope even staunch traditionalists understand that on-base percentage is more important than batting average in determining offensive value, allow me to put your mind at ease: we are a long, long, way from being able to predict with any reasonable accuracy/confidence how a player will perform. Suffice it to say, there is still plenty to debate when it comes to comparing players from past and present, and projecting the future. As you read, take part in the polls to cast your vote in the head-to-head “best family” debate. At the end, you can cast your overall vote.

In more than 140 years as the National Pastime, fewer than 20,000 players have ever played in a Major League Baseball game. For some perspective, only about 10% of players who are drafted will ever reach The Show; and even among first-round picks — youngsters so highly sought after that they are made millionaires before they even play a game in the minor leagues — only about two-thirds will make it the majors, and even most of them won’t amount to much. With so few players to ever make the big leagues, with so many barriers to success, it’s amazing to learn just how many had parents or siblings in the majors. Unlike a sport such as basketball where most players are very tall, thus heritability playing an obvious role, Major League Baseball players are mostly normal-sized human beings (the average player is about 6’1 190) with no immediately evident genetic superiority compared to the average Joe.

Pictured: elite professional athlete whose dad also played in the MLB (photo from Men’s Health)

Interestingly, genetics may actually play an even more vital role in success in baseball than in basketball. You have probably heard that hitting a baseball is the hardest thing to do in all of sports, and that’s probably true (Ted Williams said it, who am I to argue?). It’s not enough that pitchers throw the ball as hard as they can with pinpoint control, they also throw the ball as hard as they can with pinpoint control and make it move. 

Good luck! (Source: MLB GIFS)

When it comes to hitting a baseball at the professional level, it requires an elite combination of hand-eye coordination, strength, reaction time, visual acuity, and I assume some sort of animal sacrifice. It turns out, the average MLB player has 20/12 vision. If you’re not sure why that is so insane, consider that the best possible vision a human could have is somewhere between 20/10 and 20/8. When your decision whether or not to swing — and how to position your hands and body for that swing — is within a window of literally milliseconds, the difference between elite and unknown could depend on a few extra milliseconds of pitch recognition. While vision is only one factor, it does appear to be an important prerequisite in success at the highest level. When you have such extreme outliers genetically, it at least somewhat answers the question “why have there been so many siblings/parents to play Major League Baseball?” Which brings us to the real question:

Who is the best family to ever play?

Here are the basic criteria I looked at in my research:

  1. Grandparents, parents, siblings — minimum 5 seasons played
  2. Fangraphs WAR
  3. Minimum of 6 “third-WAR” combined
  4. No family member active in the minor leagues

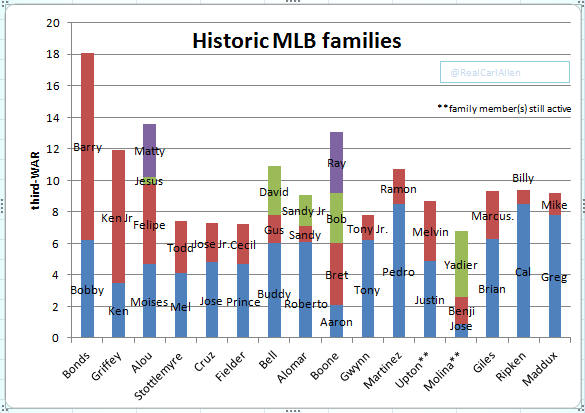
While WAR (wins above replacement) may be an imperfect statistic, it is a great place to start, as it allows us to compare players from different eras and players from different positions with one number. I decided to, admittedly somewhat arbitrarily, use the player’s third-best season in terms of WAR (third-WAR) to value them. To me, this fairly encompasses how good the player was in their prime, while excluding outlier seasons. It also avoids the difficulty of understating a player’s greatness just because they enjoyed a long career, as might happen if you simply used a career average or median, or overrating a player who was good for awhile but never great. Based on this, let’s take a look at some of the greatest baseball families:

third-WAR is the player’s WAR in their third-best season. While somewhat arbitrary, it is a metric that reflects a player’s skill in his prime, while removing outlier seasons.

From this, as expected, the Bonds family is far and away the most impressive. While you may be thinking “but Barry’s career should have an asterisk” don’t forget that even before his alien stretch starting with 73 home runs he had already had some of the best seasons in baseball history. And his father Bobby was responsible for five of the first ten 30 home run/30 stolen base seasons in MLB history. After the Bonds family, who would you take on your father-son-sibling squad?

Before I did any research, the obvious answer seemed like the Griffeys. In a lot of ways, the Griffey family mirrors the Bonds’ in that dad was great but under-appreciated in his era, while Junior’s greatness had him in the conversation of “greatest of all time” during his prime. Of course, injuries plagued Ken Jr., while Barry enjoyed a long, healthy career. As I delved deeper though, I was surprised to find that the Griffeys may not even be the best baseball family in Cincinnati Reds history.

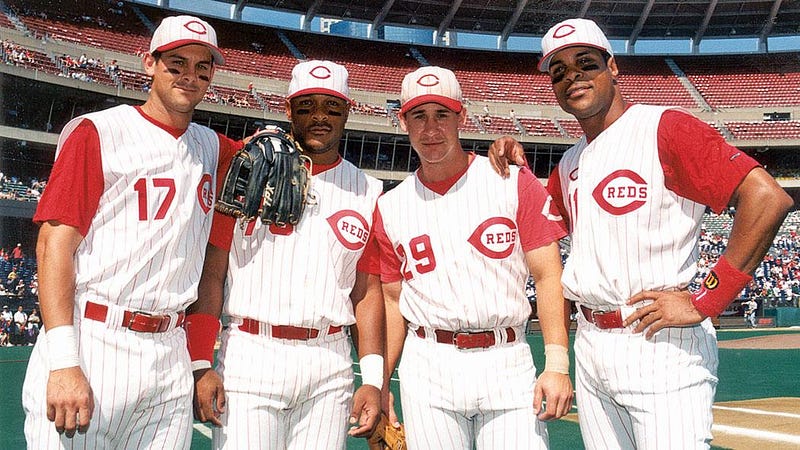
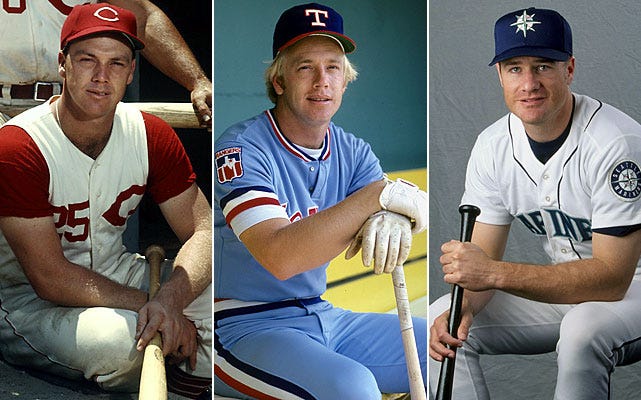
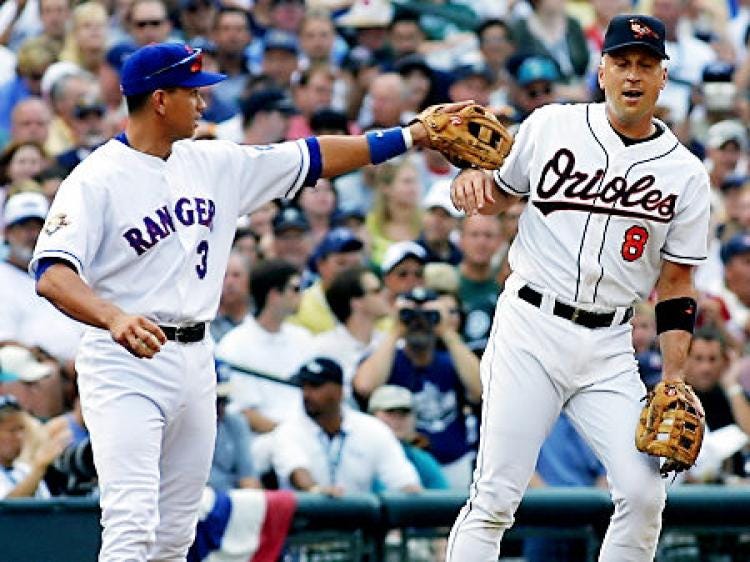
This Boone-Larkin-Boone-Larkin infield actually appeared together, but just once. Stephen Larkin, younger brother of Hall of Famer Barry, only played in one MLB game. (Photo credit Cincinnati Reds)

Four Boones or two Griffeys?

Now comes the discussion of quality over quantity. No one would argue that Ken Jr. in his prime wasn’t superior to any of the Boones, but the Boone package includes four very good players. To complicate matters in this very serious cross-generational debate, Aaron, Bret, Bob, and Ray even played unique positions for much of their career (3B, 2B, C, and SS respectively).

So who would you take? Below are the “third-WAR” seasons for each family.

Bret Boone, 2B: .278/.339/.462 (3.9 WAR) 24 HR/107 RBI, Gold Glove
Aaron Boone, 3B: .267/.327/.453 (2.1 WAR), 24 HR/96 RBI/23 SB
Bob Boone, C: .256/.310/.337 (3.2 WAR), 7 HR/58 RBI, Gold Glove
Ray Boone, SS: .295/.376/.466 (3.9 WAR), 20 HR/85 RBI/4 SB

Ken Griffey, LF: .294/.364/.454 (3.5 WAR), 13 HR/85 RBI/23 SB
Griffey Jr CF: .309/.408/.617 (8.4 WAR), 45 HR/109 RBI/17 SB, Gold Glove

Is there a wrong answer here? Looking only at WAR, the Boones edge out the Griffeys. The case to be made for the Boones is that you’d be able to fill four very important positions with all-star caliber players. But if you want to get technical, not all WAR is created equal (for example, one 8 WAR player is better than four 2 WAR players, because 2 WAR players are easier to replace). A superstar Junior and an all-star Senior is a very tough duo to pass on. But at the risk of repeating history and trading four players for Griffey (more on Mike Cameron in part two — dads with prospects) I’m going to go with the quartet of Boones.

What do you think? Go here to vote.

I’m not sure if “launching knuckleballs for game-winning home runs to send your team to the World Series” is a stat, but I know who leads it. (Photo credit: InsideSoCal)

What about the Alous?

Not to be outdone, the Alou family has an important place in this discourse, too. By the third-WAR metric, they actually edge out the Boones for the #2 spot. The four big leaguers from their family present a noteworthy, even if less well-rounded bunch than the Boones:

Moises Alou, OF .339/.397/.592 (4.7 WAR), 22 HR/78 RBI/7 SB
Felipe Alou, OF .297/.338/.481 (5.1 WAR), 23 HR/78 RBI/8 SB
Jesus Alou, OF .324/.345/.417 (0.4 WAR), 2 HR/19 RBI, 3.3% K%
Matty Alou, OF .338/.372/.413 (3.4 WAR), 2 HR/28 RBI/16 SB, 7.2% K%

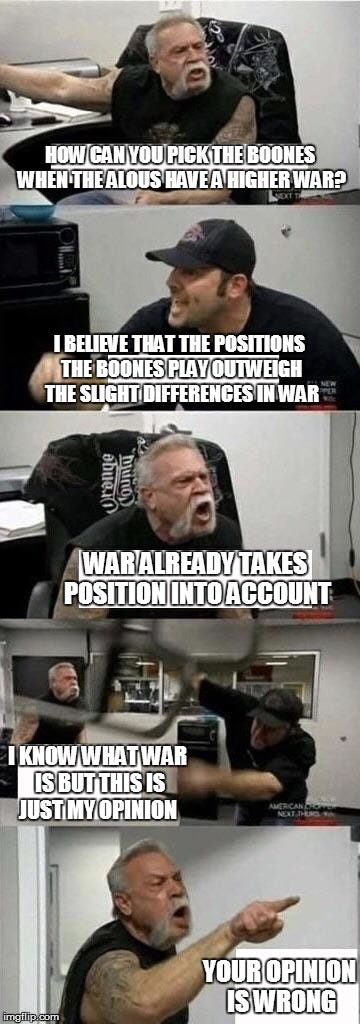
Moises and Felipe make for a formidable tandem themselves, but the high average and contact rates of Jesus and Matty are what makes this foursome competitive with the Boones. Ignoring the fact that we have four outfielders (Matty and Felipe both played some first base as well) this group compares favorably to the Boones on paper; Moises and Felipe would be preferable to any of the Boones, while Matty is a fun guy to remember and had a nice career too. But for me, the fact that the Boones cover three premium positions (C, 2B, SS) makes up for the less impressive offensive numbers. Perhaps I’m biased in that I grew up watching Aaron and Bret, while Moises is the only Alou I had a chance to see play.

In any case, the WAR (which does take into account positional value) disagrees with my opinion — what do you think? Vote here.

“Your opinion is wrong” is how every good debate should end.

Bells and Alomars

Moving on to the trios, we’ll start with the Bell family. We have Buddy, one of the most underrated players in history, leading the group; Buddy won six gold gloves as a third baseman, hit for average and power, but never received much attention (or Hall of Fame consideration) because he played for some bad teams and was a contemporary of the best third baseman in history. David was a true journeyman, playing for 7 teams in 12 seasons, but put together some very good years as a utility infielder. Grandpa Gus was lucky enough to play for the Redlegs when they actually changed their name to “Redlegs.”

Youngest brother Mike appeared in a few games in 2000, but didn’t qualify for this list. (Photo credit: Blavity)

The Alomars, led by Hall of Famer Roberto, would make for an elite defensive squad in any era: Sandy Jr. behind the plate with Sandy Sr. and Roberto as the double play combination at short and second.

While Sandy Jr. certainly looked the part of a power hitter (he’s listed at both6’3 and 6’5 but was remarkably athletic for his size) he never hit more than 21 HR in a season. I was surprised to learn, that other than his breakout .324/.354/.545 season during which he mashed those 21 homers, he was mostly an average offensive catcher for his career. Sandy Sr. had a very long, successful career in the MLB as a speed-and-defense middle infielder, though he was never feared at the plate. Roberto, meanwhile, was one of the most valuable players of the era; he played a premium position at second base (and did so quite well — hence the ten gold gloves) while also hitting for average, power, and being a force on the bases. For a stretch of ten seasons from 1992–2001, Roberto hit .300 nine times, posted a double-digit walk rate six times, and in each of those six seasons he walked more than he struck out. He also won nine gold gloves, and stole more than 300 bases in that time frame. The Alomar versus Bell comparison is tough, if only because Roberto was so damn good.

Buddy Bell, 3B: .329/.379/.498 (6.0 WAR) 17 HR/83 RBI, Gold Glove
David Bell, 2B/3B: .261/.333/.429 (3.1 WAR) 20 HR/73 RBI, 12.7% K%
Gus Bell, OF: .299/.349/.465 (1.8 WAR) 17 HR/101 RBI/5 SB, 8.5% K%

R. Alomar, 2B: .310/.405/.427 (6.1 WAR) 8 HR/76 RBI/49 SB, Gold Glove
S. Alomar, 2B/SS: .239/.277/.305 (1.0 WAR) 2 HR/39 RBI/28 SB
S. Alomar Jr., C: .288/.347/.490 (2.0 WAR) 14 HR/43 RBI/8 SB, 9.7% K%

As hard as it is for me to do — given my preference for guys who play up the middle (and totally healthy baseball man crush on Roberto Alomar) — the Buddy-David-Gus combination is just too solid for me. I think Buddy is very underrated, and although not on the level of greatness Roberto, I’d take David and Gus over Sandy Jr. and Sr. You could just as easily make the case for the Alomars, as I did for the Boones, that despite lower WAR you might prefer the premium positions.

Would you pick the Bells or the Alomars?

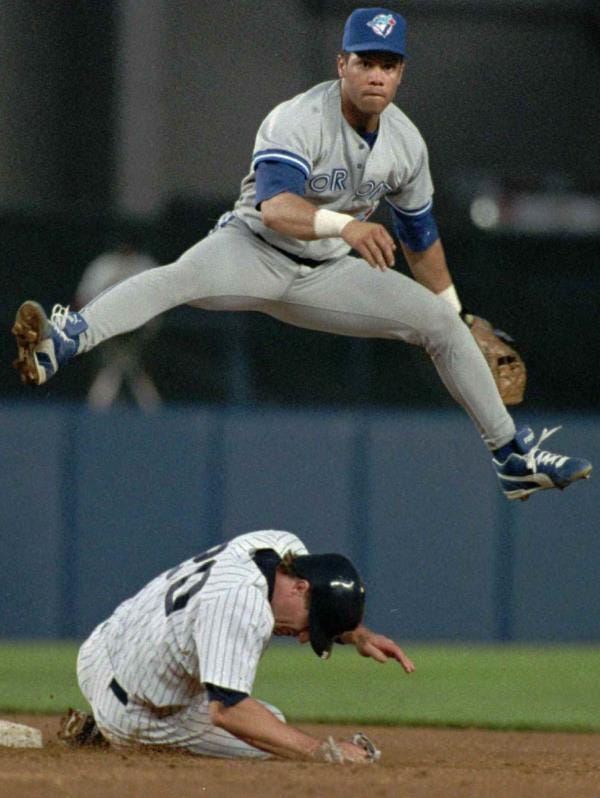
If you don’t have a baseball crush on Roberto Alomar, I didn’t do him justice. (Photo credit: El Nuevo Dia)

Martinezes and the importance of pitching

Yes, it’s true, that is how you make “Martinez” plural. Now that that’s out of the way, let’s talk about the family that I think will be the toughest to categorize.

So far, we’ve only had families of position players on our list. While theStottlemyres represent an impressive pitching duo, it’s hard to compete with Pedro and Ramon. While Pedro’s highest WAR seasons don’t match up to those of Bonds, he has a real case for the best pitcher of all-time, coming from an era that was totally unfair to pitchers. To complicate matters, we are faced with the fact that pitching wins championships. And now we are faced with some limitations of the WAR statistic. Just for fun, which season do you think was better? (follow link to vote):

Griffey Jr CF: .309/.408/.617 (8.4 WAR), 45 HR/109 RBI/17 SB, Gold Glove
Pedro Martinez, P: 17–8, 241.1 IP 1.90 ERA/2.39 FIP (8.5 WAR) 32.2% K%

Considering that these seasons are even from the same era, we aren’t even tasked with grading on a curve. WAR would give a slight edge to Pedro in this category — though basically a tossup. Here’s the Martinez family compared to the Griffeys:

Pedro Martinez, P: 17–8, 241.1 IP, 1.90 ERA/2.39 FIP (8.5 WAR) 32.2% K%
Ramon Martinez, P: 17–7, 206.1 IP, 3.66 ERA/4.21 FIP (2.2 WAR)

Ken Griffey, LF: .294/.364/.454 (3.5 WAR), 13 HR/85 RBI/23 SB
Griffey Jr CF: .309/.408/.617 (8.4 WAR), 45 HR/109 RBI/17 SB, Gold Glove

From this, the Griffey family seems far superior to the Martinezes. Why, then, do I really want to pick Martinez family? I think that depends on how you think about the question “who is best?” If you view the question as an observer, and are merely comparing groups of stats, the Griffeys are the clear choice. But if you are like me, and for some reason imagine yourself picking these families to participate on your “team” then you might find yourself taking the dominant, ace pitcher over a Hall-of-Famer and All-Star combo.

Go here to vote between the Martinezes and Griffeys. 

If there was a 0.000001% chance it would work, I’d build the shit out of some fields (Field of Dreams).

Greg and Mike Maddux

Speaking of dominant aces, the Maddux family creates an almost impossible choice between pitching families. While Mike had a successful career, mostly as a reliever for ten different teams across fifteen seasons, it was younger brother Greg that puts this duo in the same category as Pedro and Ramon.

For an era dominated by batters that were bigger, faster, and stronger than ever before, it’s suiting that one of the purest finesse pitchers in history shut them down so consistently. Like Pedro, Greg did not have what most would consider ideal size for a pitcher; unlike Pedro, Greg never posted gaudy strikeout numbers, and relied on pinpoint command and pitch movement. 

This tailing fastball, combined with pinpoint command, helped make Maddux absolutely dominant.

The young, lanky version of Maddux topped out in the mid-90s according to scouting reports at the time. However, many of those same scouts doubted his ability to make it as a starter in the Majors. He struggled mightily in his first season with the Cubs, and again the following season even with extended innings: his ERA was north of 5.5 both seasons. Even still, scouts were turning the corner on their evaluations, noting his solid “stuff” and athleticism — in those rough two seasons he was only 20 and 21 years old. He broke out in a big way the following season, evolving into the “Mad Dog” we know today, largely thanks to his improvements in command and less reliance on a hard fastball.

After five more great seasons with the Cubs, Greg left via Free Agency for the Braves. The already great Maddux somehow got even better with the Braves. Across a span of ten seasons, Maddux posted — get this — more than 72 WAR. While Pedro was more dominant at his peak, Maddux was elite for a much longer span, posting a WAR over 5 for a full twelve seasons. For comparison, we have to lower the bar to 3 WAR to find twelve seasons for Pedro. At 3 WAR, Greg had nine-freaking-teen seasons (as in, 19) where he cleared that. And I guess the eighteen gold gloves that Greg won are worth mentioning, too.

This is what makes the Pedro vs. Greg debate tough: is a long span of elite performance more impressive than a shorter span of flat dominance? If you think the two are close, does the fact that Ramon was more valuable than Mike make a difference in the best pitching family debate?

Pedro Martinez, P: 17–8, 241.1 IP, 1.90 ERA/2.39 FIP (8.5 WAR) 32.2% K%
Ramon Martinez, P: 17–7, 206.1 IP, 3.66 ERA/4.21 FIP (2.2 WAR)

Greg Maddux, P: 15–11, 245 IP, 2.72 ERA/2.73 FIP (7.8 WAR), Gold Glove
Mike Maddux, P: 7–2, 5 SV, 98.2 IP, 2.46 ERA/3.08 FIP (1.4 WAR)

Go here to vote between these two pitching families.

Ripkens

While Ryan Ripken is still an active minor league player, which would technically make the Ripkens a part of my part two discussion of families with active prospects (will be linked once article is complete) I decided to include them here because Ryan doesn’t seem to have much promise as a 24 year old struggling in A ball. Barring some very late blooming, it’s just Cal and Billy representing the Ripkens. I have to admit, while I enjoy all of the research I’ve done to put this article together, the most enlightening research has been on that of Cal.

As a relatively young baseball fan, this is about the beginning of my experience watching Cal play. (Photo credit: NY Daily News)

While his durability and the number 2632 are probably the first things that come to mind when you think of Cal Ripken Jr., this amazing consecutive games played record (which I believe will never be broken) may actually be a disservice to him, in that it overshadows just how great of a player he was. He is credited with being the progenitor of offensively-capable, taller shortstops, but he is still in my opinion the greatest shortstop not named Rodriguez to ever play. He hit for average, power, took walks, didn’t strike out much, and was highly regarded defensively (2 Gold Gloves, and probably would have had more if not for Vizquel). In terms of longevity, Cal posted fifteen straight seasons of 3.5+ WAR. In terms of an elite prime, he had a stretch of nine years in which his WAR was 5+ in eight of them.

As far as greatness goes, this is a rare time when “Hall of Famer” doesn’t do a player justice. (Photo credit)

When you tell your children of Cal Ripken, lead with the numbers that show his greatness…then tell them he didn’t miss a game for more than sixteen full seasons.

Cal Ripken, SS: .317/.371/.517 (8.5 WAR) 27 HR/102 RBI, MVP
Billy Ripken, 2B
: .239/.284/.305 (0.9 WAR) 2 HR/26 RBI/1 SB

Billy was a rightful big leaguer — which isn’t always the case when it comes to family members with famous last names — but mostly a light hitter who made himself valuable by being a very good defender.

Since Cal Ripken and Greg Maddux both had long, glorious careers with a period of dominance, let’s compare their families. Who would you take?

Gwynns, Uptons, Fielders, and Cruzes

As for the honorable mentions, there are some impressive duos, and I’m sure I inevitably missed some.

Tony Gwynn, RF: .329/.381/.467 (6.2 WAR) 14 HR/59 RBI/37 SB
Tony Gwynn Jr., CF: .256/.308/.353 (1.6 WAR) 2 HR/22 RBI/22 SB

Gwynn Sr. might have been the purest hitter ever. His career average was an astonishing .338, and he walked (7.7%) far more than he struck out (4.2%). His final season in the league, at age 41, he went .324/.384/.461 and still walked more than he struck out. There’s no doubt that he could have contributed for longer, had he chosen to do so. Gwynn Jr. had a few solid seasons of his own, with great speed and plate discipline, but never hit for much average or power.

Justin Upton, OF: .300/.366/.532 (4.9 WAR) 26 HR/86 RBI/20 SB
Melvin Upton, OF: .237/.322/.424 (3.8 WAR) 18 HR/62 RBI/42 SB

The book on Justin hasn’t really changed since he was drafted #1 overall in 2005: great hitter, good speed. His brother Melvin (formerly B.J.) was drafted #2 overall as a shortstop in 2002. While Justin Upton still has plenty of years ahead of him at just 30 years old, older brother Melvin looks to be nearing the end of an intriguing career. After holding his own offensively as a 20 year old, but with some difficulties defensively at SS, Melvin was moved to CF where he thrived. At age 23, he broke out with a .300/.386/.508 slash line — with 24 HR and 22 SB. He followed that up with a less impressive .273/.383/.401 season, but added 44 SB. The power, speed, plate discipline, and defensive abilities were all there; though he never quite became a superstar he did have a productive career. It’s worth mentioning Dmitri and Delmon Young, who did not reach the minimum third-WAR threshold, but were drafted #4 and #1 overall respectively, and were the first brothers to be taken in the top 5.

Prince Fielder, 1B: .299/.415/.566 (4.7 WAR) 38 HR/120 RBI, 15.5% BB%
Cecil Fielder, 1B: .244/.325/.458 (2.5 WAR) 35 HR/124 RBI, 10.8% BB%

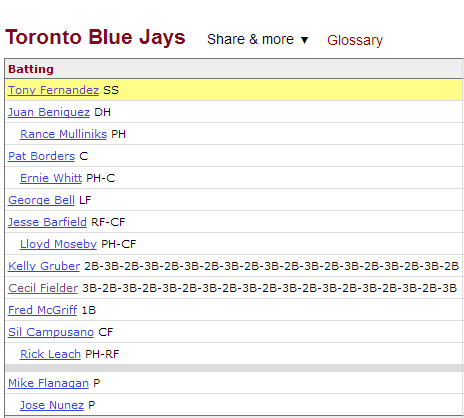
It’s safe to say that Prince made his dad proud with his career, even if it ended a few years too soon due to injury. While the notoriously chubby Prince stole more bases (18) than his hulking father (2) these guys were paid to mash. Prince was the better overall hitter, but his dad still holds the family home run record with 51 (Prince topped out at 50). By some wild coincidence, both father and son finished their careers with the same number of home runs — 319. While Prince only ever played first base, Cecil was wedged into the lineup at third and even second base, giving us this great box score:

Dammit I love baseball: Cecil Fielder and Kelly Gruber swapping positions 18 times, even mid at-bat. (Source)

Jose Cruz, OF: .315/.376/.460 (4.8 WAR) 10 HR/83 RBI/37 SB
Jose Cruz Jr., OF: .241/.358/.433 (2.5 WAR) 14 HR/45 RBI/14 SB, 15.5% BB%

In this case, junior didn’t quite live up to the legacy of his dad — but it was a high bar to reach. Cruz Sr. had seven seasons of 4+ WAR, and twelve consecutive seasons of 2+ WAR. Cruz Jr. had a 30/30 year and a few other productive seasons, but it was a tough era to stand out as a bat-first outfielder. Which leads us to…

The forgotten family of baseball

In putting together this list, I almost neglected to include the Gileses, and that’s a major oversight. It’s a mistake I don’t want saavy baseball fans who value knowledge about random baseball history to make. Most of the other articles I found on the topic don’t even mention the Giles family at all — it seems the “underrated” moniker has stuck with them long into retirement. Check out these third-war seasons:

Brian Giles, OF: .315/.432/.594 (6.3 WAR) 35 HR/123 RBI 16.6% BB%
Marcus Giles, 2B: .311/.378/.433 (3.0 WAR) 8 HR/48 RBI/17 SB

Unlike Marcus who had a few great seasons and was gone, perhaps a beneficiary of the “third-WAR” metric, Brian was a truly elite outfielder for about a decade.

Brian’s career began in the unenviable position of being an unheralded prospect — drafted in the 17th round — stuck in the minor leagues behind an outfield consisting of Ramirez, Lofton, Belle. On top of that, the acquisition of veterans (and future Hall of Famers) Dave Winfield and Eddie Murray to fill the Indians’ DH vacancy effectively blocked Giles from any chance at-bats. Once Murray was traded in mid-1996, Giles played in 51 games, posting an impressive .355/.434/.612. He showed enough to earn a full-time outfield job when Belle left in free agency the following year. Despite posting a great .269/.396/.460 line, the Indians traded him to the Pirates for usable reliever Ricardo Rincon, straight up.

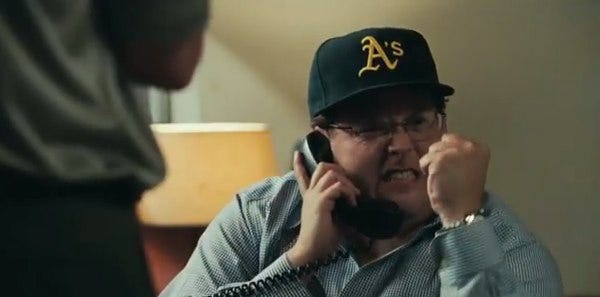
A few years later, the A’s would trade someone named Marshall McDougall to the Indians for Rincon. The Indians did not do well in Rincon trades. (Photo: Moneyball)

The Indians’ loss was the Pirates’ gain. Giles went on to post five straight seasons with an on-base percentage of .400+ including a historic .298/.450/.622 in 2002.

The extent to which Brian was unappreciated despite such elite production is best elucidated by the fact that he only made two All-Star games in his entire career, despite eight consecutive seasons of 4+ WAR, and a shiny career line of .291/.400/.502.

Brian posted double-digit walk rates every year he played, and the only year he struck out more than he walked (his 14th season) was the year he called it quits. For perspective, only five players had more walks than strikeouts in 2017: Votto, Turner, Trout, Rendon, and Rizzo — an impressive list, for sure; none of those players accomplished that feat the previous year. Among his contemporaries, the only other players to post double-digit walk rates with fewer strikeouts than walks with a .500+ slugging percentage in consecutive seasons were: Bonds, Sheffield, Pujols, Chipper, Giambi, Helton, PalmeiroThomas. I thought about excluding first basemen from the list, but this helps make the point of just how great Brian was, and for a long period of time.

As mentioned above, younger brother Marcus did not enjoy the long career Brian did, but was extremely valuable in his own right. While Brian was unheralded as a youngster, Marcus was mostly disregarded; Marcus was drafted way down in the 53rd round in 1996. He cracked the big leagues for the first time in 2001 at age 22, and put up a terrific .262/.338/.430 in about half a season of work, and he posted similar numbers in 2002. Even if that were the whole story, that’s still a remarkable achievement for a 53rd round draft pick — but of course, there’s more. For his stretch from 2003–2005,Marcus was by far the best second baseman in the game. In fact, among all middle infielders, only the nearly immortal Alex Rodriguez rated higher than the diminutive Giles during that span (that includes guys like Tejada, Jeter,Rollins, and teammate Furcal).

From 2003–2005, Marcus Giles was basically a better defensive version of Derek Jeter (Source: Fangraphs)

This is not to say that Marcus had a better career than any of the aforementioned stars, as this dramatically understates the significance of longevity (these were actually Marcus’ only three noteworthy seasons). But as far as 53rd round picks go, a run of three elite years like this is pretty wild. This puts the Giles family rightfully in discussion of top 5 baseball families.

Across three full seasons, the Giles brothers were among the top players in all of baseball (Source: Fangraphs)

Of these five-honorable mention families (Gwynns, Uptons, Fielders, Cruzes, Gileses) who would you take? Vote here.

The ultimate question:

Who do you think is the best non-Bonds baseball family? Go here to take the poll.


Jim Thome: First and Last Three Outcomes Hall of Famer

Jim Thome was elected to the Hall of Fame on January 24th.  Given my recent obsession with the three true outcomes, I immediately recognized the significance of this event.  I believe Jim Thome is the first, and likely the last three true outcomes Hall of Famer.

Table 1 shows Thome’s home run, walk, and strikeout rates along with his three true outcomes rate for each season.  The final column is the MLB average three true outcomes rate for the season.  Thome was a three true outcomes machine from 1996 until his retirement in 2012.

Table 1. Jim Thome, Three Outcomes Hall of Famer

Season Team PA HR/PA BB/PA SO/PA TTO Avg TTO
1991 Indians 104 1% 5% 15% 21% 26%
1992 Indians 131 2% 8% 26% 35% 25%
1993 Indians 192 4% 15% 19% 38% 26%
1994 Indians 369 5% 12% 23% 41% 27%
1995 Indians 557 4% 17% 20% 42% 28%
1996 Indians 636 6% 19% 22% 47% 28%
1997 Indians 627 6% 19% 23% 49% 28%
1998 Indians 537 6% 17% 26% 48% 28%
1999 Indians 629 5% 20% 27% 53% 28%
2000 Indians 684 5% 17% 25% 48% 29%
2001 Indians 644 8% 17% 29% 54% 28%
2002 Indians 613 8% 20% 23% 51% 28%
2003 Phillies 698 7% 16% 26% 49% 28%
2004 Phillies 618 7% 17% 23% 47% 28%
2005 Phillies 242 3% 19% 24% 46% 27%
2006 White Sox 610 7% 18% 24% 49% 28%
2007 White Sox 536 7% 18% 25% 49% 28%
2008 White Sox 602 6% 15% 24% 45% 28%
2009 2 teams 434 5% 16% 28% 50% 29%
2010 Twins 340 7% 18% 24% 49% 29%
2011 2 teams 324 5% 14% 28% 47% 29%
2012 2 teams 186 4% 12% 33% 49% 30%

Thome was part of a small group of specialists with multiple dominant three true outcomes seasons.  Table 2 provides a list of players with 4 or more of these dominant seasons.  I consider a season with at least 170 plate appearances and a 49% three true outcome rate as a dominant season.  The casual three true outcomes observer will recognize the players on this list as notable specialists.  Rob Deer, of course, is the iconic three true outcomes hitter.  I used Deer’s career three true outcomes rate of 49% and 4 dominant season to construct the table.

Table 2. Dominant Three True Outcomes Specialists

Player Career Seasons
Jim Thome 1991-2012 10
Adam Dunn 2001-2014 9
Russell Branyan 1998-2011 8
Mark McGwire 1986-2001 6
Jack Cust 2001-2011 5
Chris Carter 2010-2017 5
Rob Deer 1984-1996 4
Chris Davis 2008-2017 4
Alex Avila 2009-2017 4

Thome’s 10 dominant seasons are more than any other player.  He is also the only Hall of Famer on the list.

Maybe Mark McGwire should be in the Hall of Fame (depending on your PED era position).  Already past eligibility to be inducted by the Baseball Writers Association of America (BBWAA), perhaps he will have a chance in the future with the Veterans Committee.

Adam Dunn will be on the 2020 ballot.  He was a consistent three true outcomes specialist, but we will see if the BBWAA consider him a dominant player over the course of his career.

Russel Branyan and Jack Cust are interesting players to see on this list.  Branyan makes the list because of my 170 plate appearance requirement.  Cust was a dominant three true outcomes hitter for five straight years, 2007-2011.  Neither are on the Hall of Fame ballot.

Carter and Avila do not have contracts for 2018, but could land somewhere.  Davis is signed with Baltimore through 2022.  Joey Gallo and Aaron Judge are two young hitters in the three true outcomes mold not yet on the list.  So maybe it is too soon to make a judgement on the Hall of Fame potential of three true outcomes hitters in the future?

But I am going out on a limb to say that despite the trend towards three true outcomes baseball, we have seen our first and last three true outcomes Hall of Famer in Jim Thome.


The Modern Eras Committee Just Elected Bartolo Colon to the Hall of Fame

Jack Morris pitched 18 seasons while Bartolo Colon has now pitched 20. They both have a career winning percentage of .577. Morris has 2478 career strikeouts while Colon has 2454. Morris had 254 wins while Colon has 240 in an era where they are harder to obtain. Colon won a Cy Young while Morris’s highest finish was third. Morris has an ERA+ of 105, compared to Colon’s career ERA+ of 107. In fact, if you only looked at their first 15 years, Colon’s ERA+ of 114 outperforms Morris’s ERA+ of 109 even more!

Perhaps you strongly believe that, despite their statistical similarities, Jack Morris was significantly better than Bartolo Colon. Still, the fact that an argument could be made that Colon is as good a pitcher as Morris shows just how big a mistake the Modern Eras Committee made in electing Jack Morris to the Baseball Hall of Fame this weekend.

The list of players who were once viewed as “obviously not Hall of Famers” does not stop at Colon, either. In his article on ESPN.com, David Schoenfield said that it would be foolish to treat Morris as a benchmark for Hall of Fame induction. This argument is in defense of the Hall of Fame’s level of “rigor” — many think that without maintaining a certain level, the Hall of Fame may lose it’s significance. However, I believe there is another characteristic that the Hall of Fame must preserve even more so than rigor in order to maintain its credibility — and that is justice. If the Hall of Fame exposes itself as being discretionary in its election of members, it will quickly lose its relevance.

By electing Jack Morris to the Baseball Hall of Fame, voters both lowered the level of rigor previously required for election and have left the Hall of Fame in a current state of injustice until the following eligible players are also elected: Curt Schilling, Mike Mussina, Andy Pettitte, Dave Stieb, Rick Reuschel, Orel Hershiser, David Cone, Sam McDowell, Luis Tiant, Kevin Brown, Vida Blue, Bret Saberhagen, and Kevin Appier,

And the following cases are re-opened for election: Dwight Gooden, David Wells, Jim Kaat, Tommy John, Wilbur Wood, Ron Guidry, Jimmy Key, Frank Tanana, Dennis Martinez, Mark Langston, Chuck Finley, Mark Buehrle, Frank Viola and Jose Rijo.

Every single one of these 30 pitchers had a higher career ERA+ than Jack Morris and have either a higher career value, a higher peak value, or both.

Looks like Colon may be able to hang up his cleats a little more confidently this off-season now that Morris is in the Hall.


The 2018 Hall of Fame Pity Vote Candidates

Oh look people, it’s Hall of Fame season, which means it’s time for tired articles about Pete Rose and Barry Bonds, impassioned pleas for Mike Mussina and Larry Walker, glowing remembrances of Jim Thome and Chipper Jones, and the hottest takes about Curt Schilling’s Twitter account. But there is one annual piece that dares to break the trope and remember the lesser players on the ballot and decide who among them is worthy of receiving a single vote for the Hall of Fame. No rehashing Trevor Hoffman vs. Billy Wagner here, just looking at the best candidates to receive a pity vote. In previous years I have endorsed Jason Kendall, Edgar Renteria, and Mike Cameron as players worthy of a pity vote. Let’s see who meets the mark this year.

First we need to eliminate reasonable candidates. My standard has been likelihood of receiving three or more votes. Now this isn’t a perfect standard — I don’t think anyone would consider Mike Sweeney or Magglio Ordonez real candidates, but they have both gotten three votes in recent years — but it’s a good estimate of where the line between guys getting pity votes and guys who might be getting real votes lies. Of this year’s candidates, there are a number we can easily eliminate. Chipper Jones will likely get 95% or higher, and Jim Thome seems likely to get over the 75% mark this year as well. Omar Vizquel will more than likely at least hit double digits in percent, even if he was probably a worse player than Mike Cameron, who got completely shut out last year. It’s a little harder to gauge Scott Rolen, Johan Santana, and Andruw Jones. Their cases require some level of nuance, so there’s a wide range where they could end up. I’d say all three certainly deserve to stick around for at least a second ballot (personally, I’d vote for Rolen with no hesitation), and I feel pretty confidently they’ll each manage to reach double digits in total vote count.

The difficult choices for me are Johnny Damon and Jamie Moyer. Neither will stick on this ballot because neither has much of a case at all. But they might have enough of one to net more than two votes. Johnny Damon had a reputation as a great player, and he played in a lot of playoff series for high-profile teams and stuck around long enough to get some gaudy counting stats. There was even some brief talk about him possibly pushing to 3,000 hits. There hasn’t been a candidate with a super similar profile in a few years, but going back to 2014, we had Moises Alou receive six votes and Luis Gonzalez garner five. Now, I think both those players were better than Damon, but I think he’s perceived to be about the same level. While there’s a chance he doesn’t get more than two votes, he could definitely push into the 5-6 range. So I’m going to group him in with the non-pity vote guys. That being said, there’s a solid chance he only gets one or two votes.

Even more difficult to judge is Jaime Moyer. There haven’t been many pitchers hitting the ballot who had long, nice careers that weren’t real Hall of Fame candidates to compare to him. Moyer was better than Kenny Rogers, who got one vote in 2014, but he was definitely worse than David Wells, who managed five a year earlier. My made-up estimate is that Moyer will receive ~2.1 votes on average, so I’ll lean on the side of caution and not consider him for the honor of a pity vote.

Finally, let’s pour one out for Ben Sheets, who is, by a not insignificant margin, the best eligible player not to appear on this ballot. While he’s not quite the omission that Javier Vazquez was last year, Sheets was quite a good pitcher. He pitched like a Hall of Famer for one season (2004) and started the All-Star Game in another (2008). He has more WAR as a Brewer than any other pitcher, and ranks fourth overall in franchise history.


Carlos Zambrano (30.6 WAR) finished fifth in the Cy Young voting three separate times and was a fringe top-10 pitcher for three or four years, although he did walk a lot of dudes. Along with Mike Hampton and Dontrelle Willis, he was one of the good-hitting pitchers of his era. While his wRC+ was a pretty mediocre 57, his 24 career home runs (in 774 PA) are impressive for a pitcher. From 2001-2012, the length of his career, Zambrano hit 50% more home runs than any other pitcher. Yovani Gallardo and the aforementioned Mike Hampton are the only other guys in double digits. Zambrano was also known for wearing his heart on his sleeve, which just serves to make him a bit more memorable. Overall, Zambrano was a pretty good player, and a reasonably interesting one as well, but his career was rather short — he’s only 36. That being said, it’s not like an extra five years of quality pitching would turn him into a Hall of Fame candidate, or even a Jaime Moyer-level candidate.

Chris Carpenter (39.1 WAR) won a Cy Young award in 2005 and finished in the top three in the voting in 2006 and 2009. In between, he had two years lost to injury, which was a recurring theme with Carpenter. For a guy who didn’t become an above-average pitcher until he was 29, and missed quite a bit of time for injury, he had himself a nice career. In fact, if he had been able to stay healthy, he likely would have avoided eligibility for a pity vote, but alas, he’s stuck competing with these guys.

You probably remember Livan Hernandez (34.5 WAR) pitching a boring game for or against your favorite team. I’m not sure how, but I’m pretty sure Livan Hernandez pitched every inning for both the Padres and the Pirates in their July 29-31 series in 2004. Yeah, Baseball-Reference might say that Josh Fogg and Kip Wells and the other Adam Eaton and Brian Lawrence pitched those games, but those players all had the spirit of Livan Hernandez in them. In his career (1996-2012) Livan Hernandez officially pitched 3189 innings, which is 200 more innings than second place (Jaime Moyer!). Unofficially, I’m pretty sure he pitched about 55,000 innings and counting.

I mostly remember Carlos Lee (27.5 WAR) for signing a big contract with the Astros that just never seemed to end. Lee could rake with anyone, hitting both for power and for average, and he was generally pretty durable, but his poor defense kept him from being very valuable. There are two things in his favor as a pity vote candidate. For one thing, his top Similarity Score from B-R is Hall of Famer Orlando Cepeda. Yes, Cepeda is an iffier Hall of Famer, and yes, Andres “The Big Cat” Galarraga is third on that list, but that’s something. Carlos Lee also ranks seventh all-time in career grand slams. Well, he’s tied for seventh, with Jimmie Foxx and Ted Williams. Of the players ahead of him, three (Lou Gehrig, Eddie Murray, and Willie McCovey) are Hall of Famers, two (Alex Rodriguez and Manny Ramirez) would be if not for steroid drama, and one (Robin Ventura) is Robin Ventura. That’s some pretty good company, The Big Cat included.

Kevin Millwood (46.2 WAR) was almost certainly better than you remember him being. He ranks 22nd in WAR among starting pitchers since 1995, which places him immediately ahead of Johan Santana and Cole Hamels. Of course, Millwood first achieved success as the Braves’ fourth starter behind Greg Maddux, John Smoltz, and Tom Glavine, so it’s not hard to look bland compared to those guys. But Millwood garnered some legitimate accolades in his career. He threw a no-hitter, he led the AL in ERA in 2005 despite having a losing record, and he finished third in Cy Young voting in 1999. Even with that, I must say he had one of the more boring careers of a pitcher of his caliber.

Aubrey Huff (17.1 WAR), amazingly, is still one of the Rays’ franchise leaders in WAR among position players. He ranks tenth with a staggering 9.9 WAR, placing him among other Rays legends like Matt Joyce and Jason Bartlett. All joking aside, Huff was a fine, well-rounded hitter who couldn’t field a lick. Possibly the strangest aspect of his career, though, was his 2010 campaign for the Giants. He had a truly moribund season in 2009, and I mean it in the literal ‘about to die’ sense. But in 2010, at age 33, he decided to be good at everything baseball-related he possibly could be. His walk rate skyrocketed to 12.4%, well above his typical 8-9% range, and he hit 26 dingers, which is really like 47 when you account for the fact that he was hitting left-handed in AT&T Park. Even his defense, not traditionally one of Huff’s strong suits, was pretty solid, both at first base and in corner-outfield positions. Overall, he was good for 5.8 WAR and finished seventh in NL MVP voting. If this had been the start of some sort of late-career resurgence, Huff would have been an excellent pity vote candidate, but it turned out to just be a last gasp in a dead career, as he only survived for two more godawful seasons.

Orlando Hudson (21.1 WAR) was a solid all-around player — good defense, average offense. The type of guy who bats seventh on a pennant winner. He won four Gold Gloves and made a couple of All-Star games, but really, he wasn’t a particularly special player in any way. Cool guy, but really, a boring player.

It’s incredible to think that Kerry Wood (23.7 WAR) was in the majors as recently as 2012. I mean, he was basically broken by 2004, but still managed to limp along for nearly a decade. Well, I shouldn’t really say limp, because he did have a solid year in relief in 2008, but for the most part it was limping. To be honest, looking back on Wood’s career, it wasn’t exactly incredible in terms of value. While he did strike out anything that moved, he was also rather walk-prone — 4.34 per nine innings for his career. He never again matched his 4.4 WAR as a rookie and only crossed the 200 inning mark twice, and only one of those was during Dusty Baker’s tenure, so don’t blame him. Of course, I can’t continue without mentioning the 20 strikeout game, because, well, he struck out 20 guys in nine innings.

Brad Lidge (11.6 WAR), like Kerry Wood, struck out a lot of guys. In 2004, with the Astros, he struck out 42.6% of batters he faced. At the time, this was the third-most strike-out-iest season by a reliever ever, behind only Billy Wagner‘s 1999 season and Eric Gagne’s 2003 season. Now it’s been passed by some Craig Kimbrel and Aroldis Chapman nonsense, bu that shouldn’t diminish from Lidge’s dominance. Lidge was also fantastic with the Phillies in 2008. They won the pennant and he came in fourth in Cy Young voting and eighth in MVP voting. Of course, it wasn’t all sunshine and roses. Lidge gave up a whole lot of walks. And he was hilariously awful in 2009. I mean, pitcher wins and ERA are pretty blunt tools for a reliever, but they tell a story here — Lidge went 0-8 with 7.21 ERA. What’s particularly impressive is that he actually sustained that ERA for months. Despite consistent usage, he never dropped below a 6.75 ERA for a day after April. Still got those 31 saves though.

I’m not actually going to do all the legwork, but I can say with some degree of certainty that Jason Isringhausen (11.2 WAR) is the best player ever drafted and signed in the 44th round. He was a good closer for the Cardinals for a few years. Made a pair of All-Star Games. He’s in a three-way tie for 26th in all time saves, which doesn’t sound that impressive. But one of those guys he’s tied with is Hall of Famer Bruce Sutter! And the other one is…Fernando Rodney.

Hideki Matsui (12.9 WAR) is probably the best non-Ichiro position player to come out of Japan. He won the MVP for the 2009 World Series, and he made a pair of All-Star Games, and he was remarkably durable, not missing a game for his first three years in MLB. That being said, Matsui’s bat was just good and not great, and his lack of quality glovework made him just a nice player. He only once reached 3 WAR in a season, which is less than even Orlando Hudson. Notable player, but not a particularly good one.


Now we come to the hard part. Who deserves a pity vote? Well, I can quickly eliminate Hudson, Huff, Matsui, Lidge, and Isringhausen. No offense to any of those guys. All were quality players. But if one of them were missing from the ballot and say…Adam Kennedy were in their place, I don’t think I would have gone through the effort to mention them as a snub. Sorry y’all. I think I’m going to eliminate Kerry Wood from consideration as well. While one particularly good game may be enough to get Jack Morris into the Hall of Fame, I don’t think it’s enough to earn a pity vote. And Carlos Lee, while a better player than any of the above group, isn’t exactly screaming out for further recognition.

That leaves us with four pitchers. Of them, I’d say Carpenter has the most impressive peak, Millwood has the most impressive full career, and Zambrano has the most impressive bat. But my choice has to be the one and only Livan Hernandez.

The way I see it, a pity vote is supposed to do one of two things. You should either shine a light on a good player, who is clearly not a Hall of Famer, but shouldn’t be forgotten. Or it should be to remember and acknowledge a guy who represented something to a generation of fans. Livan Hernandez definitely falls into the latter of these two. Livan Hernandez represents every Livan Hernandez-type pitcher who has ever done Livan Hernandez-type things. Joe Blanton. Carl PavanoJason VargasBronson Arroyo. Gil Meche. Freddy GarciaKevin Correa. Kyle Lohse. Brad PennyJason Marquis. Sidney PonsonAaron Harang. Jeremy Guthrie. Ian Kennedy. Jon GarlandMatt MorrisErvin Santana. Jeff Suppan. Mike Leake. Randy Wolf. Jake Westbrook. Livan HernandezLivan Hernandez.


In Defense of Secret Hall of Fame Ballots

As a baseball nerd, I enjoy reading Ryan Thibodaux’s (Thibodaux’?) yearly tally of Baseball Hall of Fame ballots. I participate in the yearly gnashing of teeth at Murray Chass’s intentionally blank Hall of Fame ballot.

But one thing I’m not behind is the push for mandatory public Hall of Fame ballots. (The Hall rejected the BBWAA’s vote to make every ballot public.) Secrecy in balloting among private citizens is a value worth defending, even if the votes themselves are based on malice or stupidity.

A brief history:

The English tradition was to vote with one’s voice, as evidenced by Virginia’s early voting methods:

As each freeholder came before the sheriff, his name was called out in a loud voice, and the sheriff inquired how he would vote. The freeholder replied by giving the name of his preference. The appropriate clerk then wrote down the voter’s name, the sheriff announced it as enrolled, and often the candidate for whom he had voted arose, bowed, and publicly thanked him.

Even as ballots shifted to paper ballots, the votes themselves were publicly displayed, often counted in plain sight of the public. But as should be unsurprising, the public ballot meant that public pressure could be exerted on any person’s vote. Bribes and threats were frequent.

Eventually ballots were printed by local party bosses. The secret ballot soon began to gain steam as a potential innovation in England and Australia. In England, intimidation was pervasive:

He referred the intimidation exercised by landlords on tenants . . . , by employers on the employed, by customers on shopkeeper. . . .  He had known half a congregation leave their parson and set up another place of worship on account of his vote, thus depriving him of a considerable part of his income.

(Boycott by Hall of Fame ballot would admittedly be fun.) Brazen vote purchasing was common in American politics, with the 1880s producing multiple tainted national elections.

By the 1950s, the secrecy of the ballot was a core American value, as seen in Twelve Angry Men:

JUROR SEVEN: Who was it? I think we have a right to know.

JUROR ELEVEN: Excuse me. This was a secret ballot. We agreed on this point, no? If the gentleman wants it to remain secret…

JUROR THREE: What do you mean? There are no secrets in here! . . .

. . . .

JUROR ELEVEN [omitted in film version]: Please. I would like to say something here. I have always thought that a man was entitled to have unpopular opinions in this country. This is the reason I came here. I wanted to have the right to disagree. In my own country, I am ashamed to say that.

Why have a secret ballot? The primary goal is that a voter is protected from public pressures. As a party boss, I wouldn’t know if you voted for my candidate or another one, so threats and bribes have no guarantee of success. And as a sports fan, I wouldn’t know if you voted for Roger Clemens or not, regardless of what your public posturing on steroids may have been.

(There were plenty of reasons why the printed secret ballot had negative consequences on turnout, namely imposing a quasi-requirement of literacy, but the secrecy of the ballot was not the problem there.)

So where does this leave us with the Hall of Fame ballot? Do these reasons of secrecy apply to the BBWAA? I don’t think we have to worry about vote buying (Deadspin notwithstanding), but I guess my position relates to first principles of the Hall of Fame ballot. With this vote, we want an honest accounting of whether a supermajority of voters believes said player belongs in the Hall. We may have problems with the percentage necessary, or the number of votes on the ballot or the composition of the electorate itself, but the purpose of the Hall is to see who the electorate believes is a Hall of Famer in their hearts, not in the face of public scrutiny. Unless we just want to have a JAWS cut-off and eliminate the electorate entirely, there must be something ineffable about the Hall of Fame, something that comes from a private evaluation of one’s emotions. The sportswriters are not elected by us, nor are they supposed to be “accountable to the public.”

There are of course strong arguments against anonymity in voting. Yoav Fromer argues that the secret ballot allows people the luxury of voting for positions that are publicly unpalatable. Without needing to defend their choices, voters can simply hide behind the secret ballot and avoid public accountability. Similarly, John Stuart Mill worried that in private people would be more prone to bias or dishonesty: “People will give dishonest or mean votes from lucre, from malice, from pique, from personal rivalry, even from the interests or prejudices of class or sect, more readily in secret than in public.”

But part of the reason the Hall is built around these secret ballots is the belief that we do want the raw honest truth from the voters. We don’t want their public opinions; we want to know what they believe in their dark hearts. And if they really can’t quite stomach voting for a “steroid guy” or they think Jack Morris just feels like a Hall of Famer, we want those flawed, messy and private emotions packed into their vote.

Furthermore, it’s not clear that Fromer and Mill are correct in practice when it comes to the BBWAA ballot. As it turns out, many people are quite willing to hold unpopular public opinions, and the publicity of ballots has not made Murray Chass or Dan Shaughnessy behave like any less of a dolt. In 2017, only five ballots were anonymous anyways.

If people want to reveal their ballots, more power to them. And kudos to Thibodaux for asking for ballots and to those voters who disclose their reasons for voting. These efforts undoubtedly add to our public discourse on what the Hall is and means.

I understand that I’m probably standing against the tide of history on this one. But we should not be quite so quick to force the disclosure of private votes simply because they may be unpopular positions.


The Proverbial Sins of Our Hall-of-Fame-Voting Forefathers

We can go ahead and continue using the flawed voting of yesteryear as our benchmark for what constitutes a Hall of Famer, or we can say, “scrap that, our Hall-of-Fame-voting forefathers had it wrong and it’s our job to make it right!”

When I watch CC Sabathia and Justin Verlander dealing like aces more than a decade after they were first dubbed “aces,” I feel like I am watching careers that are deserving of Hall-of-Fame induction.

We are now 17 seasons removed from when CC went 17-5 and finished runner-up to Ichiro Suzuki in the 2001 AL Rookie of the Year voting. We are 12 seasons removed from when Justin Verlander went 17-9 with an ERA+ of 125 to win the 2006 AL Rookie of the Year award.  And if you surveyed any GM in those early years, they would be hard-pressed to prescribe better career arches than the ones these two guys have put together.

CC won the 2007 AL Cy Young Award, was the best pitcher in all of baseball in 2008, and was the staff ace of the World Series champion Yankees in 2009. He has 237 career wins, a .619 winning percentage, 2846 strikeouts and an ERA+ of 117, which is the same as Gaylord Perry and higher than Steve Carlton, Phil Niekro, Fergie Jenkins, Robin Roberts, and Nolan Ryan.

Justin Verlander won both the AL Cy Young and MVP award in 2011, has a .623 winning percentage and has led the league in strikeouts four times. He brought the Tigers out of the division basement and into perennial contention. In addition, his ERA+ of 124 puts him ahead of Juan Marichal, Bob Feller, Warren Spahn, and Don Drysdale. These are inner-circle Hall of Famers!

Both CC and Verlander have finished in the top five in Cy Young voting five times. They also rank 17th and 15th, respectively in all-time Win Probability Added (WPA). Yet, because other pitchers that combined dominance with longevity have been denied Hall of Fame induction, CC and Verlander’s odds, as they stand today, cannot be certain. I’m talking guys like Mike Mussina, Curt Schilling, Rick Reuschel, Luis Tiant, and Kevin Brown. Even Doc Gooden, Dave Stieb, Bret Saberhagen, Orel Hershiser and David Cone. Even though many of these pitchers’ careers occurred before my time, the company they keep with CC and Verlander in the Hall of Sabermetrics tells me enough about their Hall-of-Fame worthiness.

I wish that the Veterans Committee would have a watershed moment and fix the mistakes of our Hall-of-Fame-voting forefathers, but I am not going to hold my breath. Luckily for CC and Verlander, both are willing and able to add to their resumes. But the question is, how much more do they need to do?