Archive for December, 2017

On Drew Smyly, Michael Pineda, and the History of Signing Injured Free-Agent Pitchers

About 12 hours apart, news of two very similar moves broke out of Chicago and Minnesota, as the Cubs agreed to terms with Drew Smyly while the Twins signed Michael Pineda. Both pitchers inked two-year deals with $10-million guarantees and additional incentives based on innings pitched, but the two deals shared an even more important similarity: both pitchers underwent Tommy John surgery this summer and seem unlikely to contribute significantly during the 2017 campaign. Both clubs are clearly betting on a return to health and productivity in 2019 for the two still relatively young pitchers, as evidenced by the financial distribution of the contracts. Pineda is only owed $2 million for the upcoming season but will receive $8 million in 2019, while Smyly will be paid $3 million next year but will pull in $7 million the following year. Since both pitchers underwent surgery around the same time, during the middle of the summer, it seems unlikely that either will throw pitch in the coming season.

While uncommon, these types of deals certainly aren’t entirely unprecedented. The Kansas City Royals have inked three pitchers with similar situations over the past few years, with varying degrees of success. These contracts, given to Luke Hochevar and Kris Medlen in 2015 and Mike Minor the following season, seem to represent the most relevant examples of such a deal. While Minor was non-tendered by the Braves following repeated shoulder issues, both Medlen and Hochevar underwent Tommy John surgery the previous year. All three pitchers would appear for the Royals in the major leagues over the life of their deals, albeit with differing results. Hochevar would appear in 89 games for the Royals, and accumulate only marginal value, as he posted a FIP around 4.00 and tallied only 0.3 WAR combined before succumbing to thoracic outlet syndrome surgery. Kansas City declined their option over Hochevar last winter, who became a free agent and sat out 2017 recovering.

Medlen would also return to pitch in 2015, making eight starts and seven relief appearances for Kansas City. He saw an uptick in walks and a downturn in strikeouts compared to his previous work, but overall pitched his way to a 4.01 ERA with similar peripherals and rang up half a win of value. 2016, however, would not be so kind to Medlen, as he was shelled to the tune of a 7.77 ERA while walking more batters than he struck out and battling a shoulder injury. He would sign a minor-league deal with the Braves after the season, but would not return to the majors. Although he did not appear with the Royals in 2016 after struggling in AAA, Minor marks the largest success story of the three. Over 65 relief appearances, Minor registered a 2.62 FIP and was worth 2.1 WAR out of the bullpen. He recently signed a three-year contract with the Rangers to return to a starting role.

In total, the Royals invested $25.75 million in the three pitchers and saw them accumulate a grand total of 2.9 WAR, with most it coming from Minor. This works out to a $/WAR figure of $8.88 million per win, which is slightly higher than the $8 million per win value assumed of the free-agent market. Based on these three deals, it would appear that this type of signing is not a bargain, but rather an overpay on average. However, it isn’t fair to make such an assumption without looking at a larger sample of data. If we classify a similar deal as one in which a team signed a pitcher that was injured at the time of the signing and expected to miss at least part of the following season and either signed a major-league deal or a two-year minor-league pact, that leaves us with 18 similar signings since 2007. One of these signings, Nate Eovaldi, has yet to return from his injury but should in 2018, so we won’t include him in the sample.

These 17 signings correlate to 25 player seasons following injury, with 24 of those representing guaranteed contract years, as well as one option year (Joakim Soria, 2015). The breakdown of these player seasons by games, innings pitched, strikeouts, walks, earned runs, and WAR are presented in the table below:

G IP K BB ER WAR
Total 447 725.2 606 246 347 6.9
Mean 18 29 24 10 14 0.27
Median 7 20 15 6 10 0

Altogether, when on a big-league mound, the group pitched to a 4.30 ERA to go along with a 7.52 K/9 and a 3.05 BB/9, numbers not entirely dissimilar from, say, Dustin McGowan or Sal Romano in 2017. So even the healthy group put together fairly middling results, but it’s also important to remember that eight of these player seasons wouldn’t see the player throw a single big-league pitch, and therefore provided no value to the club. Let’s plot the distribution of value produced by WAR:

INJ FA Pit WAR

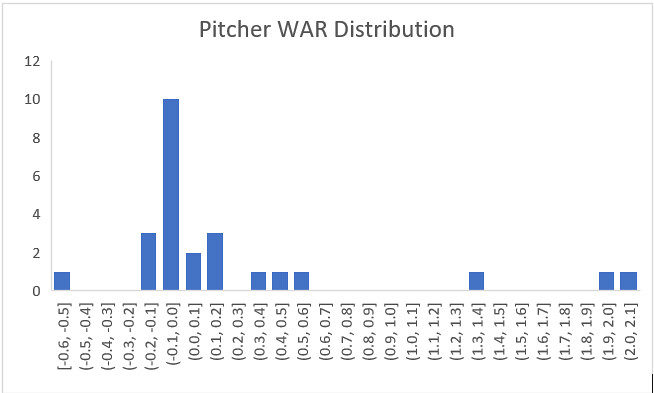
That 2.1 WAR recorded by Minor last season was the highest figure of any player season in the sample, and besides Mike Pelfrey’s 2013 season, no other player season really comes close. Of the 10 player seasons recorded by primarily starting pitchers, only Pelfrey’s season even came close to average production, as every other starter either wasn’t durable or good enough to rack up any significant value. On the relief side, Minor and 2014 Joakim Soria both excelled, but no other relief season (out of the 15 in the sample) even crossed the 0.5 win threshold. As with the Royals pitchers earlier, it is important to look at these deals from a value standpoint. We can do this by calculating $ per WAR for the whole sample to find a mean, and for each deal to find a median, and visually represent the distribution. Overall, teams invested a total of $78 million in these 25 player seasons, with $71 coming in guaranteed money and $7 million in Joakim Soria’s club option. All minor-league deals to MLB veterans were assigned a dollar value of $333,333 for ease of calculation. Bonuses and incentives were ignored from this figure, as it is very difficult to find these details of the player contracts and few of these seasons would reach such incentives. As we saw above, the sample produced a total WAR of 6.9. This means that on average, teams paid $11.3 million per win when committing money to injured pitchers in hopes of a bounceback, well above the market rate of $8 million per win in free agency. Based on some quick calculations, teams paid that $78 million for production worth $55.2 million, for a net loss of $22.8 million. Let’s now look at the value gained/lost for each contract (in millions of $):

INJ FA Pit Val

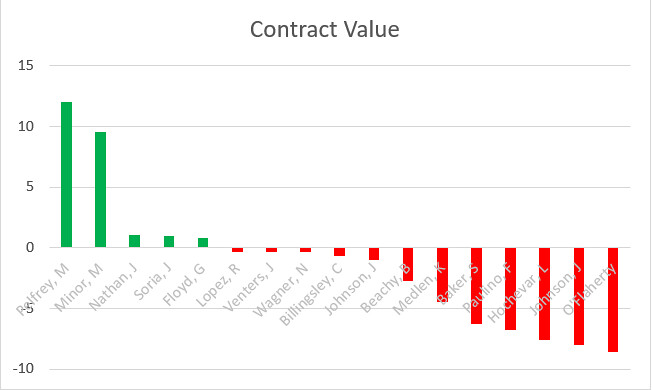
As you can see, only five such contracts actually generated positive (above market value of $8 million per win), while the remaining 12 contracts provided their team with below-market value. The mean loss per contract is $1.34 million, while the median is represented by the Phillies’ $700k loss on Chad Billingsley. While neither number is outrageously high, both figures only serve to reinforce the fact that teams have generally lost more often than they have benefited from inking an injured pitcher.

None of this is necessarily to say that the Pineda, Smyly, and Eovaldi contracts are doomed or that no team should ever make this type of investment, but simply to look at how similar deals have worked out in the past. Admittedly, the sample is hardly big enough to make any sort of definitive conclusion, but the overall trend on these “bargain” signings isn’t pretty. Both Smyly and Pineda are better pitchers than most in the sample, so it is entirely possible that they (along with Eovaldi) could significantly shift the outlook on these types of deals in the future. Whether this trio of pitchers can buck the trend or will follow in the footsteps of their predecessors will certainly be an interesting, if minor (pun intended) storyline to watch over the next few seasons.

FanGraphs.com leaderboards, Baseball-Reference transaction data, and MLBReports Tommy John surgery database were all used extensively for this research.


Are We Overvaluing Power Hitters?

Aaron Judge and Jose Altuve were seemingly neck and neck in MVP voting this year (even if they are neck and belly button when standing next to each other). Judge had the edge in FanGraphs WAR, while Altuve held an edge according to Baseball Reference. Altuve had gaudy batting average and stolen-base totals, while Judge reached the coveted 50-home-run plateau to go along with his jaw-dropping Statcast numbers. Heading into awards season, the American League MVP was hyped as a two-man race that could go either way.

But, then the voting happened, and Jose Altuve got 27 first-place votes to Aaron Judge’s two. There were a lot of reasons for this from storyline, to traditional numbers, to team record. One of the most prominent among them for sabermetric voters was Aaron Judge’s clutch performance. According to the Clutch metric found on this site, he was the least clutch player in baseball this year. Actually, he was the least clutch player in baseball this entire millennium. Wait no, actually, he had the single least clutch season in the history of the metric (since 1972).

Up until now, Clutch has not been shown to have predictive value, even if it is important in deciding things like MVP races which are based on things that have already happened. But, as you may have guessed from the article title, I think there may be evidence to suggest otherwise. Here a list of the least clutch players in history for their entire career according to the clutch metric.

Rank Name Games HR BB% K% Clutch WAR
1 Sammy Sosa 2354 609 9.4 % 23.3 % -14.67 60.1
2 Mike Schmidt 2404 548 15.0 % 18.7 % -13.45 106.5
3 Lance Parrish 1988 324 7.8 % 19.6 % -12.90 43.4
4 Jim Thome 2543 612 16.9 % 24.7 % -11.66 69.0
5 Chet Lemon 1988 215 9.5 % 13.0 % -11.03 52.0
6 Jermaine Dye 1763 325 8.3 % 18.1 % -9.67 14.5
7 Alex Rodriguez 2784 696 11.0 % 18.7 % -9.53 112.9
8 Andre Dawson 2627 438 5.5 % 14.0 % -9.49 59.5
9 Gary Carter 2295 324 9.4 % 11.1 % -9.25 69.4
10 Barry Bonds 2986 762 20.3 % 12.2 % -9.13 164.4

This list is populated by a certain type of player: good ones. The difference in WAR between Jermaine Dye and Lance Parrish in 9th place would be a fantastic career for almost anyone. But, more importantly, it is populated by high-strikeout, power-hitting sluggers. Every single player on this list has a double-digit strikeout rate and everyone but Chet Lemon has at least 300 career home runs. The list of the most clutch players in history, on the other hand, is not made up of power hitters.

Rank Name Games HR BB% K% Clutch WAR
1 Tony Gwynn 2440 135 7.7 % 4.2 % 9.49 65.0
2 Pete Rose 2179 57 10.6 % 5.8 % 9.07 43.5
3 Scott Fletcher 1612 34 8.6 % 9.1 % 8.61 24.9
4 Mark McLemore 1832 53 12.1 % 13.6 % 8.51 17.4
5 Ichiro Suzuki 2636 117 6.0 % 10.0 % 8.25 58.2
6 Dave Parker 2466 339 6.7 % 15.1 % 7.64 41.1
7 Omar Vizquel 2968 80 8.6 % 9.0 % 7.54 42.6
8 Ozzie Guillen 1993 28 3.4 % 7.2 % 7.48 13.1
9 Lance Johnson 1447 34 6.1 % 6.6 % 6.89 26.4
10 Jose Lind 1044 9 5.4 % 9.2 % 6.71 3.3
11 Mark Grace 2245 173 11.6 % 6.9 % 6,.58 45.5


This list is made up of a very different kind of hitter. Tony Gwynn, Pete Rose and Ichiro are perhaps the three most well-known contact hitters of all time. Only three players on this list have double-digit strikeout rates, and only one has 300 career home runs. Chet Lemon, dead last in home runs on the other list, would rank second on this one.

Aaron Judge fits right into the pattern of these lists, as one of four qualified players with a 30% strikeout rate or higher. If you sum the clutch score of the top 10 players in strikeout rate this year, you get -9.05, or nearly one win per player lost due to clutch performance. If you remove Aaron Judge, the sum is a still gaudy total of -5.41.

I charted Strikeout rate against clutch score for all players qualified in 2017, and there is a small but definite trend. Below the chart, you can see the regression equation along with the P value for the coefficient and the R^2.

Ultimately I don’t have the tools or the time to fully explore this idea, but it would appear that there is an actual relationship here. The effect may be minuscule as the R^2 indicates, but the general trend seems to indicate that clutch players are more contact-oriented. This makes sense, because the most clutch situations in a game happen with men in scoring position, where the difference between a strikeout and a fly out or ground out can be an entire run. Further work needs to be done, but I would not be surprised to find that batted-ball type or walk rate also has an impact. For example, hitters with higher fly-ball rates may be more clutch because, with runners on base, a fly ball avoids a double play with a man on first, and may drive in a run with a man on third. With nobody on base and nobody out, the way a batter gets out does not make a difference. But in clutch situations, all outs are not created equal.


Starter or Reliever: The Josh Hader Story

I’ve always wondered if certain players are aware of the comparisons floated with their names.

For one, it could be valuable to observe and learn from a player with similar mechanics. Struggle can be an unexpected teacher, and if their look-alike possesses a career with peaks and valleys, those turning points make invaluable late-night research material for a baseball nut. On the other hand, comparing can create unrealistic expectations.

Because I have not had the pleasure of speaking to Brewers pitcher Josh Hader, knowing whether he sees value in comparisons eludes me. What I do know is the most frequent comparison attached to Hader immediately creates those lofty expectations: Chris Sale.

Not as lanky, or elite, Hader’s sidearm-lefty slot causes Sale-like deception.

David Laurila of FanGraphs spoke with Hader about mechanics, and a few points resonated with me.

Hader is cognizant of the value biomechanical analysis can have, disclosing his run-in with motion-capture cotton balls affixing themselves to his body as he pops a glove with 95-mph heat. His max-effort delivery may cause worry for some, but reading about Hader’s confidence in his concoction of a motion is settling, even if it’s coming from the horse’s mouth. If you subscribe to the theory that past injury predicts future injury, Hader eclipsing 100 innings every year since 2013 should ease your concerns. (Thanks to Laurila for getting Hader’s thoughts in the column linked above.)

Hader also confirmed his awareness of the deception he creates when talking with Laurila. The less time a hitter has to pick up the ball out of his hand, the better. Left-handed hitters, in particular, have been decimated by Hader’s fastball-slider combo.

Lefties combined for a .158 slugging percentage against Hader last season. That was second in baseball, behind Pittsburgh Pirates closer Felipe Rivero (minimum 70+ total batters faced). Firmly inside the 99th percentile; when you drill down to how effective Hader’s slider was, I fear for any lefty who had to deal with this release point and horizontal bite (see gif above). Hader threw his slider 77 times last year to left-handed hitters and the resulting slugging percentage was .071. When they swung at this slider, 44% of the time they missed. Both metrics sit comfortably above average in relation to average slugging percentages and whiff rates for hitters, adding statistical backing to Hader’s dominance.

Unique about Hader is not only this slider, his hair, and his effectiveness, but his role heading into the offseason.

Since his move to Milwaukee from the Houston Astros in 2015’s Carlos Gomez swap, Hader was a starting pitcher for every one of his minor-league appearances. Craig Counsell & Co. entertained the reliever role for Hader only upon his promotion to the major leagues on June 10. Culprits for the switch could be situational — the Brewers were contending, and needed bullpen arms — but you could also convince me they were performance-based. A 13.6% walk rate over 52 Triple-A innings doesn’t inspire confidence.

This isn’t breaking news to Brewers fans.

Control issues have always been a problem for Hader, but as a reliever, the Wayne’s World look-alike had a good enough fastball to utilize it 75 percent of the time to lefties, upwards of 85 percent to righties, and net himself a shiny 36 percent strikeout rate (47 2/3 innings). In the process, Hader cut his walk rate to 11.7 percent in the majors, from north of 13 percent at Triple-A.

Unfortunately for Hader, even that improvement shouldn’t inspire confidence. We haven’t had a qualified pitcher at the major-league level, with a walk rate greater than 11.6%, since Francisco Liriano in 2014. I wouldn’t fault Hader for making a deal with the devil and taking Liriano’s 1,500-inning career, but my intentions are to consider a pitch vital to determining Hader’s 2018 role.

***

Considering everything” headlines an MLB.com column from Brewers beat writer Adam McCalvy just over a week ago.

The vocalist of that quote was Craig Counsell, and the topic was our very own Josh Hader.

Indifference exists because Hader pitched so well in his 35 relief appearances and because of the smattering of question marks. The biggest of which is emerging ace Jimmy Nelson’s shoulder health. One depth chart has Hader as Corey Knebel’s set-up man. With an individual named “B. Suter” in the Brewers 2018 rotation. (Not “Bruce” Suter, just to confirm. Sorry, Brent.)

One question mark Hader can control is the development of his changeup. Stop me if you’ve heard this before, but a developed third pitch — so often the changeup — is how many minor-league arms get a chance to work for five-plus innings in the upper levels.

One of my favorite finds from 2017 has been the scout Chris Kusiolek (@CaliKusiolek on Twitter). In regards to changeups, Kusiolek mentioned on the Fantrax Baseball Show how much of a feel pitch it truly is. He detailed how he looks not at the present state of a pitcher’s changeup when determining the viability of the pitch’s future, but the athleticism of the pitcher, his arm action, fastball, and other aesthetics, to make that call. I’m nowhere near as seasoned of a scout as Kusiolek, but Hader hits a few of those points.

Even Hader will admit changeups are a feel pitch, and found in that same McCalvy column, the Brewers beat writer tweeted out the grip Hader was working on back in March of 2017.

“Messed up” can often prime one to think inconsistent, but that may apply to the resulting action Hader achieved on the pitch, rather than the results.

FanGraphs has Hader’s changeup just below 86 mph. This average velocity was the more common action on the pitch I observed watching tape of Hader. Other times, however, I’ve seen Hader’s change kick up to 88 mph. From my crude observation, the harder changeup only came spontaneously and later in counts. You’re about to see an 88-mph changeup on a two-strike pitch to Adam Duvall.

Harry Pavlidis has conducted extensive research on why some changeups are effective, noting those who generate elevated levels of ground balls and swinging strikes with the pitch are ideal (Stephen Strasburg is the poster-child).

Hader’s changeup hits one of those two criteria. Among starters and relievers with 50 or more changeups thrown, when Hader’s is put in play, it generates grounders at a 75-percent clip, sixth-highest in all of baseball (320 total starters and relievers). I understand it’s a pipe dream to ask Hader to replicate the arm action or grip that leads to the harder offering — if it is spontaneous — but if the structure of his general changeup leads to an elevated level of ground balls, this harder changeup might push him further into worm-killer territory.

Given Hader’s changeup has a sub-par whiff-per-swing rate in the bottom quarter of the league, playing to his strengths and embracing the harder version could make an interesting case for change.

You could argue Hader needs to continue mixing the two, but if the hittable, 86-mph changeup is thrown more as an early-count offering to righties, exploiting Hader’s attempt to pitch backwards could become an game plan. Or, in a perfect world, Hader can refine the swinging-strike rate on the slightly softer offering and turn into a two-changeup lefty. (A boy can dream, right?)

***

Considering Hader for a rotation spot is not a spontaneous decision, especially with Hader’s talent and polished, 23-year-old arm.

Both of his raw pitch count season-highs throwing his changeup came in consecutive appearances during late September. His usage with the pitch crept towards 19 percent, and both outings lasted north of two innings.

Hader can survive as a starting pitcher if his changeup becomes a legitimate weapon to right-handed hitters, especially if opposing managers understand Hader’s dominance against lefties and stack against his natural platoon split.

While Hader’s changeup is often knocked for being inconsistent, I counter that sentiment by saying he has a substantially better feel for the pitch than most, especially given the tendency of hitters to pound it into the ground, regardless of the velocity.

My gut tells me Hader will be utilized as a multi-inning reliever, and dominate both sides of the plate in 2018. My heart tells me to give Hader starts to further refine his feel for a pitch he’ll have to use effectively the second and third time through major-league lineups in order to survive.

In Craig Counsell and Derek Johnson I trust.

A version of this post can be found on my website, BigThreeSports.com

Statistics all from BrooksBaseball, BaseballSavant, Baseball Prospectus, and FanGraphs, unless otherwise noted.


Ichiro Shot the Moon

Ichiro is one of the most bizarre players of the past 20 seasons. While many hitters have come over from Japan to the MLB, Ichiro has stuck in North America like no one else. The NPB is famous for its ground-ball-heavy approach — per DeltaGraphs, the NPB ran a GB% of 48% compared to 44% for the MLB last season — but that approach usually doesn’t work that well across the pond. That wasn’t the case for Ichiro. He made it work, and he made it work all the way to capturing the single-season hit record. And he did it in a really, really weird way.

How to Hit In Japan

To explain why it was so weird that Ichiro did what he did, we have to go all the way back to the beginning, back to Ichiro’s home country of Japan. Nippon Pro Baseball is the highest level of professional competition in Japan, and it’s where MLB superstars (and future superstars) like Ichiro, Shohei Ohtani, and Hideki Matsui started their careers.

The NPB is traditionally referred to as a ‘AAAA league’ — its level of competition is below that of the MLB, but above that of typical AAA team, which is why players who could mash in AAA but couldn’t hang on in the majors usually end up in the land of the rising sun (guys like Álex Guerrero and Casey McGehee were among the best hitters in the NPB in 2017).

The NPB’s style of baseball, however, is unique. It exists as some strange mesh of dead-ball play and modern baseball, where ground ball machines can thrive.

Earlier this year, Ben Lindbergh took a look at the biggest ground-ball-machine in the world, Nippon-Ham Fighter Takuya Nakashima, who ran an astonishing 74.4% GB% in 2016. Nakashima’s batted-ball profile looks like something of a caricature of the rest of the league, a gross exaggeration of the way the rest of the league plays.

NPB vs. MLB GB%

League-wide, the NPB GB% year to year falls between 47% and 48%, which is quite a bit more than the 44%-45% that the MLB posts every season. Japanese players also traditionally reach base more frequently on grounders too, posting a BABIP of .245 on ground balls in 2017 compared to the MLB’s .241 figure.

NPB vs. MLB wRC+ on GB

But the biggest difference between MLB and NPB grounders? Ground balls are generally worth 30% more in Japan as they are in North America. MLB batters posted a 29 wRC+ on grounders, but NPB grounders were worth 42 wRC+. That’s a huge difference, especially for a league-wide figure. While it’s still not technically beneficial to hit ground balls, in Japan, hitters are rewarded for doing so more frequently than their North American counterparts.

How does such a huge difference exist between NPB and the MLB? Lindbergh, in the above article, suggests that the spongy Japanese turf is to blame, causing ground balls to have more life on them. In addition, Lindbergh suggests that the NPB, which has been slow to adopt many sabermetric and modern ideas, is shift averse, meaning many pull-happy hitters can run higher BABIPs. It’s also possible that since NPB has a lower skill level than the MLB, NPB infield defense could allow more hits than MLB infields.

Whatever the reason, hitters who came to the MLB from the NPB while relying on the ground ball as a means of production generally saw their production suffer. Tsuyoshi Nishioka, for example, hit .346/.423/.482 the season before coming to the MLB, but managed only a paltry .215/.267/.236 with the Twins in two seasons. Nishioka relied heavily upon the ground ball in both leagues but was punished more heavily for doing so in the MLB than in the NPB, and that, coupled with the difficulty of facing MLB pitchers, doomed him to mediocrity.

Ichiro was much the same — a ground-ball production machine. When he came over from Japan, perhaps in hindsight, he should have flopped for the same reasons that Nishioka, Kensuke Tanaka, Munenori Kawasaki, and Akinori Iwamura flopped. He fit the profile — speedy, high-contact ground-ball hitter coming over from Japan. Hell, Ichiro’s best-case scenario should have been what Nori Aoki turned out to be.

Instead, he thrived.

Ichiro Breaks the Mold

When Ichiro arrived in America, he was nothing short of a revelation, and a key factor in the Seattle Mariners posting the best record of the modern era in 2001 — and he was arguably the face of the franchise for close to a decade.

Ichiro’s high-contact, low walk/strikeout approach shouldn’t have worked. I ran Ichiro’s 2003 season through my similarity tool, and the best comps I generated were Jose Vizcaino’s 2004 season, Warren Morris’ 2003 season, and Brad Ausmus’ 2004 season (yes, that Brad Ausmus). None of these guys posted a wRC+ over 90 in those years, but Ichiro was at 112. How did Ichiro get by using a strategy that had failed so many hitters before him?

Career BABIP leaders by SLG

On paper, the answer is BABIP. For his first four seasons, Ichiro never posted a BABIP below .333. While the league average for BABIP is around .300, elite players generally have a BABIP skill above .300 as a result of making elite contact. If we make a rough and naive assumption that a high SLG means that a player made good contact, we see that the among the top 15 career BABIP leaders (with 10000 PA), most of them made good contact, except for Lou Brock … and Ichiro.

It gets weirder. Remember all that talk about ground balls? Ichiro hit a lot of them — since 2002, the earliest season for which we have batted-ball data, Ichiro has hit the most ground balls in the majors, almost 800 more than 2nd place (Derek Jeter). Here is a scatterplot of GB% versus BABIP for qualified single seasons since 2002.

GB% vs. BABIP, 2002-2017

There exists a weak, but roughly positive correlation between BABIP and GB%. Most everyone is hanging out somewhere around the 35%-50% GB% and .250-.350 range, but then there’s Ichiro, who consistently posts BABIPs well above what he should be getting. Ready? It gets even weirder.

GB% vs. BABIP vs. Age, 2002-2017

Here’s that same chart, but I’ve thrown in the ages of each hitter in a gradient color scale. There’s a good spread around here, but I’ve highlighted Ichiro’s 2004 season, and it should stand out in three big ways. First, he posted one of the highest GB% since 2002 (63.1%). Second, he posted the second highest single-season BABIP since 2002 (.399). And third, he was 30 when he did this! Many of the light blue values in the upper right of the column belong to Ichiro. Which is really unusual, since many of them are when he’s older than the median MLB player (29 years old).

GB vs. BABIP vs. Older or Younger than 29

In this chart, the red dots represent hitters 29 years old or younger, and the blue dots represent hitters 30 years old or older. Notice how there’s a roughly even mix in the middle, but older hitters tend towards the bottom left, and younger hitters tend towards the upper right (though there are exceptions to each).

GB vs. BABIP vs. Older or Younger than 29 without Ichiro

Here’s that same chart, but I’ve removed Ichiro’s seasons — look at the far upper right. See the difference?

Ichiro’s specialty is defying all aging curves and all logic by consistently posting these ridiculous BABIPs while acting like a ground-ball machine, and making contact that most hitters would be ashamed of.

Legs Don’t Fail Me Now

We’ve already identified that Ichiro makes sub-par contact, hits a lot of ground balls (not exactly a recipe for production), and doesn’t strike out or walk much. No, the biggest tool for Ichiro, as anyone who watched him play could tell you, was his speed.

August Fagerstrom previously found that Ichiro had elite speed in his younger days, estimating his time-to-first in his prime as just under 3.75 seconds, which would blow Billy Hamilton (3.95 seconds) out of the water. It’s no exaggeration to say that Ichiro could be one of the fastest men in MLB history.

So many hitters came over from Japan with profiles similar to Ichiro — speedy ground-ball hitters who make a lot of contact. But none of them had Ichiro’s generational speed, and so, none of them found the type of sustained success that he did.

One cannot help but feel a sense of wonder in looking at Ichiro’s career. Because his production relies almost solely on his ability to make contact and his speed, tools that decay slowly with age (I’m aware that speed tends to decrease with age, but exceptionally speedy runners such as Chase Utley and Rajai Davis can retain their prowess on the basepaths well into their late 30s), he was able to defy what we might expect from someone of his age and with his batted-ball profile.

Ichiro was shooting the moon with his approach the plate, in a way. Sabermetric wisdom tells hitters to elevate, draw walks, don’t be afraid to strike out, make solid contact, and don’t worry about speed. Ichiro did the exact opposite and was rewarded handsomely rewarded for it. I can think of no more unique player with such a storied career and legacy. Here’s hoping 2017 won’t be Ichiro’s last hurrah.


The Giants’ Not-So-Shiny New Toy

The Giants made a big splash by acquiring Evan Longoria, owner of three All-Star nominations, three Gold Gloves, a Silver Slugger, and the 2008 AL Rookie of Year. I will come right out and admit that I have hardly spent any time thinking about Longoria at all through his 10-year career. As a fan of an NL West team, the Rays are about as far away from my realm of focus as you can get. Throw in the fact that they are a small-market team dwarfed by the Yankees and Red Sox, and Longoria simply hasn’t made a huge impression on me.

After reacquainting myself with his player page, I realized how much I have been missing. Longoria has amassed almost 50 WAR in his career so far, placing him on the bubble of many Hall of Fame stats despite being only 32 years old. He has avoided any disastrous seasons, as his lowest WAR total was 2.2, and that came in a 2012 season when he only played in 74 games. Almost as impressive as his WAR totals – that 2012 season has been the only season in 10 years that he missed significant time due to injury. In the past five years, he has played in more games (798) than anyone in the MLB. He has been the epitome of health and consistency for a decade.

Longoria has earned his value by being very well-rounded. He provides significant value with his bat, as his career wRC+ mark of 123 matches up with the likes of Yoenis Cespedes, Jose Altuve, and Mookie Betts, all extremely accomplished hitters that have yet to enter their late-career decline phases. As the three Gold Gloves imply, Longoria is also an impressive fielder, with career marks of 75 DRS and 89.1 UZR. While not a massive base-stealing threat, he has shown enough speed and baserunning intelligence to provide slightly above-average baserunning value. Simply put: the dude is good at playing baseball, and he’s been proving it for an entire decade now.

As impressive as that resume is, the Giants don’t get to enjoy any of his past accomplishments. They didn’t trade for 2008-2017 Evan Longoria, they traded for 2018-2022 Evan Longoria. So now the question becomes: Is Evan Longoria still good? Jeff briefly touched on this immediately after the trade, but I wanted to take a deeper look.

At 32 years old, he is past the typical peak years for most baseball players, and in Longoria’s case, he already sustained a pretty clear peak over his first six seasons (ages 22-27). As Jeff noted, he put up a wRC+ of 135 during this time; compare that to his four seasons since then (ages 28-31), when his wRC+ has dropped to 108. Don’t get me wrong – 108 is still good! It’s just not the elite All-Star player we saw at the front of his career. His defense has followed the same trajectory, as he put up +79 DRS and +78.4 UZR over his first six seasons, then dropped to -4 DRS and +10.7 UZR over his last four seasons.

This is a familiar story: good baseball player gets older, becomes worse baseball player. But it’s so familiar that it can also be a trap – Longoria might end up following the Adrian Beltre career path, who posted a 6-WAR season at 37 years old. Looking at the numbers, though, I just can’t make myself believe that Longoria is anything more than a useful starter right now, and one that will shortly become a below-average player.

Longoria’s strikeout rate immediately jumped out to me, as he only struck out 16.1% of the time last year, setting a new career low, almost 4% below his career average. This is promising! In an era of increasing strikeouts, Longoria is figuring out how to put more balls in play, giving him more chances of getting on base. Of course, this line of thinking requires that he is trading strikeouts for quality batted balls, and considering his ISO last year sat 50 points below his career average, it didn’t look like this was the case. After digging deeper into some plate discipline numbers, it became very obvious to me what was happening.

2013 was Longoria’s last star-caliber season. The following year, his wRC+ dropped from 132 to 105, with a corresponding spike in Swing%. All of a sudden, Longoria was much more aggressive, swinging at more pitches both inside and outside of the zone. And especially in 2017, he seemed to be focusing intently on putting the ball in play, with a large spike in Contact% despite seeing the 2nd lowest Zone% in his career. Some people are able to cut strikeouts by controlling the strike zone better, but it looks like Longoria was cutting strikeouts by swinging more often and making poor contact on bad pitches. Consider his batted-ball distribution:

The first big red flag here is the red line along the bottom. Once again, starting in 2014, we start seeing a worrisome trend as he began hitting more and more infield flies. All his improvements in strikeout rate are erased here, as infield flies are essentially automatic outs and are just as bad. The other interesting tidbit in this graphic is the interplay between his GB% and FB% the past two years. Longoria had a mini-offensive resurgence in 2016, and it looks like that can be attributed to him lifting the ball more often. In 2017, he lost all of his FB% gains and then some, driving more balls into the ground than ever before.

Jeff also touched on the relevant Statcast data. Longoria’s exit velocity dropped significantly last year, as did his rate of barrels and xwOBA. There was nothing fluky going on for Longo in 2017 – he was swinging more often but making worse contact, and more of his batted balls were either going into the ground or popped up in the infield.

Is a turnaround completely out of the question? Of course not, nothing is out of the question. Perhaps a change of scenery will provide a spark for the 32-year-old. Perhaps he will be motivated to prove to the baseball world that the Giants made a good trade, and he will work harder than ever to make it back to All-Star levels. Even if he simply sustains his current production, he is still a 2-3 win player right now. But the Giants need more than that, and we’re already four years into a significant decline for Longoria. Both his bat and his glove are on the wrong side of the age curve, and it looks like the Giants just added another expensive, aging veteran to throw onto the pile.


Giants, Rays Make Strange Trade

On December 20th, the Rays shipped Evan “Career Ray” Longoria to the Giants for Christian Arroyo, Denard Span, Matt Krook and Stephen Woods. On the surface, this seems like a deal that fits the needs of both teams. The Rays have initiated yet another rebuild that Longoria didn’t want to be a part of, and got some young players in return. Arroyo is a former top-100 prospect who, despite destroying lower levels in 2017, struggled in his debut with the Giants. The two arms are the classic “pitching prospects,” and, well, Denard Span is Denard Span. On the other side, the Giants filled an absolutely gaping hole at third base. They no longer have to play Pablo Sandoval, and that should be a win for any team.  However, this trade has left me scratching my head, and there’re a few reasons why. Let’s look at some statlines.

Player A – 96 wRC+ / 11 DRS

Player B – 108 wRC+ / 10 DRS

Which one do you think the Giants just gave Christian Arroyo up for? The answer is A, Evan Longoria, a 32-year-old who is making 13.5 million dollars a year.  Player C is Todd Frazier, a 31-year-old (almost 32-year-old) free agent who will more than likely sign a contract in the 10-12 million dollar range. Now, Longoria did have a down year at the plate in 2017 and is the better defender of the two, but looking at these numbers raises some questions. Why did the Giants give up a talented young prospect for someone they could have just signed in the free-agent market? It’s understandable that you can look at Longoria’s track record and expect him to bounce back from a down year, but there are a few other things to consider before jumping to that conclusion. First of all, Longoria is moving from Tropicana Field to AT&T Park, one of the most pitcher-friendly parks in the majors. According to Baseball Reference, Tropicana was also stifling, but still, moving to AT&T is not a welcome change for any hitter. Secondly, Longoria is 32 years old, and we all know what side of 30 that’s on (it’s the bad side). Thinking Longoria can bounce back during his age-32 season is a tough sell for anyone who believes in the aging curve.

Let’s consider what the Giants could have done differently. If they would have signed Todd Frazier, they would have been getting a cheaper contract for a player with essentially the same skill-set as Longoria; a power right-handed bat with a plus glove at third base. They’re practically the same age, and now, the Giants can keep Christian Arroyo around and give him some more time to develop in the minors or give him exposure at the major-league level if Joe Panik continues to struggle. Yes, they did offload Denard Span’s contract, so technically, Longoria is cheaper than Frazier would be, but I’ll address that in just a bit. They also had the option to not sign anyone at all and hope Arroyo develops into some sort of Matt Duffy 2.0. To make it clear, I don’t think Arroyo will ever be as good as Longoria, but I have no problem believing he could be a 2-3 win player a few years down the road.

Now, in terms of the big picture, only one of these moves keeps the Giants’ hopes for the future alive. If you haven’t noticed, all the stars on the Giants are going to be on the wrong side of the aging curve soon. Signing Frazier only contributes to that problem. Arroyo could have been a piece the Giants could have built their team around in the future when all of their other superstars are decrepit skeletons. Remember what I said about Denard Span being Denard Span and his contract being offloaded? That’s another problem that the Giants have to fix now. Denard Span isn’t good, but he’s essentially league-average at playing center field. Who do the Giants stick out there now? Steven Duggar? Mac Williamson? Both of those options represent a downgrade to Span. Instead, we can expect the Giants to throw a bunch of money at a free-agent outfielder, perhaps someone like Lorenzo Cain. Cain would represent a huge upgrade over Span, but Cain is still another 31-year-old who is projected to decline in his production while making close to 20 million dollars a year, which cancels out the effect of getting rid of Span’s contract in the first place.

If they do sign Cain, the Giants will then be spending more money than they were before they traded for Longoria in the first place. If they don’t, then they’ll have to expect lackluster production out of center field, somehow even more lackluster than Span already was. Finally, you have to consider if this move actually makes the Giants better than the rest of the NL West. It doesn’t. The Dodgers are still a super team, the D-Backs are still very good, and the Rockies, despite having some question marks about their rotation, are a good team as well. Well, okay, the Giants won’t finish behind the Padres, but you still have to be better than the best team in baseball last year to win your division. This is a lot to ask for a Giants team that has only added something like 1.5 wins this offseason and was the worst team in the National League last year. Don’t get me wrong; getting Longoria, a good player who makes way, way less than his market value is a great move, but I don’t think it is in the context of where the Giants are as a team, what they gave up, and the holes they still have to fill.

As for the Rays, this is a move that was going to happen eventually. They see that the Yankees and Red Sox are going dominate the AL East for a while, so they decided that now is as good a time as any to tear it down and start again. The Rays will continue to the do the Rays thing we all know and love, stockpiling as many Matt Duffy-type players as they can while consistently pumping out awesome pitchers from their farm system, then trading those pitchers for more clones of Matt Duffy. Arroyo will more than likely take the second-base job in Tampa over at some point during 2018, and will be a fun player to watch in the Rays lineup. Span might end up taking some time from Mallex Smith in left field, but Smith is definitely the more exciting and interesting player of the two. The real Matt Duffy will end up playing third, and the Rays will finish 3rd or 4th in the AL East like they do almost every year. Again, this a trade that was going to happen, but it’s just surprising to see how it ended up going down.


Does Lifting the Ball Have a Ceiling?

Elevating is en vogue; everyone wants to do it and it seems like every hitter who does it can become a power hitter, especially with rumors about a new ball. There have been many examples of successful hitters of that mold: Daniel Murphy, Justin Turner and Jose Altuve, among others. Is there a limit to this? Could we see hitters with a 25% GB rate in the future? 20% 15%?

One thing that seems to cap this is BABIP. There is a pretty positive correlation of BABIP and GB rate, i.e. GB hitters tend to have a higher BABIP. That seems logical since FBs tend to have a lower average, and even if they are hits they often don’t count for BABIP as they are often home runs.

This table shows the relation of BABIP and GB rate between 2008 and 2017. You can see that BABIP does go down with lower GB rates, but wRC+ is actually better with lower GB rates. Still, you could see a point being reached where the lower BABIP eats up the advantages.

GB rate >0.35 0.35-0.4 0.4-0.45 0.45-0.5 0.5-0-55 >0.55
BABIP 0.287 0.290 0.299 0.304 0.314 0.320
wRC+ 106 102 101 95 90 93

Average launch angle shows a similar picture:


av. LA <8 8 to 10 10 to 12 12 to 14 14 to 16 16 to 18 >18
BABIP 0.318 0.314 0.305 0.298 0.300 0.289 0.274

It seems that once you get past a certain launch angle or GB rate, a drop in BABIP is inevitable. However, an exception might be possible. I looked up guys with a lower than 35% GB rate and a FB rate of lower than 45%, and their BABIP was 0.304. Those guys were pretty rare between 2008 and 2017, but it is possible. You just need to get the ball off the ground and avoid both pop-ups and high outfield fly balls above 25 degrees. Not an easy thing to do, though, as the bat is a round object, and batted balls will always be distributed rather normally around the average LA, meaning that a higher average LA usually will mean more high outfield fly balls.

However, it is possible to imagine a super-hitter who has such good bat control that his band is very narrow. The best example of this might be Daniel Murphy, who managed to have a 34% GB rate with just a 40% FB rate (meaning a very high LD rate), and subsequently a very high (.345) BABIP over the last three years.

So we could indeed imagine a kind of “super Murphy” who hits 25% grounders with lower than 45% FBs. However, to date, we have not seen a guy sustaining such high LD rates; that guy would probably have to have superhuman bat control (which probably eliminates almost all >25% K rate guys). But with modern training methods, who knows what might happen.


Should You Even Draft a Catcher in Fantasy Baseball?

If you play in a traditional 12-team 5×5 roto auction league with 25-man rosters and a $200 FA budget per season, you might constantly feel like there is solid waiver-wire talent out there, but your roster is too stacked to cut anyone. So, you offer your league-mates a trade of two or three mediocre players for one of their better players, but they are facing a similar roster crunch and immediately see right through your pernicious plan. It can be tempting to cut the lowest-production, lowest-upside player on your roster, which in many cases is the $1 catcher you drafted. But is that catcher really providing value to your roster? Let’s break it down.

Let’s say you draft Realmuto this year for $10 and expect a line of 13 HR, 53 R, 58 RBI, 7 SB, .275 AVG (Steamer projected line, ~500 PA).  The other cost of drafting Realmuto is the opportunity cost of his roster spot. In a typical fantasy week, there are three or four days where your typical starting lineup is not intact. Whether it’s because a team is having an off-day or one of your regular starters is DTD with a bruised toe, holes in your lineup are bound to happen. A smart streamer can look for good matchups and plug those holes. If you have unlimited pickups allowed in your league, then there is no cost to picking up a player if you have an open roster spot. In my league, I can pick up players for $1 on free-agent days (M/W/F).

This begs the question: if you are streaming to fill in holes four times per week over 26 weeks of the regular season, and each game you plug in a streaming player you get 4 PA, then that is going to equal just over 200 PA and cost you around $78 FAAB (assuming three pickups per week * 26 weeks, and one of your streamed pickups fills holes twice in one week for a total of four fill-ins). What does a slash line of 200 PA for a waiver-wire bat look like?

Kevin Pillar screams waiver-wire bat. His Steamer projection reduced to 200 PA looks like: 5 HR, 25 R, 20 RBI, 5 SB, .270 AVG. That’s quite worse than Realmuto’s line in every way excepting AVG. It amounts to a little less than 50% of Realmuto’s line at the cost of $78 FAAB. Now you could argue that maybe amidst all your streaming you end up picking up a Jonathan Villar 2016 breakout type of bat and end up sticking with him and getting immense value, but that’s easier said than done. Maybe you are also going to research pitcher vs. batter matchups on a daily basis and you get an edge there, but that is also easier said than done.

How does the 200 PA of Kevin Pillar compare to a $1 draft day, bottom of the barrel catcher’s line? Even poor Jonathan Lucroy is projected by Steamer to beat this line: 10 HR, 44 R, 46 RBI, 2 SB, .268 AVG. Other such luminaries projected to outshine it include Tucker Barnhart, Christian Vazquez, and Tyler Flowers. Pretty much any catcher who is a starter and can bat .250+ for a season will put up much better counting stats than the Pillar line.

Long story short — even though your catcher’s line may look meek, and they don’t play every day, making your roster look thin, it will still likely be better than waiver-wire lineup hole streaming. Better to save your FAAB cash for other needs. If you play in an unlimited transaction league, you would still need about 500 PAs of Pillar to exceed the Realmuto line. That’s a lot of transactions, and you might not have time to get all the necessary PAs in. Punting C is like heeding the siren calls — it can be very tempting, but also a dangerous and costly exercise. Staying the course with the catcher you drafted is usually the best call in terms of value per FAAB dollar spent.


Juan Nicasio Has a New Slider, and He Needs His Old One Back

The Mariners recently inked Juan Nicasio to a 2-year/$17-million deal in their first significant addition to their pitching staff this offseason. After years as a middling starter, Nicasio emerged as a rock-solid relief option with the Rockies in 2014 before the Dodgers fully bought into his potential as a reliever the following year. The Pirates then acquired him and shifted him into the rotation a bit in 2016; however, he had more success in their bullpen and moved there full-time in 2017. He was again on the move last year, though — this time playing for two new teams — but he never started a game, posting a cumulative 2.61 ERA over 72.1 IP in 76 appearances.

He’s on the wrong side of 30, and breakout relievers tend to pop up and decline quickly, but it can be argued that Nicasio has done nothing but improve since moving into the bullpen.

Juan Nicasio as RP IP ERA AVG OBP SLG wOBA
2014 20.2 3.48 .227 .275 .400 .300
2015 56.1 3.83 .257 .359 .381 .320
2016 55.2 3.88 .249 .328 .387 .308
2017 72.1 2.61 .216 .277 .333 .265

As a reliever, Nicasio is largely a two-pitch pitcher, primarily throwing a four-seam fastball and a slider. He had occasionally mixed in a sinker and changeup in previous years, but 2017 saw Nicasio throw a four-seam fastball or slider 98.31% of the time. This pitch mix in combination with his K/9 dipping from slightly over 10 to just under 9 may raise a couple eyebrows, but Nicasio also improved his command considerably.

His 6.9% BB% in 2017 was his lowest since his debut season and marked a second straight year of improvement, and his 24.7% K% compares well to previous years. This would suggest that Nicasio is only getting more efficient with his outs, not striking guys out at a lesser rate. And sure enough, his 1.08 WHIP last year was by far the lowest it’s ever been.

A quick look at his splits from 2017 showed a distinct improvement against left-handed batters compared to previous years.

Juan Nicasio vs. LHH IP AVG OBP SLG wOBA
2015 14.1 .359 .494 .516 .427
2016 21.0 .241 .351 .476 .350
2017 33.0 .205 .252 .292 .235

In his largest sample yet, Nicasio made huge strides.

Since improvements against opposite-handed batters tend to suggest an improvement in a pitcher’s changeup or breaking ball, and given that Nicasio essentially throws just two pitches, his slider seemed like a good starting point. I found that (per Brooks Baseball) it had an entirely different shape in 2017.

Juan Nicasio Sliders Velocity HMov VMov
2015 86.92 1.94 1.86
2016 87.11 1.49 2.80
2017 88.92 0.47 4.04

While Nicasio’s slider was laterally less impressive in 2017, it made up for that with reduced drop.

Here is his slider in 2016 with a little frisbee action.

Slider 2016.gif

And here it is in 2017 a bit more tightly wound.

Slider 2017.gif

Nicasio’s slider was devastating to right-handers in 2015 and 2016 (cumulative .218 wOBA/.221 xwOBA), but it seemingly fell into the swing path of lefties, as they smashed it for a .369 wOBA/.272 xwOBA in the same period. In 2017, lefties floundered against it for the first time, posting just a .194 wOBA/.175 xwOBA. But his other slider disappeared.

Using this somewhat cutter-like breaking ball against RHB in 2017 yielded a .302 wOBA and .320 xwOBA. Considering the fastball didn’t play up (.298 wOBA/.334 xwOBA), that kind of performance is a slight concern, but righties’ triple slash against him was still an encouraging .225/.296/.367 (.287 wOBA).

On the surface, the Mariners seem to have gotten a quality reliever at about market rate for his talent, but I think there is still some upside here. Certainly, in this new slider, Nicasio has found a legitimate weapon against LHB, but the Mariners must hope his natural slider is not lost. In order to remain a high-quality, high-leverage setup man — the kind that posts sub-3 ERAs — he’s going to have to bring out both.


The Modern Eras Committee Just Elected Bartolo Colon to the Hall of Fame

Jack Morris pitched 18 seasons while Bartolo Colon has now pitched 20. They both have a career winning percentage of .577. Morris has 2478 career strikeouts while Colon has 2454. Morris had 254 wins while Colon has 240 in an era where they are harder to obtain. Colon won a Cy Young while Morris’s highest finish was third. Morris has an ERA+ of 105, compared to Colon’s career ERA+ of 107. In fact, if you only looked at their first 15 years, Colon’s ERA+ of 114 outperforms Morris’s ERA+ of 109 even more!

Perhaps you strongly believe that, despite their statistical similarities, Jack Morris was significantly better than Bartolo Colon. Still, the fact that an argument could be made that Colon is as good a pitcher as Morris shows just how big a mistake the Modern Eras Committee made in electing Jack Morris to the Baseball Hall of Fame this weekend.

The list of players who were once viewed as “obviously not Hall of Famers” does not stop at Colon, either. In his article on ESPN.com, David Schoenfield said that it would be foolish to treat Morris as a benchmark for Hall of Fame induction. This argument is in defense of the Hall of Fame’s level of “rigor” — many think that without maintaining a certain level, the Hall of Fame may lose it’s significance. However, I believe there is another characteristic that the Hall of Fame must preserve even more so than rigor in order to maintain its credibility — and that is justice. If the Hall of Fame exposes itself as being discretionary in its election of members, it will quickly lose its relevance.

By electing Jack Morris to the Baseball Hall of Fame, voters both lowered the level of rigor previously required for election and have left the Hall of Fame in a current state of injustice until the following eligible players are also elected: Curt Schilling, Mike Mussina, Andy Pettitte, Dave Stieb, Rick Reuschel, Orel Hershiser, David Cone, Sam McDowell, Luis Tiant, Kevin Brown, Vida Blue, Bret Saberhagen, and Kevin Appier,

And the following cases are re-opened for election: Dwight Gooden, David Wells, Jim Kaat, Tommy John, Wilbur Wood, Ron Guidry, Jimmy Key, Frank Tanana, Dennis Martinez, Mark Langston, Chuck Finley, Mark Buehrle, Frank Viola and Jose Rijo.

Every single one of these 30 pitchers had a higher career ERA+ than Jack Morris and have either a higher career value, a higher peak value, or both.

Looks like Colon may be able to hang up his cleats a little more confidently this off-season now that Morris is in the Hall.