On Drew Smyly, Michael Pineda, and the History of Signing Injured Free-Agent Pitchers
About 12 hours apart, news of two very similar moves broke out of Chicago and Minnesota, as the Cubs agreed to terms with Drew Smyly while the Twins signed Michael Pineda. Both pitchers inked two-year deals with $10-million guarantees and additional incentives based on innings pitched, but the two deals shared an even more important similarity: both pitchers underwent Tommy John surgery this summer and seem unlikely to contribute significantly during the 2017 campaign. Both clubs are clearly betting on a return to health and productivity in 2019 for the two still relatively young pitchers, as evidenced by the financial distribution of the contracts. Pineda is only owed $2 million for the upcoming season but will receive $8 million in 2019, while Smyly will be paid $3 million next year but will pull in $7 million the following year. Since both pitchers underwent surgery around the same time, during the middle of the summer, it seems unlikely that either will throw pitch in the coming season.
While uncommon, these types of deals certainly aren’t entirely unprecedented. The Kansas City Royals have inked three pitchers with similar situations over the past few years, with varying degrees of success. These contracts, given to Luke Hochevar and Kris Medlen in 2015 and Mike Minor the following season, seem to represent the most relevant examples of such a deal. While Minor was non-tendered by the Braves following repeated shoulder issues, both Medlen and Hochevar underwent Tommy John surgery the previous year. All three pitchers would appear for the Royals in the major leagues over the life of their deals, albeit with differing results. Hochevar would appear in 89 games for the Royals, and accumulate only marginal value, as he posted a FIP around 4.00 and tallied only 0.3 WAR combined before succumbing to thoracic outlet syndrome surgery. Kansas City declined their option over Hochevar last winter, who became a free agent and sat out 2017 recovering.
Medlen would also return to pitch in 2015, making eight starts and seven relief appearances for Kansas City. He saw an uptick in walks and a downturn in strikeouts compared to his previous work, but overall pitched his way to a 4.01 ERA with similar peripherals and rang up half a win of value. 2016, however, would not be so kind to Medlen, as he was shelled to the tune of a 7.77 ERA while walking more batters than he struck out and battling a shoulder injury. He would sign a minor-league deal with the Braves after the season, but would not return to the majors. Although he did not appear with the Royals in 2016 after struggling in AAA, Minor marks the largest success story of the three. Over 65 relief appearances, Minor registered a 2.62 FIP and was worth 2.1 WAR out of the bullpen. He recently signed a three-year contract with the Rangers to return to a starting role.
In total, the Royals invested $25.75 million in the three pitchers and saw them accumulate a grand total of 2.9 WAR, with most it coming from Minor. This works out to a $/WAR figure of $8.88 million per win, which is slightly higher than the $8 million per win value assumed of the free-agent market. Based on these three deals, it would appear that this type of signing is not a bargain, but rather an overpay on average. However, it isn’t fair to make such an assumption without looking at a larger sample of data. If we classify a similar deal as one in which a team signed a pitcher that was injured at the time of the signing and expected to miss at least part of the following season and either signed a major-league deal or a two-year minor-league pact, that leaves us with 18 similar signings since 2007. One of these signings, Nate Eovaldi, has yet to return from his injury but should in 2018, so we won’t include him in the sample.
These 17 signings correlate to 25 player seasons following injury, with 24 of those representing guaranteed contract years, as well as one option year (Joakim Soria, 2015). The breakdown of these player seasons by games, innings pitched, strikeouts, walks, earned runs, and WAR are presented in the table below:
| G | IP | K | BB | ER | WAR | |
| Total | 447 | 725.2 | 606 | 246 | 347 | 6.9 |
| Mean | 18 | 29 | 24 | 10 | 14 | 0.27 |
| Median | 7 | 20 | 15 | 6 | 10 | 0 |
Altogether, when on a big-league mound, the group pitched to a 4.30 ERA to go along with a 7.52 K/9 and a 3.05 BB/9, numbers not entirely dissimilar from, say, Dustin McGowan or Sal Romano in 2017. So even the healthy group put together fairly middling results, but it’s also important to remember that eight of these player seasons wouldn’t see the player throw a single big-league pitch, and therefore provided no value to the club. Let’s plot the distribution of value produced by WAR:
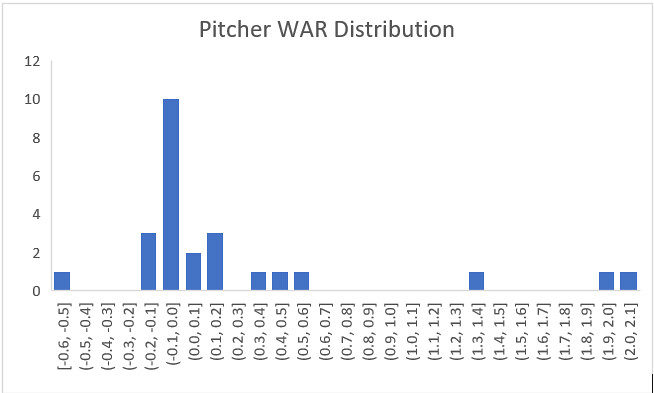
That 2.1 WAR recorded by Minor last season was the highest figure of any player season in the sample, and besides Mike Pelfrey’s 2013 season, no other player season really comes close. Of the 10 player seasons recorded by primarily starting pitchers, only Pelfrey’s season even came close to average production, as every other starter either wasn’t durable or good enough to rack up any significant value. On the relief side, Minor and 2014 Joakim Soria both excelled, but no other relief season (out of the 15 in the sample) even crossed the 0.5 win threshold. As with the Royals pitchers earlier, it is important to look at these deals from a value standpoint. We can do this by calculating $ per WAR for the whole sample to find a mean, and for each deal to find a median, and visually represent the distribution. Overall, teams invested a total of $78 million in these 25 player seasons, with $71 coming in guaranteed money and $7 million in Joakim Soria’s club option. All minor-league deals to MLB veterans were assigned a dollar value of $333,333 for ease of calculation. Bonuses and incentives were ignored from this figure, as it is very difficult to find these details of the player contracts and few of these seasons would reach such incentives. As we saw above, the sample produced a total WAR of 6.9. This means that on average, teams paid $11.3 million per win when committing money to injured pitchers in hopes of a bounceback, well above the market rate of $8 million per win in free agency. Based on some quick calculations, teams paid that $78 million for production worth $55.2 million, for a net loss of $22.8 million. Let’s now look at the value gained/lost for each contract (in millions of $):
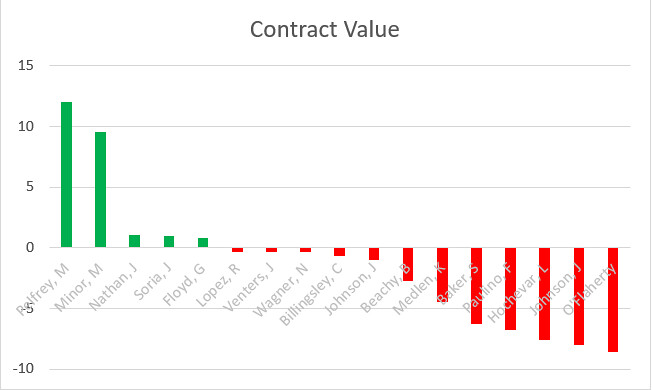
As you can see, only five such contracts actually generated positive (above market value of $8 million per win), while the remaining 12 contracts provided their team with below-market value. The mean loss per contract is $1.34 million, while the median is represented by the Phillies’ $700k loss on Chad Billingsley. While neither number is outrageously high, both figures only serve to reinforce the fact that teams have generally lost more often than they have benefited from inking an injured pitcher.
None of this is necessarily to say that the Pineda, Smyly, and Eovaldi contracts are doomed or that no team should ever make this type of investment, but simply to look at how similar deals have worked out in the past. Admittedly, the sample is hardly big enough to make any sort of definitive conclusion, but the overall trend on these “bargain” signings isn’t pretty. Both Smyly and Pineda are better pitchers than most in the sample, so it is entirely possible that they (along with Eovaldi) could significantly shift the outlook on these types of deals in the future. Whether this trio of pitchers can buck the trend or will follow in the footsteps of their predecessors will certainly be an interesting, if minor (pun intended) storyline to watch over the next few seasons.
FanGraphs.com leaderboards, Baseball-Reference transaction data, and MLBReports Tommy John surgery database were all used extensively for this research.
remember Ben Sheets signing with the A’s a while ago? In similar-ish circumstances
I considered using Sheets in the sample but his deal came after he sat out all of 2009 recovering from 2008 TJS and he was fully healthy by Opening Day of 2010. Similar situation but I looked only at deals where the team signed the pitcher knowing full well that they would be injured for part of the deal. Thanks for the read and for the comment!
Great article!!
Just wondering, why the cutoff? Could you have gone further back and had an even larger sample, or is this actually all inclusive?
Thank you for the kind words and the question! There were a couple of reasons, but the biggest one was just reliability of data. It’s a lot more difficult to find contract details for signings before 2007 (no MLBTradeRumors), and those were pretty important in the study, especially identifying whether a deal was major or minor league. Additionally, I felt less comfortable using the $/WAR calculation going back further and finally I’m too young to really remember any of these deals before 2007, so it’s harder to know if they truly fit what I’m looking for in a data point. That said, I probably could have gone back further to get a larger sample, and that’s something I’ll look to do! Thanks for the feedback!
You can say the same about 1st round draft picks. After the top 10 picks you see bust rates of 60-70%.
In baseball, batting 300 is pretty good
Thank you for the read and the feedback! However, I’d respectfully argue that these are entirely different circumstances. In the draft, teams don’t expect significant contributions from players until four to five years down the road, whereas with the types of deals I examined teams are looking for contributions by the second year at latest. Additionally, the payoff for a successful first round pick far exceeds what has been seen in any of these contracts, where the maximum payoff was Minor’s 2.1 wins. For example, between 2006 and 2011, 33% of players drafted between picks 10 and 30 accrued at least that much value over the course of their first six MLB seasons. It’s true that both scenarios have a fairly high bust rate, but I think the similarities largely stop there between amateur draft picks and major league free agents. Teams expect to do a lot better than hitting .300 on MLB free agents, and need to do so in order to compete, and historically this type of investment hasn’t typically been a great one for the team.
It may not count, since it was technically the second contract with the team a year later that bore fruit, but I can’t help thinking about how Chris Carpenter became an ace starter and Cy Young winner for the Cardinals after they originally signed him while he was recovering from injury in December 2002 and then missed the entire 2003 season.
Awesome piece to get us through this Fangraphsless holiday stretch.
It sort of reminds me of a piece that was posted on the site maybe a year ago, showing that signing lower tier free agents to cheaper contracts doesn’t actually work better than signing the big fish for huge money. Teams feel safer spending fifty million than a hundred, but those big players are surer bets a lot of the time.
Just joined Fangraphs so I could offer kudos to you, Mr. Linwood. I should have an asterick by my name to signify “Geriatric membership”!
What I find interesting about the data is the wide disparity between the the average WAR values and the contract amounts spent to generate those values. Sample size seems unlikely to dramatically change the calculus – so I am wondering why the available data did not induce the GM’s negotiating the Smyly and Pineda contracts to price these more closely to the WAR values suggested by the available – even if SSS- data. These contracts did not pass the “common sense” test either.
Jon Lieber signed a 2-year $3.25 million contract covering 2003 and 2004 when he was going to miss the 2003 season with a UCL tear. In 2004, he had 27 starts, posted a 14–8 record, a 4.33 ERA, 102 strikeouts, 18 walks, and 216 hits allowed in 176 2⁄3 innings pitched, good for 2.8 bWAR. In the play-offs he was the winning pitcher in game 2 against the Red Sox and the losing pitcher in game 6.