What Is an Ace? (2013)
After the 2011 season I asked, and attempted to answer, the question, “what is an ace”?
It’s time to do that again.

Ok. While Kershaw is the aciest of aces right now, that’s not really the answer that we’re looking for.
I certainly don’t claim to be the first person to do something like this, nor am I the most rigorous, but I think it’s good to take a look at things like this every now and then just to reset our baselines.
What I did was to take the average of every starter’s fWAR and RA-9 WAR. Then I used that number to group pitchers into groups of (roughly) 30 — 30 aces, 30 number 2’s, etc. Then, I looked at the average performance of the pitchers in each group.
Here’s what I found:
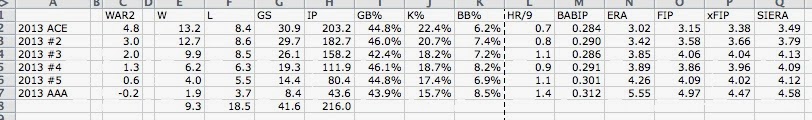
There’s a couple of interesting things to note.
One is that the best 30 pitchers in baseball are, far and away, the best group. They strike out the most hitters, they walk the fewest hitters, they give up the fewest home runs, they have the lowest BABIP, they’re the best. That’s not surprising when guys like the above-pictured Kershaw, Cliff Lee, Max Scherzer, Justin Verlander, Matt Harvey and Yu Darvish are in the ranks.
The second interesting thing is how similar the #3, #4 and #5 groups are in terms of performance. Look:
#3 18.2% K, 7.2% BB, 3.85 ERA, 4.06 FIP, 4.04 xFIP, 4.13 SIERA
#4 18.7% K, 8.2% BB, 3.89 ERA, 3.86 FIP, 3.96 xFIP, 4.09 SIERA
#5 17.4% K, 6.9% BB, 4.26 ERA, 4.09 FIP, 4.02 xFIP, 4.12 SIERA
In many ways, every way other than walks really, #4 starters outperformed #3 starters. Well, in every way except for number of starts and innings. Number-three starters made about seven more starts and pitched almost 50 more innings than #4 starters. Similarly, #5 starters were a little worse than both #3 and #4 starters but what really limited them from producing value was that they made 12 fewer starts and pitched half as many innings as #3 starters.
The third point is similar to the above. Starters not in the top five accounted for more starts and more innings than the best pitchers in baseball. That makes sense when you stop to think about it, there are more bad pitchers than elite ones, but we don’t think about just how important it is for the other starters to make their starts so these guys don’t have to.
As I mentioned when I first did this little exercise after the 2010 season:
Next time your team signs a pitcher with a 10 – 8 record and 3.99 ERA in 160 innings realize just what you are getting. One of the top 100 pitchers in the league.
The numbers are a little different now — now the average #3 is 10 – 9 with a 3.85 ERA in 158 innings — but the point remains the same: the average baseball fan vastly underrates pitcher performance.
But it is fun listening to blowhards argue about whether each pitchers is a “number 2” or only a “4”. And whether a minor leaguer has a “ceiling” of a “2”.
One man’s fun is another’s hell.
But don’t worry. Those blowhards are not likely to read this en masse. You’ll still have plenty for your entertainment.
I agree. I always look forward to listening to my in-laws insist certain pitchers are not “true aces” and debate whether other are “number 2s” or only “numbers 4s”.
Anyway… I enjoyed the article. Merry Christmas.
Interesting but a rather pointless article
You’re fortunate you can even talk baseball with in-laws. You’re the lucky one.
Question. Did the pitchers conveniently lend themselves to groupings of thirty for your sample size? I wonder how things would look if you used standard deviations, SSS caveats aside.
No, they didn’t. I used groups of “roughly” 30. The difference between pitcher #30 (Travis Wood) and pitcher #31 (Homer Bailey) was .05 of a win – certainly no significant.
Using standard deviations would be the same thing, I’d think. There’d have to be cutoffs somewhere.
One of the main things that this is shows is that there’s certainly an “Ace” group. Then maybe another tier. Then, a bunch of similar guys whose value is in being able to pitch innings and make starts.
Here’s a link to a google doc with the data
https://docs.google.com/spreadsheet/ccc?key=0AmeKa-GX0IVJdGdCaDg1TzRFQklBeE1SS1ZSSEwyZ1E&usp=sharing
I wonder if your results are misleading due to the fact that you used a cumulative stat, and that over only one season.
After the #1s, your starters are basically sorted by how many starts they managed to make. So you end up counting pitchers like Salazar, Gray, and Cole as 3, 4, or 5 starters when they pitched like elite starters but just didn’t amass enough WAR in their half-seasons. Meanwhile, guys like Chacin and Quintana could be counted as ‘aces’ since they made the top 30 in WAR.
I like the concept, I just think you need to go back further than just one season, and/or include some kind of per-game calculation to really gauge the differences between #2, #3, #4, and #5 starters.
That’s actually an important point.
The ability to make starts is an important part of being an ace. There just aren’t that many pitchers who make 30 starts in a given season.
Interesting. Do you have a plan for other seasons? I wonder WAR 5 is normal stadard to be called the Ace.