Author Archive

Using kwERA to Project Masahiro Tanaka

Masahiro Tanaka

In just a few months Masahiro Tanaka is very likely to throw his first pitch in the major leagues. Hopefully, he will do so as a very wealthy member of the Los Angeles Dodgers.

If you’re reading this post, you probably have some interest in how Tanaka will perform.

A lot of people who know a lot more about baseball, Tanaka, and statistics have tried to answer this question. But, I’m going to throw in my two Yen anyway.

To my count there have been seven starting pitchers who have transitioned from Nippon Professional Baseball to Major League Baseball since 2007. A pretty arbitrary date that leaves out guys like Kaz Ishii, Hideki Irabu, Masato Yoshii and Hideo Nomo. I chose 2007 because between Ishii in 2002 and Dice-K and Igawa in 2007 there weren’t any starters that came from Japan that made regular starts and that five-year gap made for a convenient, if nothing else, endpoint.

The pitchers that I included in the study were: Yu Darvish, Hisashi Iwakuma, Hisanori Takahashi, Kenshin Kawakami, Hiroki Kuroda, Daisuke Matsuzaka, and Kei Igawa.

While gazing upon the stats of these pitchers I noticed that, for the most part, they were able to maintain their strikeout rates after moving to the MLB. I also noticed that most had a significant increase in walk rate.

Looking at the pitchers’ last three years in the NPB and first two season in the MLB:
K and BB rates for NBP pitchers

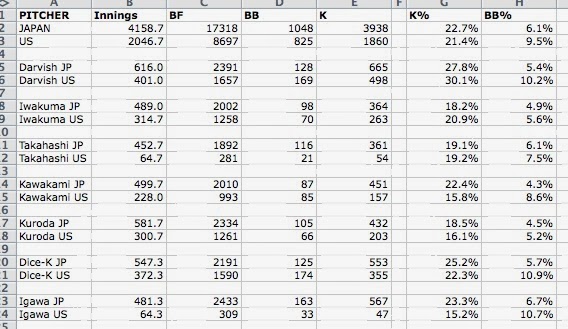
Overall the pitchers in the NPB K’d 22.7% of hitters and 21.4% in the MLB while walking 6.1% in the NPB and 9.5% in the MLB. Most of the pitchers in the sample followed this pattern of similar K rates and increased BB rates. The correlation between the K%’s had an r-squared of .37 and the BB%’s had an r-squared of .32.

This lead me to kwERA. kwERA uses only walks and strikeouts to project ERA. The formula is quite simple: 5.40 – 12*((K-BB)/PA).

There’s some problem with this. kwERA uses a constant (5.40) instead of a factor that changes each year. I could have found that constant, but didn’t. The correlation between K% and BB% isn’t THAT strong. But, it is what it is.

The kwERA for the combined K% and BB% of all the pitchers in the sample for their last three NPB seasons was 3.38. Their kwERA for their first two seasons in the MLB was 3.83. That’s an increase of .46 runs or 14%.

Next, I calculated Tanaka’s kwERA for his last three NPB seasons. It came out to 2.81 (24.9% K-rate and 3.3% BB-rate). Adding .46 runs to that gives an expected MLB ERA of (2.81 + 0.46) 3.27. Increasing his kwERA by 14% gives an expected MLB ERA of (2.81 * 1.14) 3.19. I then averaged these to get an expected MLB ERA of about 3.23.

I went back and looked at how well this expected kwERA compared to how the pitchers actually performed in their first two MLB seasons. I did this by comparing the average of adding 0.46 to the expected kwERA and increasing expected kwERA by 14% (xkwERA) to the average of the pitchers’ ERA, FIP, xFIP, and SIERA over their first 2 MLB seasons (EXFS AVG).

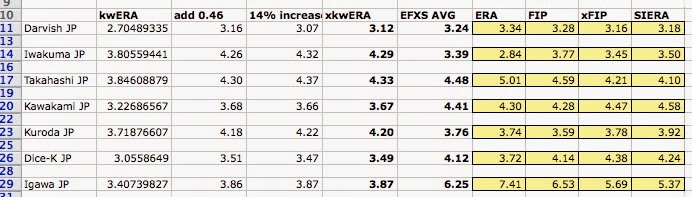
By far the biggest miss was Igawa. His MLB struggles are well documented. Also this method could not have accounted for Iwakuma performing better in the MLB than he did in the NPB. The other cases are within around half of a run difference.

If Tanaka signs with the Dodgers and pitches to something like 3.23 earned runs allowed I’ll be ecstatic.

Comments, criticisms, suggestions all welcomed.


What Is an Ace? (2013)

After the 2011 season I asked, and attempted to answer, the question, “what is an ace”?

It’s time to do that again.

Kershaw

Ok. While Kershaw is the aciest of aces right now, that’s not really the answer that we’re looking for.

I certainly don’t claim to be the first person to do something like this, nor am I the most rigorous, but I think it’s good to take a look at things like this every now and then just to reset our baselines.

What I did was to take the average of every starter’s fWAR and RA-9 WAR. Then I used that number to group pitchers into groups of (roughly) 30 — 30 aces, 30 number 2’s, etc. Then, I looked at the average performance of the pitchers in each group.

Here’s what I found:

There’s a couple of interesting things to note.

One is that the best 30 pitchers in baseball are, far and away, the best group. They strike out the most hitters, they walk the fewest hitters, they give up the fewest home runs, they have the lowest BABIP, they’re the best. That’s not surprising when guys like the above-pictured Kershaw, Cliff Lee, Max Scherzer, Justin Verlander, Matt Harvey and Yu Darvish are in the ranks.

The second interesting thing is how similar the #3, #4 and #5 groups are in terms of performance. Look:

#3 18.2% K, 7.2% BB, 3.85 ERA, 4.06 FIP, 4.04 xFIP, 4.13 SIERA
#4 18.7% K, 8.2% BB, 3.89 ERA, 3.86 FIP, 3.96 xFIP, 4.09 SIERA
#5 17.4% K, 6.9% BB, 4.26 ERA, 4.09 FIP, 4.02 xFIP, 4.12 SIERA

In many ways, every way other than walks really, #4 starters outperformed #3 starters. Well, in every way except for number of starts and innings. Number-three starters made about seven more starts and pitched almost 50 more innings than #4 starters. Similarly, #5 starters were a little worse than both #3 and #4 starters but what really limited them from producing value was that they made 12 fewer starts and pitched half as many innings as #3 starters.

The third point is similar to the above. Starters not in the top five accounted for more starts and more innings than the best pitchers in baseball. That makes sense when you stop to think about it, there are more bad pitchers than elite ones, but we don’t think about just how important it is for the other starters to make their starts so these guys don’t have to.

As I mentioned when I first did this little exercise after the 2010 season:

Next time your team signs a pitcher with a 10 – 8 record and 3.99 ERA in 160 innings realize just what you are getting. One of the top 100 pitchers in the league.

The numbers are a little different now — now the average #3 is 10 – 9 with a 3.85 ERA in 158 innings — but the point remains the same: the average baseball fan vastly underrates pitcher performance.


What If: The St. Louis Cardinals Were Two Teams

Much has been made of the Cardinals’ amazing depth and seeming ability to pull All-Star-caliber players from their minor leagues at will.

In today’s FanGraphs After Dark chat with Paul Swydan I asked what place in the NL Central the Cardinals would finish in were they to be forced to field two separate (but equal) teams in 2014.

Swydan’s answer:

Probably third and fourth. They’re not THAT good.
Maybe even lower than that. It’s an interesting question.

Well, I too thought it was interesting and decided to try to find out.

I looked at the Oliver projections for the Cardinals and tried to divide them into equal teams. Then I did my best (well, my most efficient, it is 9 at night) to divide up playing time equally between both teams. STEAMER projections assume 600 PA’s for all position players so I prorated each player’s WAR projection for the number of PA’s that I estimated (I tried to stick to 600 PA’s for each position – too much work to do otherwise).

For pitchers I used Oliver’s projected number of starts for starters and innings pitched for relievers to make sure that both teams were equal. I didn’t do any prorating for pitchers. I wanted to, but that started to look like more work than I was willing to put in right now — and I was sort of worried that Paul would do his own post on this, so I wanted to beat him to the punch.

There weren’t quite enough players projected for the Cardinals so for the missing positions I just assumed a replacement-level player.

These were the teams and their projected WAR totals that I came up with.

null

null

So each team was at about 25 .5 WAR.

How about the rest of the NL Central?

For this I just looked at the STEAMER projections since they already adjust playing time and I didn’t want to have to do it for each team. This is what STEAMER had for the other NL Central teams:

Pirates 34.5 WAR
Reds 30.5 WAR
Brewers 27.6 WAR
Cubs 26.9 WAR

So, our Cardinals teams look like they’d finish just behind the rest of the NL Central, but it’s close enough that we can say that the Cardinals might literally be twice as good as the Cubs and Brewers.


What if: Prince Fielder Were an Everyday Shortstop?

I was recently involved in an online discussion of the Prince Fielder/Ian Kinsler trade and the signing of Jhonny Peralta by the St. Louis Cardinals. Someone stated that Peralta was no more than a utility infielder who could sometimes hit. I pointed out that, over the last three seasons, Peralta was actually a top-five SS. Someone else stated that Prince, were he to play SS, would also be a top-five SS. I thought that was ridiculous, but decided I’d try to look at it as objectively as possible.

Over the last three seasons, Fielder has 111 batting runs, -18 base running runs, 61 replacement runs and -10 fielding and -37 positional runs for 107 total runs.

If we assume that his batting, base running and overall playing time would stay the same, which is probably an optimistic assumption given the likely additional strain of playing SS instead of 1B, then we only need to adjust his positional and defensive runs.

The positional adjustment is the easiest to adjust. The adjustment for 1B is -12.5 runs per 1350 innings, the adjustment for SS is +7.5 runs per 1350 innings. Fielder’s -37 positional runs represent (-37/-12.5) 3.0 defensive seasons. Three defensive seasons at SS is worth (3 * 7.5) 23 runs.

At this point Fielder at SS is worth 111 batting runs+-18 base running runs+23 positional runs+61 replacement runs. That’s 167 runs all told. That’d make him, by far, the best SS in the league. Troy Tulowitzki has 114 runs.

But we still haven’t factored in Fielder’s defense compared to the average SS. I’m not really sure that we can.

Fielder has been about six runs worse than the average 1B each season of his career. But the average SS is a much better defensive player than the average 1B.

I think it’s safe to assume that Fielder would be the worst defensive SS in baseball.

Since 2002, the UZR era, the worst season by a SS (minimum 650 innings, about half a season) is Dee Gordon’s 2012 season in which UZR says he was worth -27 runs per 1350 innings.

That’s a somewhat amusing comparison. Dee Gordon is listed at 5’11” 160 lbs. Prince is listed at 5’11” 275 lbs. Those are listed weights and I think it’s entirely possible that Prince weighs twice as much as Gordon.

I’m going to go out on a limb as say that Prince would be a worse defensive SS than Gordon. I’d go so far as to say that he would be considerably worse. But how much is considerably?

UZR can be broken down into different components.
Range runs – attempts to measure a player’s range; how many balls he does/doesn’t get to compared to average.
Error runs – attempts to measure how many runs a player saves/costs his team by avoiding/making errors
Double play runs – attempts to measure how many runs a player saves/costs his team by turning/not turning double plays.

I’m going to assume that Fielder would be the worst at all three of the above. So, what would that look like for Fielder’s overall defensive worth at SS?

It’s worth noting here that most of Gordon’s poor UZR was due to making errors, his range and double plays were bad, but not historically bad. His errors were.

The worst SS in terms of double play runs (per 1350 innings) was, go figure, 2012 Dee Gordon at -5 runs per 1350 innings. If we say that Fielder was equally as bad as Gordon, I’ve little doubt he’d be much worse than Gordon, that’d be (3*-5)-15 runs over the 3 seasons.

The worst SS in terms of range runs was, not surprisingly, 2012 Derek Jeter at -17.5 runs per 1350 innings. Anyone think that Fielder has Jeter’s range? I don’t. But if we give Fielder three seasons as poor as Jeters’ 2012 that’s (3*-17.5) -53 runs for 3 seasons.

The worst SS in terms of error runs, bet you guessed that it, was 2012 Dee Gordon at -13 runs per 1350 innings. Again, I think that Dee’s footwork and hands around 2B would be much better than Fielder’s, but if we say that Fielder was as good as Gordon then he’d be worth (3*-13) -39 runs per the three seasons.

If we add all of that up (and remembering that this is-I believe-an optimistic look at Fielder’s possible performance at SS, we get Fielder being (-15-53-39) -107 runs worse than the average SS. Quite a bit worse than Gordon’s -27 runs

Let’s add that to his other performance from above:
111 batting runs, -18 base running runs, -107 fielding runs, 23 positional runs, 61 replacement runs = 71 total runs.

71 total runs between 2011 and 2013 would have put Fielder 12th among major league SS, between Hanley Ramirez (84 runs) and Marco Scutaro (70 runs), and worth about 2.5 WAR per season.

To emphasize again, I think these are the most ridiculously optimistic assumptions that I can present with a straight face. I think it much more likely that Fielder would be a -50 (per 1350 innings) or worse SS were he to play there everyday. Not to mention the additional strain on his body that would decrease his hitting, baserunning, and ability to play every day.