BatCast the Bat Flip Tracker: Oh, How the Wood Was Chucked

“Make baseball fun again” is Bryce Harpers outcry against baseball fundamentalists who continue to police emotions and enforce baseball’s expressionless professionalism.  “Shut up and play the game right” might be something you’d hear uttered from the fundamentalist’s side — ideally through tobacco-glazed teeth — and maybe by Brian McCannThe discourse is of course more involved than that, covering everything from retaliatory plunk balls to bat flips, and anytime something marginally inflammatory happens, it’s beaten so hard that we’re reminded how boring our lives are that we have to discuss the same things over and over and over.  I know you can picture the media package that accompanies the discourse: a young, brash, exquisitely coiffed, generational talent, who was hit in the ribs in his first ever plate appearance (then proceeded to steal home), is unabashedly passionate about a “fun” revolution in baseball.  His eye black is adorned like war paint; he has emojis on the bottom of his bats; his helmet never stays on his head when he runs the bases; and yes, he “pimps” his home runs.  Cut to Joey Bats‘ ALDS bat flip and the ensuing brawl and then connect it with Rougned Odor’s haymaker; cut to Brian McCann standing at home plate waiting for Jose Fernandez after his first career home run; then enter the commentator: “Is this wrong?”

While baseball’s moral code on gaining an edge is unpredictable, there’s always been the idea that individuals conform to the game, not the other way around.  Harper’s sermon won’t shatter the code of conduct, but it might move the needle, if it hasn’t already.  For example, I can’t think of a standout incident this season because of a bat flip.  That’s good! Because bat flips are really fun!  There’s really no need to overthink it.  There were plenty of memorable bat flips this year, and in an effort to make some fun out of baseball when there is no baseball being played, I’m breaking out my bat flip tracking equipment (a ruler, a stop watch, and a parabolic trajectory calculator) that I introduced last year, and booting up BatCast for a look back at the year’s most memorable wood-chucking moments.

A brief recap: arriving at these numbers is a sloppy and wildly imprecise affair.  I pull videos, gifs, and stills of a bat flip and start by measuring the height of the player as he appears on my screen.  I convert that measurement into the player’s real-life size and reference this ratio, as well as measurements on the baseball field, and rough estimates, to arrive at some of the data I present to you in meters and feet: initial height, apex, and distance.  Using a stopwatch or the time stamp on YouTube, I can declare a fairly accurate hang time of the bat.  Angles are roughly noted using the batter and the ground to form a 90-degree angle and are adjusted in the parabolic trajectory calculator.

Let’s kick this off:

Exhibit A – The one that’s probably at the forefront of your mind:

Asdrubal Cabrera

Date Inning Leverage Index ΔWE% Implication
09/22/16 11 4.42 82.5% 0.5 gm ld in WC

Statcast

Exit Velocity Launch Angle Distance
102 mph 28.50 393 ft

Le Flip

asdrubalbatflip092216

How about in slow motion?

092216_asdrubal_walkoff_slomo_med_m9up6w4p 

Ejaculatory!

How many of his teammates do you think saw that flip?  They may have seen the tail end of it, but I’m willing to bet zero saw the flip in its entirety because everyone in the dugout was gazing at the ball in flight.  But this was a no-doubter.  Edubray Ramos resigned to the outcome likely before the ball had reached its apex.  The Phillies weren’t playing for anything at this point, but the Mets?  Before this pitch, the Mets were tied with the Giants and Cardinals for the top wild-card spot.  Before this pitch, in the 9th inning, Jose Reyes erased a two-run deficit with a home run of his own, only to see that lead given up again when Jeurys Familia and Jim Henderson allowed two runs to score in the top of the 11th.  After this pitch, this game ended and they had a half-game lead on any team in the National League for the first wild-card spot.  That bat flip is a team effort.  There’s some “I did it” in there, but the way he looks towards the dugout and offers his bat up towards his teammates makes this feel like “We did it!”

The numbers:

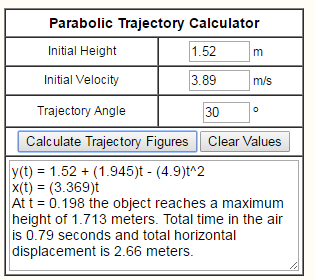
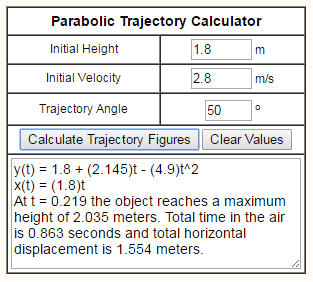
Cabrera is listed as 6′ tall.  On the freeze frame I measured, he’s 1.9″ tall.  So our key tells us that 1″ on the screen is 37.9″ in real life.  When he releases the bat, he does so from about shoulder height and we’ll call 5′ (1.52 m) in real life.  The acme is, it appears, not a great deal lower than the top of Asdrubal’s head, so we’ll tally that down at 5′-7″ (1.71 m).  To me, the launch angle looks to be right around 30 degrees, and we’ll refine this number once we get them in the parabolic trajectory calculator.  The duration of flight I’m using is the average number I’ve come up with through timing the video 10 times — 0.79 seconds.

Parabolic Trajectory Calculator:

ptraj

BatCast

Exit Velocity Launch Angle Acme Distance
8.7 mph 30 Deg 5’-7” 8’-9”

Exhibit B – A Man Possessed:

Matt Adams

Date Inning Leverage Index ΔWE% Implication
07/22/16 16th 1.71 42.7% 2nd straight walk-off for Cardinals

Statcast

Exit Velocity Launch Angle Distance
105.8 mph 28.34 444 ft

636048353090779282-gty-579171664-83514488_1469294083291_4281277_ver1-0

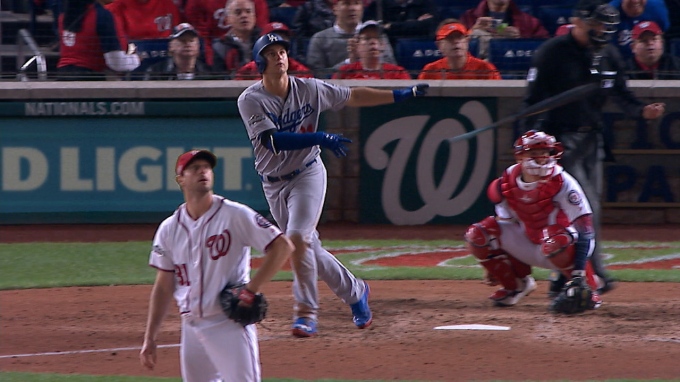
If this picture was part of an emotional intelligence quiz, I’m sure the answers given as to what facial expression is being displayed would vary greatly.  To accurately assess the information in this picture it may behoove one to understand that, in baseball, home teams wear white and that the man in the background is most likely a fan of the home team and that his hands are held high in jubilation.  If you’re only looking at the horrifying ogre in the foreground who appears to be screaming at 67 Hz+, the pitch only a dog can hear, you’d be hard-pressed to say that is a happy man.  In fact, he may not be happy yet — he’s likely evoking a form of relief, having just exorcised the demons one faces when up to bat in the 16th inning of a tie baseball game; he looks like pure adrenaline.  Most of us don’t get to experience a moment like this in our lifetime so we don’t have a really strong reference point for what he’s feeling, but luckily you know what this article is about and there’s a gif:

giphy

PUMP! PUMP! PUMP IT UP!

That’s all lizard brain right there.  It’s a little undignified, but that’s the beauty of it.  Matt Adams is a dense, hulking man, and that makes it a little scarier and a little sillier.  Look:

matt-adams-b809f422f7cc9370

Sassy.

The numbers:

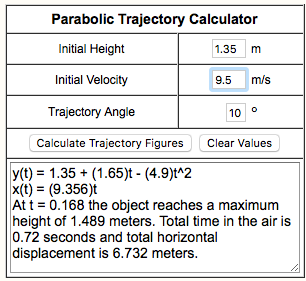
This one is especially hard to measure because of Adams’ primitive (yet graceful) movements.  I extracted these numbers using the still image and the video:

screen-shot-2016-11-28-at-10-04-38-pm

BatCast

Exit Velocity Launch Angle Acme Distance
20.6 mph 10 Deg 4’-11” 22’-1”

Exhibit C – Into the Batosphere

Yoenis Cespedes

Date Inning Leverage Index ΔWE% Implication
08/29/16 10th 1.23 47.0% The first baseball bat in outer space (for America – Korea has several).

Statcast

Exit Velocity Launch Angle Distance
101.9 mph 28.33 416 ft

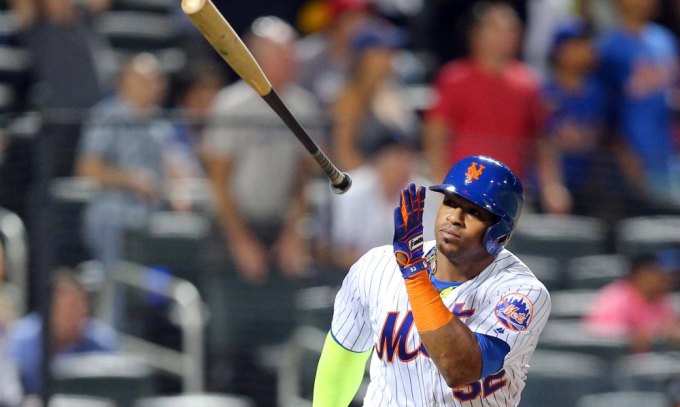
Yoenis Cespedes made it into my BatCast segment last year with his nifty flip in the NLDS.  This flip follows a similar trajectory but he varies his look this time with a cross-bodied toss.  It’s rude:

082916_cespedes_bat_toss_med_k3thrcyn (1).gif

“Hold my drink, bitch.”

While the lesson here is obvious, the mistake is not as easily avoided: get the fastball ball UP and in on Cespedes.

plot_h_profile

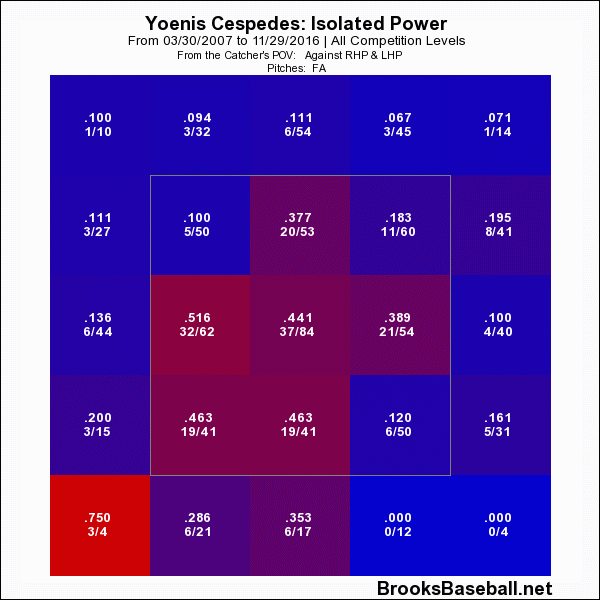
Because of the evidence we have, the numbers for this bat flip will be even more rough than the others — by the way, I hope you’re not a mathematician, and I apologize if you are.  The data we can gather is the launch angle and at what time stamp the bat reaches it’s highest point.  Here’s a better view of the angle:

USP MLB: MIAMI MARLINS AT NEW YORK METS S BBN USA NY

Can we agree on shoulder height for the initial launch height to make things easier?   Let’s call it 5′ since Cespedes is 5′-10″.  We’ll say the bat was launched at a 70-degree angle and in the gif the bat appears to reach it’s apex at just before 0.4 seconds.

BatCast

Exit Velocity Launch Angle Acme Distance
9.2 mph 70 deg 12’-6” 4’-11”

Exhibit D – The “I probably didn’t even need this bat to hit this home run” flip

Bryce Harper

Date Inning Leverage Index ΔWE% Implication
09/10/16 8th 3.63 30.5% Bryce’s helmet probably won’t fall off when he’s running the bases.
Statcast
Exit Velocity Launch Angle Distance
99.7 mph 26.39 377 ft

After my long-winded intro it’s fitting to get to feature Bryce Harper in this piece.  He probably didn’t have as much fun this year as he did in 2015, but he appears to have gotten some enjoyment out of this shot.
wp-1480462655679.gif

Correct me if I’m wrong, but I believe that is what the kids call “Swagadoscious.”  I’ll just get right to the point this time.

bharpflipp


BatCast

Exit Velocity Launch Angle Acme Distance
6.3 mph 50 deg 6’-8” 5’-1”

Those are the ones that stuck out to me as the best flips of the year and I hope you were able to move past the rough estimates and get some enjoyment out of that as well.  I should note that Joc Pederson’s bat flip in the NLDS is omitted because I cannot find substantial evidence of an acme or distance.  And while a lefty going across his body like he did is pretty exotic, the uncertainty he exudes, combined with his panicked sashay, makes this effort pretty uncool.

pedersonbattoss_echl1ngh_il9khrdi

(Scherzer looks super imposed here)

So what can we pretend to glean from this?  Based on WPA, it’s probably not surprising that Harper had the most disproportionate bat flip.  Looking at the Statcast data, Harper’s home run was also the “weakest” out of the group.  So I guess even if Bryce Harper says what he says just so he can get away with being a little douchey, he’s holding up his part of the deal.  Of course, bat flips aren’t what make baseball fun.  Baseball is fun because we can see so much of our own lives in the game — it’s the humanity.  It provokes endless curiosity and it will reward you if you know where to look.  It’s the only game that can end, not because of time, but with one swing, and flip, of the bat.

Don’t be afraid to clue me in to bat flips in the future — my Twitter handle is in my bio (below).


Hit Batters as Collateral Damage of Rising Strikeout Rates

In the past, I’ve written about batters being hit by pitches–specifically, how the rate of hit batters is near all-time highs yet it hasn’t generated much, if any, outcry. Here’s a chart of hit batters per game, from 1901 (the start of the two-league era) to 2014:

HBP per game, 2001-2014

There were 0.68 hit batters per game in 2014, the eleventh-highest total over 115 years of two-league play. The top ten years, in order, have a 21st century slant: 2001, 2004, 2003, 2006, 1901, 2005, 2007, 2002, 2008, 1911.

Or, pretty much the same chart, here’s hit batters per 100 plate appearances:

HBP per 100 PA

There were 0.898 batters hit per 100 plate appearances in 2014, the tenth highest amount in the two-league era. The ten top years are, in order, 2001, 2003, 2004, 1901, 2006, 2005, 2002, 2007, 1911, and 2014.

Commenter jaysfan suggested that the modern emphasis on going deep into counts has changed the number of pitches thrown per game, so perhaps hit batters per pitch haven’t changed much. It turns out the pattern still holds. Here’s a graph of hit by pitch per 100 pitches, using actual pitch counts from FanGraphs for 2002 to present, and Tom Tango’s formula of Pitches = 3.3 x plate appearances + 1.5 x strikeouts + 2.2 x walks for the preceding years:

HBP per 100 pitches

With 0.234 hit batters per 100 pitches, 2014 ranks 16th all time, behind 1901-1905, 1908, 1910, 1911, and every year from 2001 to 2007. Again, a pronounced millennial bias. (Source for all the above graphs: Baseball Reference and FanGraphs)

It’s clear, then, that we’re seeing batters getting hit at the highest rate in a century. I tried to figure out why, and came up dry. Left-handed batters, who face a wider strike zone than righties, aren’t leaning across the plate and thereby getting hit at a proportionately higher rate. HBPs are not inversely correlated to power, with pitchers more willing to pitch inside now to hitters who less frequently pull inside pitches down the line and over the fence. College graduates are slightly more likely to get hit by pitches than other hitters, but not enough to explain the change. Batters setting up deeper in the batter’s box, as measured by catcher’s interference calls, isn’t correlated to HBPs.

However, commenter Peter Jensen noted, “I don’t think there is any question that pitchers throw more to the edges of the strike zone when they are ahead in the count. This could be confirmed with a pretty simple Pitch Fx study. And if they pitch to the edge more they are also going to miss inside more (and outside more) so this could partially or even wholly account for why there are more HBPs in pitcher counts.”

I did the PITCHf/x study Peter suggested. Using Baseball Savant data, I looked at hit by pitch by count, and as Peter found when he studied the data from 1997 and 2013, HBPs occur more when pitchers are ahead on the count. Here are the data from 2014:

2014 HBP

When the pitcher was ahead on the count, the batter was nearly three times as likely to get hit as when the batter was ahead. The most common counts for hit batters: 1-2, 0-2, and 2-2, and 0-1, all counts that encouraged pitchers to try to get batters to chase pitches on the border of the strike zone. Is this trend consistent? Baseball Savant’s data go back only to 2008, but using that season’s data, yes, the trend’s unchanged:

2008 HBP

Same thing. Batters are three times more likely to get hit when the pitcher’s ahead on the count, and the three most common HBP counts are two strikes with zero, one, or two balls, followed by 0-1.

So why the increase in hit batters? It appears that, as Peter implied, it’s because of the increase in strikeouts. Every three strike count requires a two strike count, obviously. In 2008, 22% of at bats went to 0-2 counts, 34% went to 1-2, and 29% went to 2-2. In 2014, those percentages had risen to 25%, 36%, and 30%, respectively, in line with the increase in strikeouts from 17.5% of plate appearances to 20.4%. The route to three strikes, which is being traveled more frequently, includes the four counts most likely to result in a hit batter. That’s why we’re seeing batters hit by pitches at rates not seen since before the first World War.

Here’s a graphical representation. In 2014, the Pirates led the majors in hit batters, handily, with 88. Here’s where Pirates pitchers threw on the hitters’ counts of 1-0. 2-0, 3-0, and 3-1:

Those greenish-yellow areas in the middle of the zone indicate that when the pitchers fell behind, they tended to locate their pitches in the strike zone. By contrast, check out the location for pitches thrown on 0-1, 0-2, 1-2, and 2-2 counts, when the pitcher could waste a pitch trying to get the batter to chase it:

That’s a much less concentrated blob, with a higher percentage of pitches outside the strike zone, where the batter can get hit.

As a final check, I ran a correlation between strikeouts per plate appearance and hit batters per plate appearance post-World War II. The correlation coefficient’s 0.82. That’s pretty high, suggesting a link between strikeouts and batters getting hit. Granted, correlation is not causation. But given that there’s an empirical link–to get to three strikes, you have to get to two, and batters with two strikes are at the highest risk of getting hit by a pitch–it’s enough to make me believe that while there are a lot of reasons more batters are getting hit by pitches, a major explanation is that hit batters are a consequence of rising strikeout rates.

CODA: If there were a day last season that I thought might’ve turned to tide on batters getting hit by pitch, it was Thursday, September 11. That day, there were 15 HBPs in 11 games. That doesn’t include the horrific fastball to the face that ended Giancarlo Stanton’s season; that pitch was a strike. A lot of stars got hit: Stanton, Mike Trout (twice), Yoenis CespedesCarlos Gomez, Jayson Werth. Tampa Bay’s Brad Boxberger hit Derek Jeter in the elbow. Had that pitch ended Jeter’s farewell tour, I really think it would’ve created an issue of rising HBP rates. Fortunately for Jeter and purveyors of Jeter memorabilia, it didn’t. But taking the 15 hit batters together, plus Stanton, and excluding two obvious retaliation jobs (Anthony DeSclafani hitting Gomez after Stanton got hit, Joe Smith hitting Tomas Telis after Trout got hit a second time), the fourteen hit batsmen occurred on six 0-1 counts (including Stanton and Jeter), three 1-2 counts, two 1-1 counts, and one count each of 0-0, 2-1, and 2-2. There was only one HBP with the batter ahead on the count, and ten occurred on the four counts identified here as the most dangerous for batters.


The A’s Declining Offense

Take a turn around Twitter or any major baseball news source and you’ll hear a familiar echo about the former best team in baseball; the offense hasn’t been the same since the deadline.  When the A’s traded away Yoenis Cespedes for Jon Lester, the impact to the lineup was noticeable.  They wagered they could get the same level of production out of some combination of Jonny Gomes, Stephen Vogt, and Sam Fuld.  In the first half of the season, the A’s were a top-six team in wOBA, OBP,and wRC+ all while being second to last in BABIP.  It’s safe to say they were rolling. Now they aren’t.  Since the deadline, the A’s have become a bottom-third team in all the aforementioned stats.  It’s easy to look at these stats and say that Cespedes was clearly the catalyst of something in the offense.

While much has been written about the rumors of Oakland emphasizing clubhouse chemistry the last couple years, Cespedes has never really been written as one of the chief leaders in that category.  We typically hear names like Coco Crisp, Scott Sizemore, the aforementioned Jonny Gomes, and Sean Doolittle mentioned there.  Cespedes by all accounts was just a crazy athletic guy who didn’t really cause any trouble, but wasn’t exactly a team leader.  Yet the fact remains: the A’s have refused to hit since the deadline. Sure, 17 games isn’t a gigantic sample size, but it’s pretty reasonable when evaluating team performance.  Baseball Prospectus just three years ago theorized that a reasonable prediction could be made of a team’s overall season after fifteen games,  so we’ve got something substantial to work with.  Is there another pattern, though?  Let’s take a look at the team’s month by month performance.

A’s wOBA wRC+ OFF WAR
April 0.339 119 25.2 7.3
May 0.330 113 15.6 5.8
June 0.314 102 2.6 4.1
July 0.312 100 0.2 3.4
August 0.288 84 -11.1 1.5

We see a steady decline here in the A’s performance, not a sudden jump.  The A’s started off really hot, leading the league in most offensive categories in April.  A notable decline can even be seen in May, as the A’s began their meteoric rise to the top, though they held steady in the top three in most categories.  In June, the team dipped even further, down to a mark that was only slightly above average.  They looked to be leveling off there to a rather league-average team in July, which wasn’t encouraging, but maybe suggested a possible rise back up to looking like a playoff team. In August, though, the wheels have come off.  The A’s have dipped below league average in most categories, and their win totals have suffered as well.  Can we blame all of this on Cespedes?  Let’s take a look at some wOBA numbers for chief contributors to the Oakland offense:

It’s a bit cluttered, but the dark blue line in the middle labeled wOBA is the team as a whole; see the steady decline as we’ve noted.  In April, we see all of these guys hovering between a .300 wOBA and somewhere above .420.  Nearly all of them are now either .300 or far below it; the one exception being Josh Donaldson, who has picked it up again since a dismal June.  Even Cespedes, having been traded to the Red Sox, is having an unremarkable August since performing poorly in July.  Let’s take a look at a wRC+ graph, with some of the members removed for clarity:

Here we see six players who routinely batted in the top five in the batting order having horrible Augusts.  Stephen Vogt and Brandon Moss, two lefty platoon bats being pressed into full-time duty in the outfield lately, lead this group with a 91 wRC+, which is below the average line.  John Jaso, Coco Crisp, and Derek Norris have been downright horrible, with wRC+’s in the barely digestible territory. So yes, the A’s have been bad since Cespedes has left the team.  It’s clearly not just the loss of his bat; the vast majority of the team, outside of Josh Donaldson and the surprisingly resurgent Eric Sogard and Josh Reddick, have been really, really bad.

So if the whole team is flailing, perhaps Cespedes was more of a sparkplug than we previously had attributed?  More importantly, did Billy Beane fail to see a trend here?  The A’s were trending downwards in hitting as demonstrated, so why the need for pitching?  Well, the A’s were unfortunately not exactly trending very well in pitching either.  They were third in pitcher WAR through April, but then plummeted to 19th in May, and further dipped to 21st in June before rising a bit to 17th in July. The A’s were a decidedly middle of the road team when it came to pitcher WAR, and FIP seems to agree, ranking them about the same spot everywhere.

So why make the trade?  If anything, this trade has only served to confuse fans.  What do we make of a team with three above-average catchers who all tank right after a trade for a top-flight starting pitcher?  While all the fans are clamoring for Jimmy Rollins to come and help the middle infield, we’ve got Eric Sogard being one of the few bright spots in the offense, and nobody seems to care. All we know is that the A’s are in trouble.  Whether it’s because Cespedes was the glue or because the A’s are peaking at the wrong time, they’re all of a sudden facing down the dire straits of a one-game coin flip at the end of the season, despite being the most aggressive pursuer at the trade deadline. The A’s can cling to a few bastions of hope; maybe their BABIP dropping all the way to .260 in August shows that they’re just a bit unlucky.  It’s either that or face the fact that sometimes the best-laid plans of mice and men fail, and pray that Jason Hammel doesn’t have to start the Wild Card game.


Analyzing Yoenis Cespedes

Yoenis Cespedes struggled at the plate this year for reasons unknown to most. Analyzing why he struggled in 2013 versus why he was deemed excellent in 2012 all comes down to sabermetrics. Cespedes’ biggest enemy was actually… himself. Through research and statistics, Cespedes swings at too many inside pitches in an attempt to hit more home runs. The pressure from his overshadowed rookie season may have come back to haunt him this past year. His batting average dropped from .292 to .240 and his OPS fell from .861 to .737 all because of a few changes Cespedes made at the plate. The statistics easily point out the causes for Cespedes’ struggles and how he might be able to fix them for next season. Even though it may seem that Cespedes was a much worse batter in 2013, that is not the entire case. He actually was much better at making contact with pitches thrown to the outside of the strike zone, boasting an increase from 59.5 % to 63.7 %.


   1.  Swinging at Inside Pitches Too Often & Taking Too Many Strikes
Cespedes took a swing at way too many pitches inside the strike zone this season. A number that increased from 65.3 % to 71.8 % from 2012 to 2013. In comparison, when Adrian Beltre took a swing at 71.6 % of inside pitches in 2005, he hit .255 with just a .716 OPS. In addition, when swinging at such a high amount of inside pitches, Cespedes’ hit a lower percentage of them as well — going from 84.0 % in 2012 to 80.4 % in 2013. As a result of his tendency to swing more often at inside pitches, he saw an increase of strikes by 2.5 % (1233 of 1979 in 2012 to 1407 of 2169 in 2013). More strikes lead to more strikeouts and a lower batting average. His strikeout rate increased from 18.9 % to 23.9 % just over the course of a single season.

Swinging at the amount of inside pitches that he did, power pitchers took full advantage of his swing, resulting in a .196 batting average. Against finesse pitchers, Cespedes averaged a .263 batting average. (power pitchers are defined as the top third of pitchers when combining the amount of strikeouts and walks. finesse pitchers are defined as the bottom third) When Cespedes fell behind in the count, he proved to be an easy out; with two strikes and any amount of balls, he batted a horrifying .130. Also, Cespedes is often too eager to swing at the first pitch of a plate appearance when he does not have a trace on the pitcher’s style or location. Swinging at the first pitch resulted in a .209 batting average whilst taking the first pitch resulted in a .252 batting average.

Picture

2.  Pulling Too Hard for Home Runs
Cespedes certainly tried to hit as many home runs as possible this season; he did pass the previous year’s number of 23 by three and his power assuredly grew. As evidenced by his spectacle at the home run derby, Cespedes possesses a strength like few others in the MLB. However, he often tried too hard to get the ball over the wall, resulting in an increase in fly ball rate from 39.9 % in 2012 to 45.6 % in 2013. The pressure to improve from critics and fans alike might have pushed Cespedes into trying to hit more home runs than he possibly could. Given his time on the DL due to nagging hand injuries, it surprised most that he even hit this many home runs — either because of lost time or wrist pain.


                    Picture

                                                             The power is definitely still there

 3.  BABIP (Batting Average on Balls In Play)
Cespedes was also just plain unlucky in 2013. BABIP measures the percent of batted balls that end up as hits — either because of defense, luck, or positioning. Basically two-thirds uncontrollable to the batter and one-third placement of the bat. Cespedes ended the 2013 season with a .274 BABIP; whereas the standard and league average nowadays hovers around .300. In 2012, he finished with a .326 BABIP — a lot luckier than this past year. The second reason (pulling for home runs) most likely factors a moderate amount into the regression too. Unfortunately, the causes of BABIP can disguise a player’s true skill level behind solid defense, timing, and bad luck.

The real Yoenis Cespedes is most likely somewhere in between his two major-league seasons but much closer to his rookie season than 2013. Yoenis Cespedes thrived in the spotlight but collapsed under pressure in 2013. His statistics in the 2013 playoffs alone describe his love of the spotlight (.381/.409/.667). Not only does he play well in the playoffs, but he also crushed everyone else in the home run derby this year. Expect Cespedes to be a big bounce-back candidate in 2014 after he can look at why he struggled at the plate. Upon arriving in America from Cuba as a free agent, Cespedes was hailed as a five-tool player and “arguably the best all-around player to come out of Cuba in a generation.” Don’t give up hope on the Athletics’ outfielder just yet.

For more articles like this, visit my baseball analysis and news website: The Wild Pitch

All statistics courtesy of baseball-reference and FanGraphs:
http://www.baseball-reference.com/players/c/cespeyo01.shtml
http://www.fangraphs.com/statss.aspx?playerid=13110&position=OF