Archive for troy tulowitzki

MLB Dream Team: Active Players Bound for the Hall of Fame, Part II

In a continuation of my article from yesterday, here is part two of the MLB Dream Team. This article will showcase spots six through nine in the batting order as well as the starting pitcher.

Enjoy!

Batting sixth and playing second base…

Robinson Cano

64.4 career WAR / 50.3 7yr-peak WAR / 57.4 JAWS

Average HOF 2B:

69.4 career WAR / 44.5 7yr-peak WAR / 56.9 JAWS

9th in JAWS out of 20 Hall of Fame Second basemen

Accolades: 8x All-Star, 2x Gold Glove, 5x Silver Slugger, World Series Champion (2009)

For many years, Robinson Cano has been in the conversation as the best second baseman in baseball.

He was an integral part of the New York Yankees 2009 championship squad, and he parlayed his five All-Star appearances with the Bronx Bombers into a 10-year, $240-million contract with the Mariners in 2014. Cano hasn’t lost his luster since leaving New York for Seattle, and he has made three All-Star Games (so far) with the Mariners.

Cano had to beat out Chase Utley and Dustin Pedroia — two likely Hall of Famers in their own right — to earn his position at the keystone sack in this lineup. Ultimately, Cano received the nod because of his sustained excellence. He has played at least 156 games every year since 2007, a level of health that neither Pedroia nor Utley can match.

Cano has also redefined the second-base position because of his ability to hit for average and power. Among Hall of Fame second basemen, Cano’s average of 25 home runs per season ranks second and his 296 career home runs ranks third. In a few years Cano should hold the record for career long balls by a second baseman, and he should be known as the greatest power hitting second baseman of all time.

Batting seventh and playing center field…

Carlos Beltran

70.3 career WAR / 44.3 7yr-peak WAR / 57.3 JAWS

Average HOF CF:

71.2 career WAR / 44.6 7yr-peak WAR / 57.9 JAWS

8th in JAWS out of 19 Hall of Fame Center Fielders

Accolades: Rookie of the Year (1999), 9x All-Star, 3x Gold Glove, 2x Silver Slugger

Carlos Beltran, always a reliable asset, is now in his 20th season. Beltran has been every archetype an athlete can be: young star (Royals); decisive deadline acquisition (Astros); hero (Mets); scapegoat (Mets again); veteran contributor (Giants, Cardinals, Yankees, Rangers); and experienced old-timer (Astros again). Beltran was the fifth-youngest in the majors when he debuted in 1998, and now he’s the third-oldest player in the league.

Beltran came into the majors as a 21-year-old kid for the Kansas City Royals, and immediately showcased his skills by taking home Rookie of the Year honors.

After seven years in Kansas City, Beltran signed with the New York Mets in 2005. It was in New York that Beltran would spend the prime of his career, making five All-Star appearances and taking home three Gold Gloves. Beltran proved to be one of the best players in the Major Leagues from 2006 to 2008, crushing 37 homers, driving in 124 runs, and scoring 123 (per 162 games).

Beltran has aged well, making All-Star teams as members of the Giants, Cardinals, and Yankees since leaving the Mets in 2011. However, the 40-year-old has shown signs of decline this year, and he may decide to hang up his spikes in the near future. Beltran left a lasting impression on the game of baseball, and his 20 years of service deserve a place in Cooperstown.

Batting eighth and catching…

Joe Mauer

51.4 career WAR / 38.5 7yr-peak WAR / 45.0 JAWS

Average HOF C:

53.4 career WAR / 34.4 7yr-peak WAR / 43.9 JAWS

8th in JAWS out of 15 Hall of Fame Catchers

Accolades: MVP (2009), 6x All-Star, 3x Gold Glove, 5x Silver Slugger

Even though Joe Mauer has not caught a game since 2013, he spent 10 seasons and 920 games behind the dish.

Mauer was truly one of the finest offensive backstops ever, and in 2009 he became only the second catcher since 1980 to win MVP (Ivan Rodriguez was the first in 1999). In Mauer’s MVP season, he led the majors in batting average (.365) and on-base percentage (.444), both of which were records for catchers. He also led the AL in slugging (.587), OPS (1.031) and Offensive WAR (7.6). In addition to his MVP, Mauer was the first AL catcher to win the batting title and he holds the record for most batting titles by a catcher, with three.

As well as being one of the league’s finest hitters, Mauer was a force to be reckoned with behind the plate. His great instincts and fielding prowess earned him three straight Gold Gloves from 2008 to 2010, and his 99.51% career fielding percentage ranks seventh all-time among catchers.

Although Mauer’s body has declined over the years, he has performed well since being moved to first base in 2014, and has not made an error this year in 69 games.

Mauer will leave a legacy as one of the greatest hitting catchers ever, and he has earned his place in the Hall of Fame.

Batting ninth at shortstop…

Troy Tulowitzki

44.0 career WAR / 40.0 7yr-peak WAR / 42.0 JAWS

Average HOF SS:

66.7 career WAR / 42.8 7yr-peak WAR / 54.8 JAWS

26th in JAWS out of 21 Hall of Fame Shortstops

Accolades: 5x All-Star, 2x Gold Glove, 2x Silver Slugger

This is the hardest decision on the roster, because in my opinion there aren’t any Hall-of-Fame-worthy shortstops in the majors right now. Alex Rodriguez and Derek Jeter, the two best shortstops of this generation, have retired in the past two years.

I ended up choosing Troy Tulowitzki because he has the best chance of any shortstop in the majors to make it to the Hall.

There were a few ways I could have gone with this pick. At first I considered moving Chase Utley to short, and then I looked at the plethora of up-and-coming shortstops (Carlos Correa, Corey Seager, Francisco Lindor; to name a few).

Ultimately, I chose Tulowitzki — but this would have been a much easier decision if Tulo had stayed healthy during his career. During his prime years with the Rockies between 2007 and 2014, Tulowitzki averaged a respectable 4.8 WAR per season. However, he missed an average of 45 games per year (!) during that period. If you extrapolate his numbers to 154 games (meaning he would miss 8 games per year), he would have recorded 6.7 WAR per season, boosting his JAWS from 42.0 to 50.0.

Although Tulowitzki didn’t stay healthy most of the time, his impact while he was on the field was undoubted, and he deserves Hall of Fame consideration.

And your starting pitcher for tonight…

Clayton Kershaw

58.8 career WAR / 48.7 7yr-peak WAR / 53.8 JAWS

Average HOF P:

73.9 career WAR / 50.3 7yr-peak WAR / 62.1 JAWS

60th in JAWS out of 62 Hall of Fame Pitchers

Accolades: Pitching Triple Crown (2011), MVP (2014), 3x Cy Young (2011, 2013, 2014), 7x All-Star, 1x Gold Glove

Clayton Kershaw, in my opinion, is the best pitcher in the game right now. He has been terrorizing opposing hitters since coming up as a 20-year-old with the Dodgers in 2008.

Kershaw achieved the Pitching Triple Crown in 2011, when he led the league in ERA, wins, and strikeouts. In 2014, Kershaw joined Roger Clemens and Sandy Koufax as just the third player in baseball history to win three Cy Young awards and an MVP.

Kershaw has finished as an All-Star and a top-five Cy Young award finisher in each of the past six seasons, a nearly unparalleled run of dominance, and he has already attained a career’s worth of honors at just 29 years old.

Supposing Kershaw retires at age 37, he has eight years remaining in his career. If we extrapolate his season average of 5.7 WAR to seven more years, then his current WAR of 57.0 jumps to 102.6, which places him as the ninth best pitcher of all time, a very fair assessment.

Kershaw has the lowest career ERA of any starter since 1920* (2.35), and he deserves a plaque in Cooperstown.

*Baseball-Reference defines a starting pitcher as a player whose starts make up 60% of their appearances. Minimum of 50 Innings Pitched.

Special thanks to baseball-reference.com for all of these helpful stats. I could not have written this article without them.
The Tulowitzki Hypothesis

The hypothesis: Troy Tulowitzki has a longer reaction time to pitches than he used to.  Reaction time, in this sense, refers to the overall time it takes Tulo to decide to swing and then execute the swing.  Perhaps he is only getting slower mentally, perhaps only physically, perhaps a mix of both. Regardless the source of his decline, my hypothesis is that Tulo has been slower to react since the beginning of 2015 than he has over the rest of his career. I posit that Tulo’s decline and the league’s increase in velocity have caused him to pass a “tipping point,” which has kneecapped his production.

Now for the evidence.

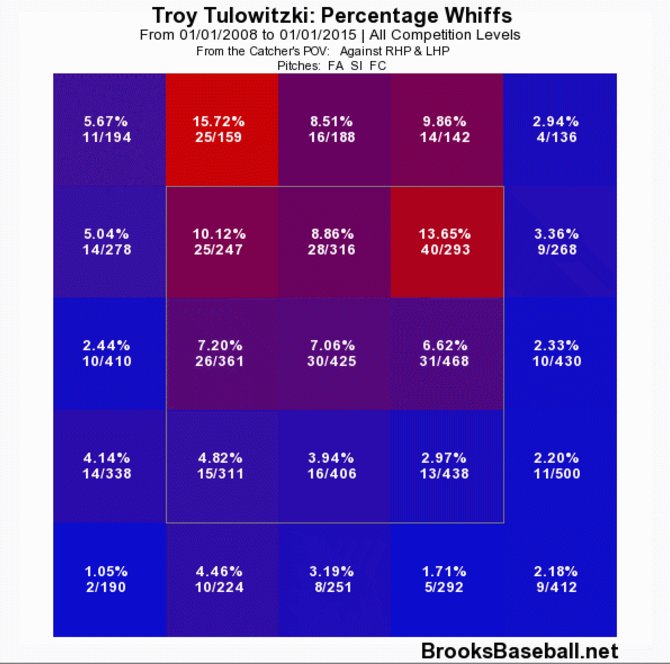
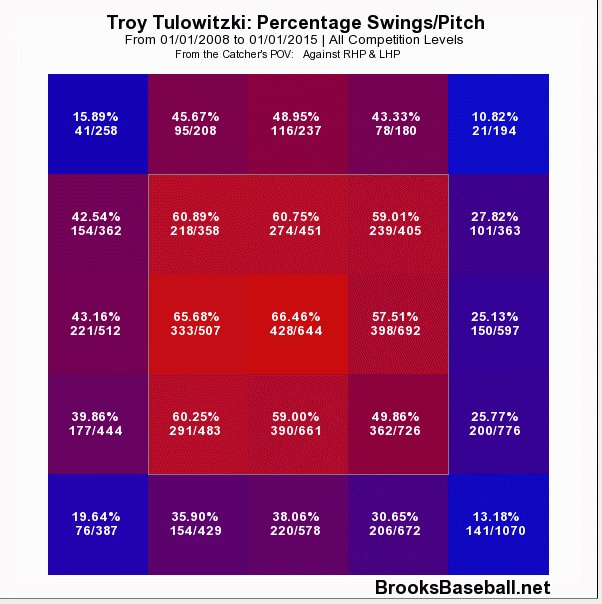
Here is a profile of Tulo’s swing rates from Brooks Baseball.  The data are from 2008-2014, before his decline.

swing per pitch

Figure 1. Swings/pitch 2008 to 2014.

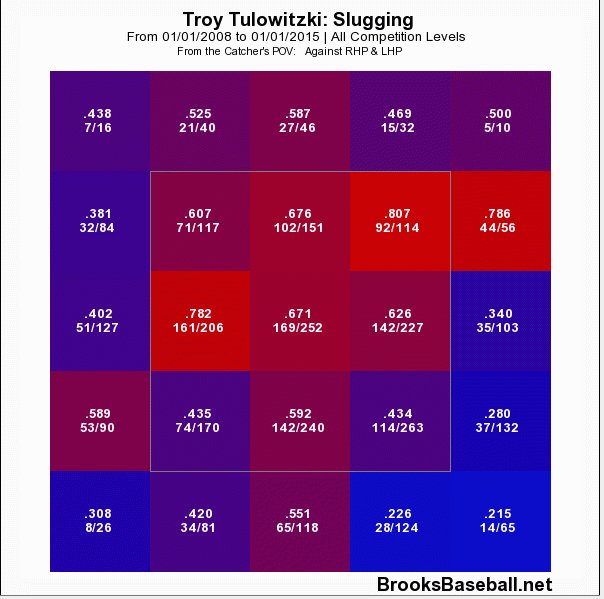
Throughout his career, Tulo has preferred to swing at pitches middle in and up in the zone.  Now consider where he did his damage.

slg pitch
Figure 2. Slugging on contact 2008 to 2014.

Again, Tulo seemed to prefer the ball up.  He was most dangerous in the top two thirds of the zone and he could cover the entire width of the plate.

Location is important because the reaction time required to hit a pitch changes depending on where it is located in the zone.  A pitch gains velocity as it moves up in the zone, or as it moves toward the hitter, while pitches are effectively slower as they move down and away. Historically, Tulo has been most dangerous on pitches in the areas of the zone that require the shortest reaction times to hit.

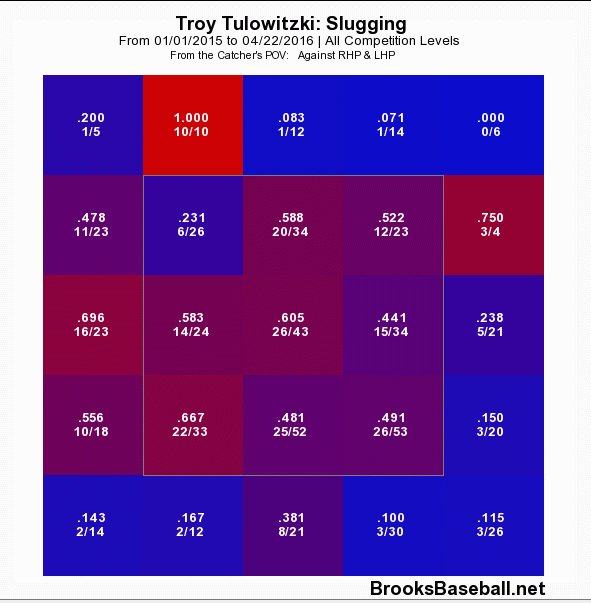
Now consider how productive he’s been since the beginning of 2015.

slg now
Figure 3. Slugging on contact 2015 to present.

Aside from the overall decline in the production in nearly all zones, it is noteworthy that Tulo’s most productive area has shifted from the top to the bottom of the zone.  From 2008 to 2014, Tulo’s production was highest in the top third, second-highest in the middle, and lowest in the bottom third.  That pattern has flipped, as now he’s most productive at the bottom of the zone and least productive at the top.

While these data are consistent with my reaction-time hypothesis, it’s also possible that Tulo has changed his approach to favour pitches down in the zone.

So let’s dig deeper.

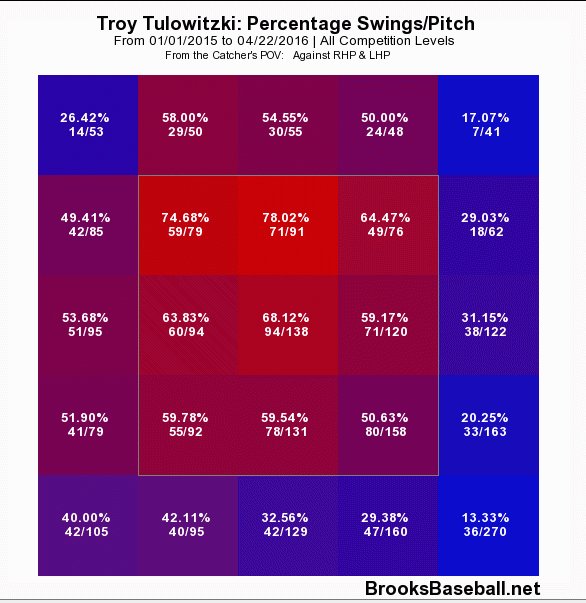
Here is a profile of Tulo’s swing rates in the past year.

swing now
Figure 4. Swing/pitch 2015 to present.

If anything, Tulo has doubled down on his up and in approach, swinging at 75% – 78% of pitches up or up and in.  Tulo is swinging much more often at high pitches, and slightly less often at low pitches.  It doesn’t appear that he switched his approach to attack the bottom of the zone.

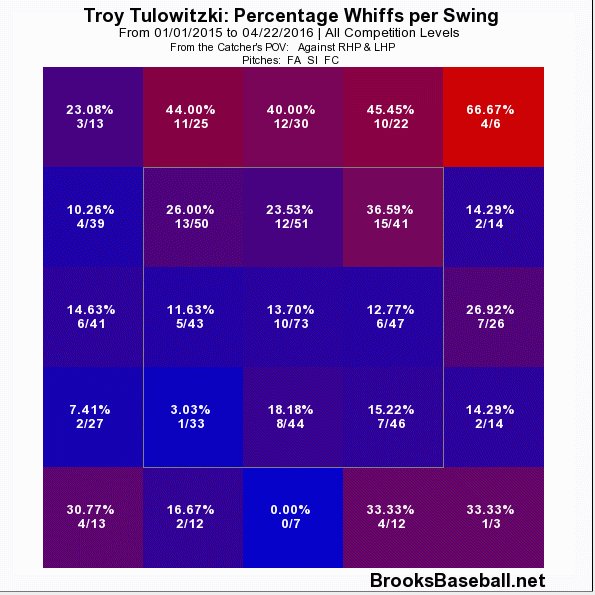
Let’s focus specifically on Tulo’s ability to make contact with the hard stuff. The two figures below show Tulo’s whiff-per-swing rates against all fastballs, the first from 2008 to 2014, the second from 2015 to present.

whiffs then
Figure 5. Whiffs/swing, 2008 to 2014.

whiffs now
Figure 6. Whiffs/swing 2015 to present.

Tulo has basically lost the ability to handle high fastballs. Historically a high-fastball killer, now Tulo can’t seem to catch up.  He swings and misses more than twice as often on fastballs in all three locations at the top of the zone. Let me spell it out: Tulo whiffs 2.57 times more often up and in, 2.77 times more middle-up, and 2.68 times more often up and away. And it gets much worse when you consider up out of the zone: He’s swung and missed 4.6 times more often at pitches on the outer third and just up out of the zone. Yikes.

While consistent with my hypothesis, swinging through high fastballs isn’t the only deficiency I’d expect if a hitter has lost some reaction-time skill.  Pitch recognition and plate discipline are also affected by a hitter’s reaction ability.

Discipline depends on a hitter’s ability to decide quickly whether a pitch is a strike or a ball. Tulo set a career high last year with an O-Swing% of 30.6%, three full points above his previous high in a season of 27.6%.  Tulo is chasing pitches outside the zone more than ever before.

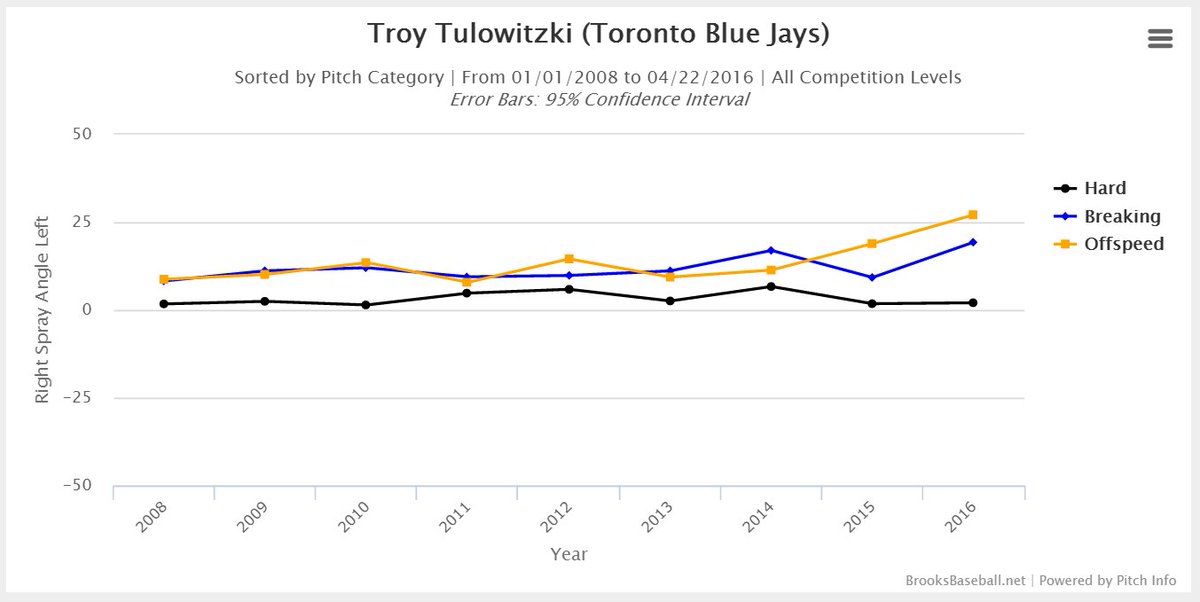
Pitch recognition depends on a hitter’s ability to recognize pitch type in time to adjust his swing. Here is a chart of Tulo’s average spray angle as a function of pitch type.  Spray angle indicates the direction (left field to right field) that balls are hit on average.  Thus, the more positive the average spray angle the greater the tendency to pull that pitch type.  As you can see, Tulo has historically hit breaking balls and off speed pitches with the same spray angle, suggesting that he was able to recognize and wait back equally well for both pitch types.

spray angle
Figure 7. Average spray angle by pitch type, 2008 to present (short seasons in ’12, 14, and ’16).

In 2015 and onward, Tulo has been pulling offspeed pitches much more than breaking balls. The result (which I won’t bother to show you graphically), has been an abundance of roll-over ground balls against offspeed pitches.

Breaking balls are easier to recognize out of a pitcher’s hand than offspeed pitches. So while Tulo is still able to use the earliest information to make an adjustment, he seems unable to make use of later trajectory and spin information that would allow him to recognize and adjust to offspeed pitches.

Maybe this is because his response speed to the later information has slowed, or maybe it’s because Tulo is committing to his swing too early to make the adjustment.  I would guess the latter.

So in summary, the reaction-time hypothesis is supported by evidence suggesting Tulo is most vulnerable when the required reaction time is shortest, he is less able to recognize pitch location in time to lay off, and he is no longer able to adjust to offspeed pitches as well as breaking balls.

A POSSIBLE SOLUTION

I’m a Jays fan and a Tulo fan so I won’t be ending this post with a “Tulo’s washed up” conclusion.  I watch this guy almost every day.  He’s still got the athleticism, the power, the hand-eye, and the swing. That said, the data have me convinced that he needs to make an adjustment.  The first thing I’d try is almost embarrassing to suggest, but I’ll suggest it anyway.  Tulo should swing a lighter bat.

Hear me out. Tulo just turned over the wrong side of the aging curve – especially for a shortstop – and meanwhile the league is throwing faster than ever.  He used to have success with an approach that requires superhuman abilities, and now that he is slightly less superhuman, that approach isn’t working.  Perhaps changing the swing weight of his bat, shaving off an ounce, could allow him to catch up to the pitches he’s not getting to and return him to some semblance of his previous form.

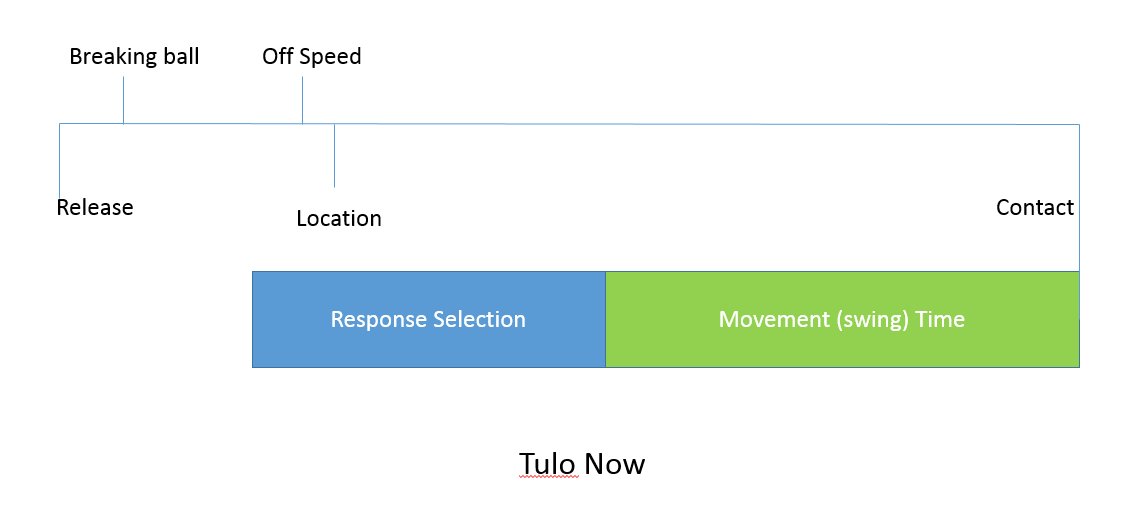
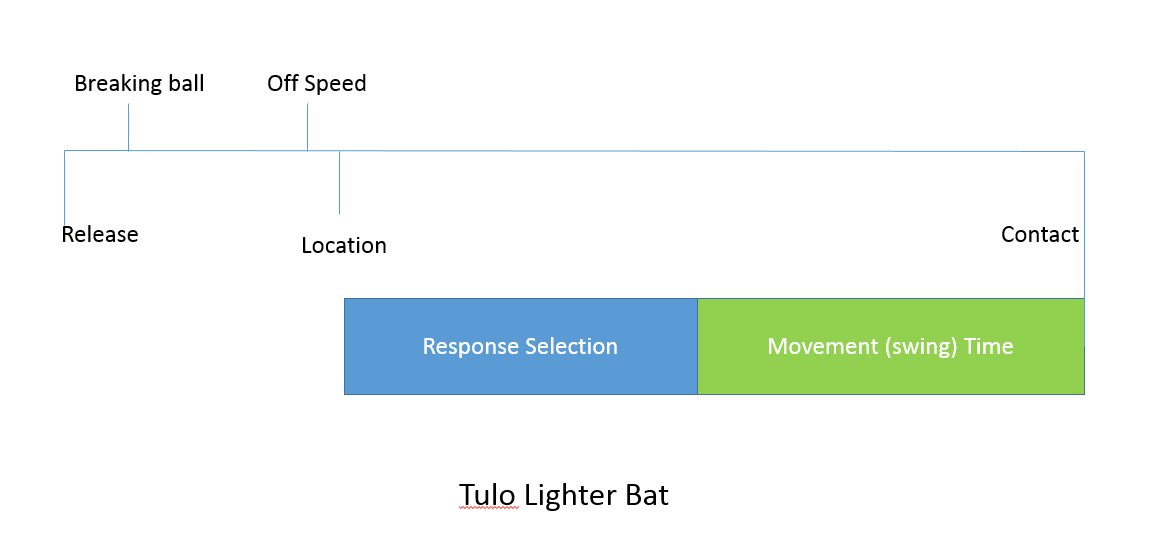
Take a look at the two schematics below (conceptual, not to scale). The full line from Release to Contact represents the timeline of the pitch.  The lines for “Breaking ball,” “Offspeed,” and “Location,” represent the moments when the hitter finally has enough information to process these respective features of the pitch.  Hitters recognize pitch type before location and breaking balls before changeups.  The coloured bars represent the time required to execute the cognitive and physical aspects of the swing.  The decision to swing must be completed by the beginning of the blue bar (response selection), in order for the brain to have enough time to make the necessary commands (response selection) and execute the swing (movement time).

My hypothesis suggests that the length of one or both of the coloured bars has increased for Tulo, while the length of the entire timeline has shortened for him (and everyone else).  I propose that both factors have pushed the blue bar to the wrong side of the deadlines for offspeed and location, causing Tulo to swing at more balls and fail to recognize changeups in time to adjust. The longer reaction time leaves Tulo vulnerable against hard stuff up and in, yet that’s exactly where Tulo made his money throughout the rest of his career. The “Tulo Now” schematic represents things since 2015, while the “Tulo Lighter Bat” figure depicts my proposed solution.

tulo now

tulo light bat

I’m not sure if anything can be done about a longer response selection time, but my hope is that a lighter bat could reduce Tulo’s movement time enough to get him back to the right side of those offspeed and location deadlines.  If Tulo can’t shorten his overall response time, he’s not going to be able to approach the game the same way he has for the rest of his career.  He’ll need to start looking down, looking away, and spitting on high fastballs.  Basically, he’d need to give up on what made him great.

I know trying a new bat might be a hard sell for a guy who won’t give up his 100-year-old beaver tail of a mitt, but I think changing bats might be easier than changing everything else. Including a swing that still looks fantastic.


Jason Heyward and Troy Tulowitzki’s Eroding Command of the Strike Zone

(All stats are current as of the end of April 24th.)

During the offseason, Jason Heyward and Troy Tulowitzki were two of the highest-profile players on the trade block. Heyward was ultimately dealt as the Braves gear up for the future and the Cardinals look to fortify RF after the passing of Oscar Taveras. Tulowitzki was not dealt, as the Rockies hope that they can make an improbable run to the playoffs. Both players could be looking for new homes within the next year, as Heyward hits free agency (barring an extension) and Tulowitzki would be a very tempting target at the trade deadline or in free agency.

However, both players have started the season slowly. While Tulowitzki has a 103 wRC+ (which is pretty darn good for a SS), that figure is far below his 2014 results (171 wRC+) and his career figure (125 wRC+). Much of the blame can be placed on his .197 ISO, which is far below both his 2014 and career ISO. Tulowitzki has been able to counteract the drop in power somewhat due to a .370 BABIP that is far above any BABIP he has recorded over a full season. Heyward’s drop has been even more severe, as he is the owner of a B.J. Upton-esque 64 wRC+. While much of that should be attributed to a paltry .235 BABIP, some blame also can be ascribed to a poor batted ball distribution. However, it is too early to say that either player won’t see these trends reverse as the season progresses.

On the other hand, both players are suffering a precipitous and concerning decline in their plate discipline. Tulowitzki’s K rate has shot up from between 15 and 16 percent to almost 24 percent. Likewise, his walk rate has fallen to a paltry 1.6 percent as he has drawn one walk over the season. That shift is being driven by an increase in his swings on pitches out of zone, which has grown to 35 percent from 27 percent in 2014 according to Pitch F/X data:

View post on imgur.com

In addition, Tulowitzki is making less contact as he swings, as his contact rate is below 80 percent – a percentage he has never had at the end of the season. He is also swinging and missing more and is over the league average for the first time since his disastrous cup of coffee in 2006. Tulowitzki’s also seen 8 percent more pitches in the zone (a higher figure than ever before), which indicates that pitchers are not as afraid of him as they once were. All of this comes directly after he had hip surgery, which suggests that he may not be fully recovered yet or that the injury may have eroded his skills slightly.

Heyward also has seen his plate discipline deteriorate but not to the same level that Tulowitzki has. First the good news: his strikeout rate, while slightly elevated from his totals in the past few years, is still in line with his career norms. However, the rest of his plate discipline numbers are worse than his career numbers. As noted by Bernie Miklasz, Heyward only has one walk, is swinging at far more pitches out of zone than ever before, and is seeing fewer pitches in the zone than ever before. Miklasz also notes that Heyward is pounding groundballs – he is currently putting 62 percent of his balls in play on the ground. This is far above his career averages (as shown in the chart below) and is a sign that chasing more pitches is not helping him generate power.

In addition to the points that Miklasz made, Heyward is also swinging far less at pitches in the zone. This season, he has swung at 58 percent of pitches in the zone, the lowest percentage since his rookie year. These diverging trends have allowed Heyward to set a personal record: for every pitch that Heyward swings at out of the strike zone, he only swings at 1.04 pitches in the strike zone.* This is far below his career ratio of 1.69.

Now, as loyal FanGraphs members (only the truly committed read the Community board!), I can hear your refrain of “Small Sample Size.” And I certainly agree that it is too early to completely believe in the magnitude of these changes. It is extremely unlikely that both players will walk less than 2 percent of the time this year. However, I believe that the magnitude and consistency of the changes is a clear sign that both players are suffering due to the erosion of their plate-discipline skills. Both players have reached the stabilization point for strikeout rate, are halfway to the stabilization point for walk rate, and Heyward is quickly approaching the stabilization point for groundball rate. In addition, per pitch metrics like O-Swing and Z-Swing stabilize quickly, with swing rate stabilizing at 50 PAs. While those stabilization points only denote the point at which the data is half noise and half signal, the changes are consistent enough across multiple measures of plate discipline that its extremely hard to argue that it could **all** be a fluke. While both of these players are plus defenders and have the power to still be plus hitters with poor plate discipline, their value will suffer unless they can find a way to turn around their plate discipline.

* This statistic can be calculated using the following formula: (Zone%*Z-Swing%)/((1-Zone%)*O-Swing%).


Does Troy Tulowitzki Suffer Without Carlos Gonzalez?

Does Troy Tulowitzki suffer without Carlos Gonzalez in the lineup?

Several weeks ago, in the same way my last article on rookie first and second half splits was inspired, my attention was alerted when a podcast personality contrived that Troy Tulowitzki, before his most recent bout with the injury bug, had performed poorly because Carlos Gonzalez had been out of the lineup.

The pundit grabbed the lowest handing fruit he could find in an effort to create a narrative, and a dogmatic one at that, as to why the Colorado Rockies slugger had not lived up to his pre All-Star break numbers.

******* *******’s (I’d prefer the article to be more about the subject of Tulowitzki and Gonzalez than the podcast member) argument was that without Carlos Gonzalez in the lineup, pitchers could approach Tulowitzki without fear, give him less strikes, and that is why his hitting has declined.

While this pundit surmised that Troy Tulowitzki’s performance declines when Carlos Gonzalez is out of the lineup, the numbers tell a much different story.

While we will look at the more direct numbers in a moment, the idea that Tulowitzki plays worse without Gonzalez is essentially the idea of lineup protection at a micro level. There have been countless instances that have debunked the idea of lineup protection, and, to my knowledge, none that have proved its existence.

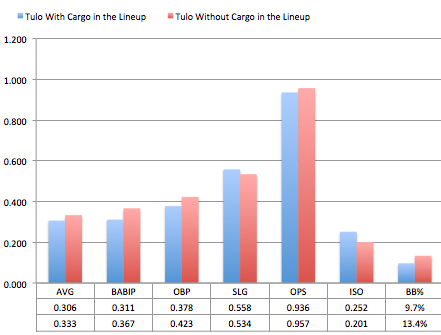
Screen Shot 2014-08-10 at 6.02.45 PM

The research looked at all games from 2010—Carlos Gonzalez’ first complete season—to today.

The results paint a much lighter picture than the Guernica that ******* ******* painted.

In games where Tulo has played without Cargo, he has had a higher AVG, OBP, OPS, and BB%. One might think that Tulowitzki would continue his normal performance without Carlos Gonzalez in the lineup, but, as this information suggests, it is hard to imagine that Tulo plays better because Carlos Gonzalez is not in the lineup, which leads me to believe what one would normally think about out of the ordinary performances in a small amount of at bats.

The utility of these results should be used for descriptive, and not predictive, purposes. Troy Tulowitzki has only had 479 plate appearances without Carlos Gonzalez, and that is far from a large enough sample size to be deemed reliable.

But because of the recent remarks made by Tulowitzki, it seems like it will be more likely than not that sooner rather than later we will see a large enough of a sample size of Tulo in another uniform to see if this trend continues.

While Tulo has played worse and is hurt as of late, we might expect that it is because he was unlikely to live up to the performance he had in the first half, and not because of Cargo’s presence or lack thereof in the lineup. Over the course of the first half of the season, Tulowitzki’s posted the 15th best OPS in a half of a season since 2010.

Tulo’s latest play suggests a regression to the mean, and while we are powerless to know exactly why regression happens, some pundits proclaim to know the reason (i.e. Tulo plays worse without Carlos Gonzalez), when really their specious statement is noise with a coat of eloquent words painted upon it.

When the next “expert” tells you that Tulo has preformed poorly, because “ he wants out of Colorado” or  “he wants to be traded”, you’ll know to be more skeptical and not passively agree.

If he gets healthy at some point this season, we should expect Tulowitzki to perform close to his projections in all areas for the rest of the year, and it will be with or without Carlos Gonzalez, not because of him.