Archive for pitching

Taking a Look at David Price’s Turnaround

After signing a massive seven-year, 217-million-dollar contract with the Red Sox this past offseason, David Price got off to a slow start. After his May 7th start against the Yankees in which he gave up six earned runs in just 4.2 innings, Price’s ERA stood at a whopping 6.75 yet his peripherals remained strong. He had a 2.98 FIP and 11.5 K/9. However, he was giving up hard contact over 41 percent of the time. The immediate fix was a mechanical issue noticed by Dustin Pedroia that was limiting Price’s leg lift and diminishing his velocity. Frustrated with his failures, Price vowed to be better.

And better he has been. After throwing a gem in Sunday’s win over the Mariners where he went eight innings allowing his only run on a solo shot by Franklin Gutierrez, Price lowered his season ERA to a still high 4.24 and had his eighth straight quality start. Over those eight starts, Price has been much better, allowing 16 runs over 58.1 innings for an ERA of 2.47. During this stretch, he has a 3.88 FIP and 8.6 K/9 and has only allowed hard contact around 27 percent of the time. Although his strikeouts have gone down and his FIP went up due to his decrease in strikeouts to go with an increase in home runs allowed, Price has limited the amount of hard contact he has given up. This can be seen in the BABIP over the two stretches. In his first seven starts, his BABIP against was around .370, while in this current eight-start stretch it is hovering around .230.

This in turn, has allowed him to be very successful while pitching to contact. His biggest issue remains his ability to keep the ball in the park. Over his last eight starts, Price has allowed at least one home run in seven of them. So while he has limited hard contact against him, the few mistakes that he makes each game are punished. Despite this increase in home runs allowed, he continues to pitch well and go deep into games, allowing the Red Sox bullpen a chance to recover after the consistently shaky starts from their 4th and 5th starters.

There are a few main reasons to this improvement. The first was his ability to regain his velocity. Looking at his velocity each month thanks to data from Brooks Baseball, there is a small but steady increase in his average four-seam and sinker velocity. Before May 8th, his velocity was low by his standards. Typically a pitcher averaging 94 to 95 MPH with his fastball, he had been sitting 93 MPH.

Year Fourseam Sinker Change Curve Cutter
2016, Before May 8th 93.2 93.0 84.3 78.8 88.8

Although just a small dip in velocity, it made him much more hittable.

Since May 8th, his velocity has been back on the rise.

Year Fourseam Sinker Change Curve Cutter
2016, Since May 8th 94.2 93.4 85.0 78.3 89.0

After the mechanical change, his four-seam has been averaging around 94 MPH and his sinker has been averaging around 93 MPH, but still slightly up from what it was before. Although it is a small increase, this added velocity has helped Price dominate hitters, gain confidence, and re-establish himself as an ace.

Another key factor in this improvement has been his pitch usage. Using pitch data from Brooks Baseball, I was able to look at Price’s pitch usage. In his first seven starts, Price relied on mixing different types of fastballs with his main offspeed pitch being a change-up while also displaying the occasional curve.

Year Fourseam Sinker Cutter Curve Change
2016, Before May 8th 27.6 22.6 19.8 6.6 23.4

His four-seam was used around 28 percent of the time yet it lacked the movement displayed by his cutter and sinker. The high four-seam usage to go with decreased velocity spelled trouble for Price.

However, since May 8th, Price has made an adjustment displayed by the fact that he is now using his sinker as his primary pitch while also using his four-seam far less frequently.

Year Fourseam Sinker Cutter Curve Change
2016, Since May 8th 9.0 36.1 22.4 8.3 24.3

His sinker is now used around 36 percent of the time compared to his four-seam being used around nine percent of the time. With this added movement and velocity, Price has been able to be more effective while keeping the use of his curve, cutter, and changeup around the same. This simple switch from a four-seam to a sinker has allowed him to go on a tear.

Looking forward, the Red Sox need Price to continue to be the pitcher that he has been over his last eight starts. They are paying him ace money and he is expected to pitch like one down the stretch as Boston hopes to continue their great turnaround year. If Price continues to have outings like these, the Sox should like their chances come October with him taking the mound with their season on the line.


Tyler Wilson and His Five Plus Pitches

Let me preface this article by saying that I watch A LOT of baseball.  I also have an extensive analytical background and am always analyzing baseball stats looking for value in players.  Last week, I was watching an Orioles game and the starting pitcher was a player I have never heard of.  His name is Tyler Wilson.  While watching the game, I was very impressed with his overall make-up and the confidence he displayed in each one of his pitches.  Many times what separates a pitcher from being able to start at the big-league level versus being destined for the bullpen is the ability to throw multiple pitches.  The ability to throw each of those pitches effectively, however, can be what separates a good starting pitcher from a great starting pitcher.  The more I watched of Wilson, the more intrigued I became about his future outlook, and the more motivated I became to write this article.  (I went back and watched all of Wilson’s starts this year before writing this article.)

To give you a little background, Tyler Wilson has never been an elite prospect.  He attended college at the University of Virginia, where he was overlooked by fellow staff-mate, and future 1st round pick, Danny Hultzen.  Wilson was drafted by the Orioles in the 10th round of the 2011 MLB Draft.  Ever since being drafted, he has quietly excelled at every level.  He doesn’t have the dominant strikeout numbers that you look for in pitching prospects, which is a big reason he has gone overlooked for much of his career.

After climbing his way through the organizational ladder, Wilson made his major league debut with the Orioles last year and eventually made the team this year out of spring training.  Although he made the team in a bullpen role, early season injuries to the Orioles pitching staff opened up an opportunity and Wilson has really taken advantage of it.  Enough of the background though.  Let’s move on to what I saw while actually watching him pitch.

Tyler Wilson features a cutter and a two-seam fastball.  Each of these pitches sit in the 89-91 mph range and both show a great amount of movement.  The cutter is most effective against right-handed batters when thrown on the outside portion of the plate.  Check out the video below to watch him fool Kansas City Royals outfielder Lorenzo Cain with three straight cutters:

He essentially gave Cain, a very good hitter, three of the exact same pitches in a row…and Cain couldn’t touch them.  In every start this year, Wilson has pounded the outside corner with this cutter and has had fantastic results.  Don’t think by any means though that he is a one trick pony.  As soon as you start to expect that cutter on the outside corner, Wilson will come right back in on you with a two-seam fastball:

Look at the horizontal movement on that pitch!  Absolutely filthy!  Wilson has showed a ton of confidence in both of those pitches so far this season as he uses them to pound both sides of the strike zone and his command of them has been exceptional.  He is not afraid to throw them in any count and they are equally effective vs both left-handed and right-handed batters.

While his fastballs both seemed to be plus pitches upon first glance, I started to have thoughts that this guy might be for real as soon as he started throwing his curveball.  Wilson’s breaking ball sits in the 77-79 mph range.  I was astonished by how well he was able to locate his curve and the amount of movement on each and every one he threw.  Watch him send White Sox slugger Jose Abreu down swinging in the video below:

Abreu had no chance.  In his most recent start against the Twins, Wilson’s curve looked even better.  Check out the one he threw to Byung-Ho Park:

Both of those pitches came in a 2-2 count.  Many pitchers are scared to throw a breaking ball in a 2-2 count, especially to players with plus power such as Abreu and Park.  If you miss your target, two things can happen.  One — you leave the ball up in the zone and it gets hit out of the stadium.  Two — you throw it in the dirt; the hitter lays off; and now you have to pitch to this slugger with a full count.  Wilson isn’t scared to throw his curveball in any count and that is what makes him so dangerous.  You never know when to expect it, but at the same time you have to expect that he can throw it at any moment.

The last pitch in Wilson’s arsenal is his changeup.  This pitch has a ton of downward movement and produces a lot of groundballs.  While there were many better examples that I could have shown you of his change-up in action, I wanted to show one of his bad ones.  Even when he missed his target, the batter was still fooled by the amount of movement on this pitch.  Check out the following pitch to Royals SS Alcides Escobar:

The catcher set up down in the zone and Wilson clearly misses his target.  Luckily it didn’t seem to matter as the pitch had an insane amount of horizontal movement, running in on Escobar and jamming him.

Take a look at the chart below, showing the vertical and horizontal movement on each of Wilson’s pitches:

Tyler Wilson Movement

The middle portion of this chart is empty.  All five of his pitches have a tremendous amount of movement, and none of them move in the same direction.  The fact that he is able to command each of these pitches so well and keep hitters guessing with which one will come next is the reason why he has had so much success.  A big reason why hitters are having trouble guessing his pitches is because of how well Wilson is able to repeat his delivery.  The chart below shows Wilson’s release point for each type of pitch:

Tyler Wilson Release Point
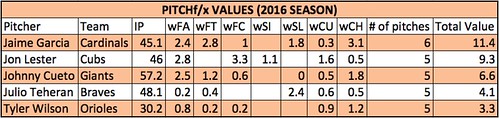
As you can see, his release point is almost identical with all five of his pitches.  At this point, I have watched all of his starts from this season and was very impressed.   I then decided to do some research and was immediately impressed with stats such as his career BB rate and low WHIP, but wanted to dig further.  I began to look through the PITCHf/x data because I was curious to see how effective each of his pitches actually were.  Based on the PITCHf/x value metric, all of his pitches so far this year have graded as above average.  If you are not familiar with the PITCHf/x value scale, someone who has a fastball ranking of zero means that he possesses an average fastball.  Any value above zero means that pitch is above average.  Obviously the higher the number, the better the pitch.  The same goes for negative numbers and pitches being below average.  See the table below for the breakdown of Wilson’s arsenal:

Screen Shot 2016-05-15 at 1.19.17 AM

Based on the above values, the change-up has been Wilson’s most valuable pitch this season with his curveball close behind.  Obviously it is very early in the season and we are working with a small sample size…but that doesn’t mean we can’t have fun!  While doing this research, I set out the goal to find every starting pitcher who throws five or more above-average pitches.  Below is the list of players who fit that description:

Screen Shot 2016-05-15 at 1.41.09 AM
IP = Innings Pitched
FA = Fastball
FT = Two-Seam Fastball
FC = Cut Fastball
SI = Sinker
SL = Slider
CU = Curveball
CH = Change-up
KC = Knuckle Curveball
EP = Eephus

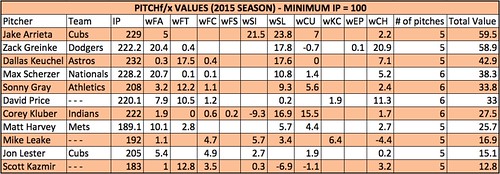
There are only five pitchers who have thrown five or more pitches above average so far this season!  Wilson is in great company, as the other four pitchers are all All-Star-caliber players and borderline household names.  Being that this is such a small sample size, I decided to look back at last year’s stats to see how many players fit this description over a full season.  Using the same parameters and setting the minimum IP to 100, the following table was produced:

Screen Shot 2016-05-15 at 2.05.17 AM

Once again, the names on this list are some of the top pitchers in baseball.  A few of these pitchers have a pitch that graded out as below average, but since they had five or more different pitches all individually grade as above average, they made the final cut.

As you can see, it is very rare to have a pitcher who has five legitimate plus pitches.  I am very interested to see if Tyler Wilson can maintain these results over the course of a full season, and I really hope he is given the opportunity to do so.  If he continues to pitch the way he has been, the Orioles will have no choice but to leave him in the rotation.  Although he has had limited success, Wilson has struggled in each of his starts when facing the lineup the third time around.  This could be due to the fact that he is still in the process of being stretched out from his bullpen role.  When in the bullpen, you don’t have to prepare to face the same hitter three times.  I am hopeful that once he is fully stretched out and back into his starter mentality, he will be able to make the necessary adjustments and continue to throw all of his pitches with confidence.  If he can continue to make quality pitches as he faces the lineup for a third time, I believe Tyler Wilson has the chance to become a very special pitcher.

Memorable quotes I heard during the TV broadcasts:

“Everyone thinks that I pitch with a chip on my shoulder but I really don’t.  I just go out and compete.  I don’t think of it that way.” – Tyler Wilson

“I think he understands himself.  He can maintain his game-plan throughout the game.  He’s going to keep us in the game and give us a chance to win.  What more can you ask for?” – Pitching Coach Dave Wallace

“I love that he can make the ball run in and then cut away.  He pitches to both sides of the plate.  Not a lot of young pitchers can do that.” – Manager Buck Showalter

…no Buck, not a lot of young pitchers can do that.

Twitter – @mtamburri922


Can PitchFX Data Be Used to Identify Muscle Fatigue?

Introduction

Muscle fatigue is a process that results in decreased force generating capacity, and impaired performance [1]. Reduced force due to muscle fatigue may result in less stable joints, which can increase the risk of injury [2].  Furthermore, muscle fatigue is known to reduce joint proprioception  [3]–[6], which can result in further compromised joint stability and increased injury risk. Baseball pitchers have been shown to alter their kinematics (joint angles) when fatigued, which may strain different tissues when compared to pitching without fatigue [7].  Repetitive strain on these tissues can result in injury, and in baseball pitchers, injuries such as Ulnar Collateral Ligament tear.

Fatigue has been named the number one cause of injuries in baseball pitchers, leading to a 500% increase in injury likelihood [8]. Handgrip strength has decreased by up to 5% after simulated baseball games [9], and pitch velocity decreases over the the course of a game [10]. Pitcher kinematics also change with fatigue, with the elbow dropping lower, and the stride getting shorter.

The PITCHf/x system was created by Sportvision, and installed in every MLB stadium since 2006. The system allows for tracking of pitch movement, velocity and release point for every pitch thrown at the major league level. Two cameras are mounted in each stadium, and are used to track each pitch and display data during live broadcasts and websites. With the use of free software, like the programming package R, and database software MySQL, anyone can download gigabytes of data within hours, allowing for detailed analyses of pitching and hitting. With this detailed data, it would theoretically be possible to track changes associated with muscle fatigue. The purpose of this study was to examine how pitch velocity and release point changed in starting pitchers during the 2015 season.

Methods

Data Acquisition

I queried the pitchFX data from the 2015 season, grouping pitches by pitch type, pitcher, and inning. A pitch had to be thrown 20 times in an inning to be included for further analysis. The pitchers included in this analysis were those who pitched a minimum of 100 innings as a starting pitcher. The main focus of this analysis was to examine peak velocity changes, so only fastball type pitches were included in the analysis (four-seam, two-seam, split finger, sinking, cut, and general fastball).

I calculated the average velocity for each pitcher during their first inning of pitching. I then calculated the minimum average velocity for these pitches during either the 5th, or 6th inning – which ever value was the lowest.

For release point, I calculated the resultant distance of the release point (at z0, x0), from 0,0 (Figure 1). I also examined the change in vertical release point (z0) between the first inning, and the minimum of the 5th and 6th innings. Using the horizontal release point, and the vertical release point, I also calculated the absolute release angle (normalizing for left-handed and right-handed pitchers).

View post on imgur.com

Figure 1. Demonstration of how calculations were made for the vertical release point, resultant release distance, and release angle.

Statistics

For this analysis, the independent variable was inning (first inning, minimum of 5th/6th inning).

To examine the effect of inning, I performed a dependent samples t-test on variables of peak velocity, resultant release point, vertical release point, and release angle, with p < 0.05. I also calculated Cohen’s D to determine the effect size of the inning.

Results

Peak velocity significantly decreased between the first inning (91.19 ± 2.91 mph) and 5th/6th inning of the start (90.61 ± 3.01 mph, p< 0.05; d=0.20) (Figure 2). Vertical release point significantly decreased from 5.9 ± 0.35 feet to 5.84 ± 0.36 feet (p < 0.05, d=0.17)(Figure 3a). Resultant release point also decreased from 6.15 ± 0.35 feet to 6.09 ± 0.35 feet (p < 0.05, d=0.18) (Figure 3b). All of these changes were statistically significant, however, represented small effect sizes.

Release angle was significantly different between the first and final inning, moving from 74.9 ± 6.17 degrees to 75.1 ± 6.31 degrees. This represents a release angle that is closer to the vertical plane, or, closer to the midline of the body. While this change was statistically significant, the effect size was negligible (d=-0.04) (figure 4).

View post on imgur.com

Figure 2. Fastball velocity significantly decreased between the first inning (91.19 ± 2.91 mph) and the minimum between the 5th and 6th inning (90.61 ± 3.01 mph) (p < 0.05). This represented a small effect size, of 0.20.

View post on imgur.com

Figure 3. Both vertical release point, and resultant release distance decreased between the first inning and the 6th inning, representing a possible change in pitcher kinematics. This represented a small effect size, of 0.18 and 0.17, respectively.


View post on imgur.com

Figure 4. Release angle increased (representing a release point closer to the midline of the body) between the first and final inning, though the effect size for this relationship was negligible.

Discussion

In line with previous research on baseball pitching and fatigue, fastball velocity decreased between the beginning and the end of the average game. A decrease in release point distance and height also indicates that kinematics have changed during the course of a baseball game.

The following examples are from pitchers in the top ten for fatigue-related changes between innings. Andrew Heaney has a nearly 2mph decline between the 1st and the 6th inning (Figure 5a), and Ervin Santana has his resultant release point decrease by 2.21% (Figure 5b). In both cases, it could be expected that performance would be impaired by these fatigue-related changes. Conversely, Jacob deGrom actually increases his release point by 0.58% (Figure 5d), and Max Scherzer increases fastball velocity by 0.38% between the 1st and 6th inning (figure 5c). In general, 70% of pitchers experience a decreased velocity between the first and final inning, 85% of pitchers have a decrease in their resultant release point, and 83% of pitchers have a decrease in their vertical release point.


View post on imgur.com

Figure 4. Case studies to illustrate changes in pitching velocity (A and C), and resultant release point (B and D), using average data for each pitcher during the 2015 season.

The velocity change demonstrated in this analysis represents a decrease of only 0.5 mph from the 1st to the 6th inning. This represents approximately a 1% change in velocity. Previous research has shown up to a 5mph decrease in velocity, decreasing from 90 mph to 85 mph during spring training games [10]. This greater decrease in velocity may represent decreased conditioning from the pitchers at this time of the season. Crotin, et al., [11] found that fastball velocity increased during a season, as a result of conditioning and improved strength. These factors may wash out some of the differences that could be seen throughout the course of a game, when average velocities are calculated over the course of an entire season and by inning, like in this analysis.

The pitchers included in this analysis represent a highly elite subset of the population. Previous research that has examined fatigue in baseball pitchers has included pitchers in spring training [10], college [9], or even Japanese high school players [12]. The fatigue effects for the elite population may not be as severe, as elite athletes are able to moderate the detrimental effects of fatigue when performing their sport specific task [13].

Limitations

Despite the easy access to PitchFX data, there are concerns with the accuracy and reliability of the system. For one, the release point displayed by the PitchFX system is at a distance of 50 feet from the plate. Typically, pitchers release the ball at 54-55 feet from the plate, so the true release point is not exactly known [14] Additionally, inter-stadium differences may also contribute to inaccurate PitchFX data – as cameras are not always in the exact same place in all stadiums.

Conclusions

Examining PitchFX data for fastball velocities and release points, averaged by inning for qualifying starters in the 2015 season, have produced results comparable to more controlled, lab based studies, on fatigue during pitching. However, limitations with the PitchFX system, and averaging data throughout the entire season can possibly remove some of the differences that could possible be seen as a pitcher fatigues. Additional research should be performed to examine in-game changes in velocity for both good, and bad starts, to see if fatigue effects are more prominent as a pitcher becomes less effective.

References

[1]       R. M. Enoka and J. Duchateau, “Muscle fatigue: what, why and how it influences muscle function.,” J. Physiol., vol. 586, no. 1, pp. 11–23, Jan. 2008.

[2]       G. S. Fleisig, J. R. Andrews, C. J. Dillman, and R. F. Escamilla, “Kinetics of baseball pitching with implications about injury mechanisms,” Am. J. Sports Med., vol. 23, no. 2, 1995.

[3]       L. A. Hiemstra, I. K. Lo, and P. J. Fowler, “Effect of fatigue on knee proprioception: implications for dynamic stabilization.,” J. Orthop. Sports Phys. Ther., vol. 31, no. 10, pp. 598–605, Oct. 2001.

[4]       F. Ribeiro, J. Mota, and J. Oliveira, “Effect of exercise-induced fatigue on position sense of the knee in the elderly,” Eur. J. Appl. Physiol., vol. 99, no. 4, pp. 379–385, 2007.

[5]       M. Sharpe and T. Miles, “Position sense at the elbow after fatiguing contractions,” Exp. Brain Res., vol. 94, no. 1, May 1993.

[6]       H. B. Skinner, M. P. Wyatt, J. A. Hodgdon, D. W. Conrad, and R. . Barrack, “Effect of fatigue on joint position sense of the knee,” J. Orthop. Res., vol. 4, no. 1, pp. 112 – 118, 1986.

[7]       R. F. Escamilla, S. W. Barrentine, G. S. Fleisig, N. Zheng, Y. Takada, D. Kingsley, and J. R. Andrews, “Pitching biomechanics as a pitcher approaches muscular fatigue during a simulated baseball game.,” Am. J. Sports Med., vol. 35, no. 1, pp. 23–33, Jan. 2007.

[8]       J. Lemire, “Preventing Athlete Injuries With Data-Driven Tech – Athletic Business,” Athletic Business, 2015. [Online]. Available: http://www.athleticbusiness.com/athlete-safety/preventing-athlete-injuries-with-data-driven-tech.html. [Accessed: 21-Dec-2015].

[9]       M. J. Mullaney, “Upper and Lower Extremity Muscle Fatigue After a Baseball Pitching Performance,” Am. J. Sports Med., vol. 33, no. 1, pp. 108–113, Jan. 2005.

[10]     T. a Murray, T. D. Cook, S. L. Werner, T. F. Schlegel, and R. J. Hawkins, “The effects of extended play on professional baseball pitchers.,” Am. J. Sports Med., vol. 29, no. 2, pp. 137–42, 2001.

[11]     R. L. Crotin, S. Bhan, T. Karakolis, and D. K. Ramsey, “Fastball velocity trends in short-season minor league baseball.,” J. Strength Cond. Res., vol. 27, no. 8, pp. 2206–12, Aug. 2013.

[12]     L.-H. Wang, K.-C. Lo, I.-M. Jou, L.-C. Kuo, T.-W. Tai, and F.-C. Su, “The effects of forearm fatigue on baseball fastball pitching, with implications about elbow injury.,” J. Sports Sci., pp. 1–8, Oct. 2015.

[13]     M. Lyons, Y. Al-Nakeeb, and A. Nevill, “The impact of moderate and high intensity total body fatigue on passing accuracy in expert and novice basketball players.,” J. Sports Sci. Med., vol. 5, no. 2, pp. 215–27, Jan. 2006.

[14]     M. Fast, “The Internet cried a little when you wrote that on it – The Hardball Times,” The Hardball Times, 2010. [Online]. Available: http://www.hardballtimes.com/the-internet-cried-a-little-when-you-wrote-that-on-it/. [Accessed: 21-Dec-2015].


How Game Theory Is Applied to Pitch Optimization

The timeless struggle between pitcher and batter is one of dominance — who holds it and how. Both players use a repertoire of techniques to adapt to each other’s strategies in order to gain advantage, thereby winning the at-bat and, ultimately, the game.

These strategies can rely on everything from experience to data. In fact, baseball players rely heavily on data analytics in order to tell them how they’re swinging their bats, how well they’ll do in college, how they’ll perform at Wrigley versus Miller.

Big data has been used in baseball for decades — as early as the 60s. Bill James, however, was the first prominent sabermetrician, writing about the field in his Bill James Baseball Abstracts during the 80s. Sabermetrics are used to measure in-game performance and are often used by teams to prospect players.

Baseball fans familiar with sabermetrics, the A’s, and Brad Pitt have likely seen Moneyball, the Hollywood adaptation of Michael Lewis’ book. The book told the story of As manager Billy Beane’s use of sabermetrics to amass a winning team.

Sabermetrics is one way baseball teams use big data to leverage game theory in baseball — on a team-wide scale. However, by leveraging their data through the concepts of game theory on a smaller scale, baseball teams can help their men on mound out-duel those at the plate.

Game theory studies strategic decision making, not just in sports or games, but in any situation in which a decision must be made against another decision maker. In other words, it is the study of conflict.

Game theory uses mathematical models to analyze decisions. Most sports are zero-sum games, in which the decisions of one player (or team) will have a direct effect on the opposing player (or team). This creates an equilibrium which is known as the Nash equilibrium, named for the mathematician John Forbes Nash. What this means is that if a team scores a run, it is usually at the expense of the opposing team — likely based on an error by a fielder or a hit off a pitcher.

In the case of pitching, game theory — especially the use of the Nash equilibrium — can be used to predict pitch optimization for strategic purposes. Neil Paine of FiveThirtyEight advocates using big data and sabermetrics to analyze each pitch in a hurler’s armory, then cultivating the pitcher’s equilibrium — the perfect blend of pitches that will result in the highest number of strikeouts, etc.

Paine has gone so far as to create his own formula, the Nash Score, to predict which pitcher should throw which pitches in order to outwit batters.

In perfect game theory, the Nash equilibrium states that each game player uses a mix of strategies that is so effective, neither has incentive to change strategies. For pitchers, Paine’s Nash Score uses their data to find the optimal combination of pitches to combat batters, including frequency.

Paine does point out that creating this kind of equilibrium in baseball can be detrimental to a pitcher. He is, after all, playing against another human being who is just as capable of using game theory to adapt strategies to upset the equilibrium.

If a pitcher’s fastball is his best, and his Nash Score shows that he should be using it more often, savvy hitters are going to notice. “ . . . In time, the fastball will lose its effectiveness if it’s not balanced against, say, a change-up — even if the fastball is a far better pitch on paper,” writes Paine.

In this case, a mixed strategy is the best — in game theory, mixed strategies are best used when a player intends to keep his opponent guessing. Though pitch optimization using Paine’s Nash Score could lead to efficiency, allowing pitchers to throw fewer pitches for more innings, it could also lead to batters adapting much quicker to patterns, thus negating all the work.


Stephen Strasburg Is Better Than You Think

To a casual baseball fan, Stephen Strasburg’s numbers are not pretty. The owner of a 4.76 ERA and a 1.38 WHIP, Strasburg is clearly having the worst season of his career. But how bad has he been, really? Not as bad as you think. Take a look at these 2015 stats:

Player A: 3.48 xFIP, 22.8 K%, 5.5 BB%
Player B: 3.31 xFIP, 24.1 K%, 5.3 BB%
Player C: 3.18 xFIP, 24.9 K%, 6.0 BB%

Player A is none other than Johny Cueto, recently traded to the Kansas City Royals. 12th in ERA among qualified pitchers, Cueto is widely considered among the best, and perhaps deservedly so with five straight years of a sub-3 ERA. While he has consistently outperformed the above metrics, they are still indicative of general pitcher performance and should not be overlooked when comparing the quality of different pitchers.

Player B actually has the fifth lowest ERA among qualified pitchers and was also traded at the deadline. He’s been one of the most reliable pitchers over the past five years and has been an ace on every staff for which he’s pitched. Player B is David Price.

Player C is obviously Stephen Strasburg, and as you can see, his peripheral stats stack up against the best in the game. In addition to these 2 players, Strasburg also compares positively to others like Sonny Gray and Scott Kazmir, both of whom have better ERAs but a worse xFIP, K%, and BB%.  Strasburg is pitching like an ace, and xFIP shows that, so why have his results been so poor?

Well, first of all, there’s his .345 BABIP. Not only is this high compared to the league average (.296), it’s well above his career mark of .302. Considering he’s not giving up any more line drives or hard contact than usual, his BABIP should fall back to around the .300 mark and bring his ERA down with it.

Not only is his BABIP at an all-time high, his LOB% is at an all-time low. Currently at 65.3%, it figures to inch back up to his career 73.2% mark, or at least to the league average of 72.4%. Considering his strikeouts have not dropped off, there’s no reason for his drop on LOB%, and it can simply be chalked up to bad luck, something that he’s had plenty of this year.

Looking at these stats, there’s nothing that suggests Strasburg is anything but unlucky. However, as Jeff Sullivan pointed out here, Strasburg’s problem could stem from the injury he suffered in the spring. He had apparently adjusted his mechanics to compensate for the discomfort, and even though it appears as though he has fixed this, it’s possible that when pitching from the stretch and in higher leverage situations, he returns to this altered motion by default. When looking at the difference in Strasburg’s stats between pitching from the windup and the stretch, this is what we see:

K% xFIP
Bases Empty 30.1 2.73
Runners on Base 17.0 3.98

Evidently, this claim has some ground. Strasburg is clearly having some problems with runners on base, particularly in striking batters out. Before we deal with the strikeout numbers, let’s take a look to make sure that he’s not just getting killed during the at bats that don’t end in strikeouts.

GB/FB Batted Ball Velocity (mph) Hard Hit % Infield Hit %
Bases Empty .98 89 29.7 4.5
Runners on Base 2.05 88 28.7 12.2

Strasburg is actually generating more ground balls and weaker contact with runners on base. His infield hit percentage is triple what it is when the bases are empty, something that can be attributed to luck. With such weak contact, it’s safe to say this isn’t the problem. So it must be the strikeouts. If we take a look at his whiff rates, the results are intriguing:

2010-2014 2015
Bases Empty 20.1% 17.5%
Runners On Base 17.9% 8.6%

OK, so there’s definitely a problem here. With runners on base, he’s only whiffing batters at half the rate he’s done previously in his career, as well as half the rate that he does with the bases empty. So what’s the issue? Well, it’s not his pitch velocity:

4 Seam 2 Seam Changeup Curve Slider
Bases Empty 95.1 mph 95.4 mph 88.4 mph 81.3 mph 86.7 mph
Runners on Base 95.2 mph 94.9 mph 88.0 mph 81.5 mph 87.2 mph

Strasburg’s average velocity with runners on base is 91.5 mph, compared to 91.0 mph with the bases empty, so he’s actually throwing the ball harder when there’s runners on base. That can’t be the problem. He’s also not walking a significant amount more batters when there are runners on base, so it’s not like he’s sacrificing control for increased speed.

Without any numbers to provide a reason, it appears Strasburg’s struggles when striking out batters with runners on base are either based purely in luck or are completely mental. This is not necessarily a good thing, as we have no idea if or when he will sort it out. With his skill, Strasburg has the potential to be one of the best in the game. He just needs to get out of his own head, and maybe get just a little bit luckier.


Matt Shoemaker’s Need For Speed

If you look at the ERA leaders over the past 30 days with at least 20 IP, you’ll see some familiar names. Clayton Kershaw tops the list (apparently going 37 straight innings without letting up a run isn’t too shabby), and is followed by Scott Kazmir, who has allowed just one run in three starts with his new team. The third name might surprise you though, or maybe not, depending on whether you read the title of the article and how good your inference skills are.

The last time Matt Shoemaker allowed more than two runs in an outing was June 19. Since then, he’s pitched 37 1/3 innings, allowing just seven earned runs. He has 35 strikeouts compared to just 11 walks, leading to a 2.88 FIP. He’s been even better when just isolating the numbers in his three starts since the All-Star break, with 27/6 K/BB and a 1.36 FIP, although, to be fair, that is an incredibly small sample. For comparison’s sake, his FIP through June 19 was 4.70.

So has there been a change in Shoemaker’s game, or has his streak been a fluke? Well, I wouldn’t be writing this if it was the latter, as I’m sure you could’ve guessed (although if you weren’t able to guess who the article was about after the first paragraph, perhaps I’m overestimating you). There’s been a significant change in the way Shoemaker has approached batters. Take a look at his pitch type chart through June 19, courtesy of Baseball Savant:

Matt Shoemaker pitch selection through June 19 (n=1088)

And then take a look at the data since then:

Matt Shoemaker pitch selection since June 19 (n=652)

Through June 19, Shoemaker threw his fastball (four-seam and two-seam) 51.6% of the time. Since then, it’s been 56.9% of the time. Comparing these two proportions with a two-tailed Z test yields a p-value of .034, significant at the .05 level, showing that there has indeed been in a difference in the amount of fastballs he’s thrown.

Of course, throwing more fastballs doesn’t translate to a drop in FIP of over 3 points. That is, unless, those fastballs are of higher quality. And, class, what’s the most important aspect of a fastball? Hopefully you were at least able to guess this one: the velocity. Which, naturally, is the next thing I looked at.

Again, I used Baseball Savant’s PITCHf/x data. Narrowing the results to just fastballs, here are the velocities of Shoemaker’s pitches this year:

Matt Shoemaker 2015 fastball velocity (n=900)

At the beginning of the season, Shoemaker’s average fastball velocity hovered right above 88 mph. Since then, it’s steadily risen, and there’s a clear jump about two-thirds of the way into the season (note that this time would be remarkably near June 19). After the jump, his average velocity has hung closer to the 92 mph range, further away from Jered Weaver status. FanGraphs data shows the same thing:

Matt Shoemaker average fastball velocity

Note, this data also shows Shoemaker’s average velocity from 2014, when he had a 3.04 ERA and a 3.19 SIERA. This image confirms the steady increase in velocity of Shoemaker’s fastball, as it has recently resided at or even above its value from last year’s productive season. There have been clear results from this change, especially in the form of whiff rate, and predictably, strikeouts. Through June 19, Shoemaker’s whiff rate sat at a mediocre 10.5%.

Matt Shoemaker Outcome Breakdown Through June 19


Since the All-Star break, this is what that breakdown looks like:

Matt Shoemaker Outcome Breakdown Post All-Star Break

You might notice that his whiff rate sits at 13.7%, which would be top-5 among starters if he managed it for an entire season. Now, I’m not naive enough to think that number is where is true value lies after just 3 games, but he’s certainly improved off his 10.2% mark he had earlier in the season.

I’m not suggesting Shoemaker is the next coming of Clayton Kershaw. I’m not even sure if he’s the best pitcher on his own staff. But one thing is for sure: Matt Shoemaker is throwing the ball harder than he has in the past, and it’s working. And while it may not continue at this level, there’s no reason it should stop.


A Case For Wei-Yin Chen Ownership

I’m not going to tell you anything you can’t find out for yourself.  This is just a little research on Mr. Chen.  Alternative title would’ve been Chen Music, but I couldn’t find proof of an increase in high and inside fastballs.  Anyways:

Wei-Yin Chen’s surface level numbers have been great this year:

18 GS,   2.86 ERA,   1.12 WHIP,   93 K/116.1 IP

The thing is, he’s been just as good dating back to Jul 1st of 2014:

33 GS,   2.88 ERA,   1.14 WHIP,   164 K/209.2 IP

His peripherals over that time have declared him lucky and say that this success in unsustainable.  His FIP, xFIP, and SIERA for each half have been quite different from the ERAs he’s put up.


FIP xFIP SIERA ERA
JUL – SEPT 2014 3.37 3.68 3.79 2.89
APR – JUL 2015 4.09 3.85 3.78 2.86


Look, I get it, he doesn’t strike out even 20% of the batters he faces and he can struggle with the long ball.  But the Orioles’ defense is ranked 3rd in the league by UZR, and 3rd by UZR/150.  Ahead of the Orioles are the Rays and the Royals.  Each of these teams are outperforming their ERA indicators by a decent amount.

FIP xFIP SIERA ERA
Royals 3.80 4.09 4.03 3.54
Rays 3.86 3.81 3.66 3.59
Orioles 4.01 3.91 3.76 3.73


This does not mean that every pitcher on each of these teams is outperforming their peripherals but it’s obvious (and not because of that table) that defense helps pitchers’ numbers.  I also understand that Camden Yards is a little bit more of a hitters’ park than Kauffman and Tropicana, but that shows up in Chen’s numbers as he has surrendered HR at the rate of 1.29/9 IP at home and 0.89/9 IP on the road (July 3rd 2014 – present).  To be fair, I don’t know if 112 IP and 97.2 IP (home and away, respectively) are large enough sample sizes compared to his full body of work to be worth anything, but let’s say they are, and let’s see what Chen has done differently over his last 209.2 IP compared to his first 422 big league innings.


K% BB% K-BB% GB FB LD PU HF/FB SOFT MED HARD
209.2 19.2 5.2 14.1 40.3 39.5 20.2 10.5 10.1 20.6 53.0 26.5
422 18.2 6.3 11.9 37.2 40.7 22.1 11.1 11.5 14.9 54.2 30.9
DIFF 1.0 -1.1 2.2 3.1 -1.2 -1.9 -0.6 -1.4 5.7 -1.2 -4.4

(209.2 denotes the last 209.2. IP by Chen, spanning from July 3rd, 2014 to his last start against the Yankees, and the 422 is the 422 IP prior to July 3rd of last season, which encompasses the rest of his career)

Even though his ground ball rate doesn’t lead to much confidence in terms of sustainability in that soft contact management, he still is inducing pop-ups at an above-average rate.  So whether it’s a change in sequencing or it’s just as easy as working ahead in more counts, there has been some variation in his pitch usage…another table.

FB SL CB CH
203.1 66.4 17.5 6.2 9.9
422 65.8 13.6 7.4 13.1
DIFF 0.6 3.9 -1.2 -3.2


Obviously he’s traded some curveballs and change-ups for sliders.  His fastball has become increasingly more valuable in 2015 at 8.9 runs above average, compared to 3.3 runs above average from 2014 which was his previous high.

The last thing he’s done better is pound the zone early in counts which has led to a slight decrease in batters’ plate discipline against him.

F-STRK SWING OSWING ZSWING CONTACT SWSTRK
203.1 65.1 50.8 33.3 69.4 82.2 8.9
422 59.0 49.1 30.3 68.8 82.9 8.3
DIFF 6.1 1.7 3.0 0.6 -0.7 0.6


(Almost) Everywhere you want to see improvement there is improvement even if you have to look through a magnifying glass.  Granted, this could be Chen adjusting to the league and now the league will adjust to him.  It would be perfect for him to just cleanly split from the success he’s been having after the all star break and after this piece.

In conclusion, it’s hard to know what to make of Chen as a fantasy option in the long term because he is experiencing a deflated BABIP and a higher LOB% than he has in the past.  Is it all about the luck??  I’m not too bullish on him; the tweaks he has made, while they have led to some slightly positive results, do not warrant picking him up in a dynasty league, but if you’re behind in starts or innings Chen seems to be a solid option for QS/ERA/WHIP this season if he can thwart off the regression monster.  After all that, I did not recommend him in his start against the Yankees and their .325 wOBA (results on that game were meh – it was a QS, but he gave up 10 H in 6.1 IP, 3 ER, and struck out 3) but he’s at Tampa (94 wRC+) after that.  Projecting ahead, he’d face the Tigers (113 wRC+ which is best in the majors, but they could be selling some pieces and they will still be without Miguel Cabrera), and the Athletics (99 wRC+)who are also sellers.  After that it’s likely the Mariners and their 92 wRC+; I’d take that 4 start stretch.  Something to scratch your Chen about.


Ottoneu Tools: Advanced Standings Part Two

In early May I introduced Ottoneu players to the Advanced Standings Dashboard, a tool that allows team owners to decipher the early season standings in an effort to better gauge where their team might be headed as the 2014 season comes together. You can download that tool here (http://goo.gl/pbXI5), but now that we’ve just entered July, the traditional halfway point of the baseball season, it’s time to take a deeper look at a few ways this tool can be used to effectively to manage your team into contention in the second half.

Since the tool can be updated easily with just a couple of copy/paste actions, I use this tool almost daily in my own FGPoints Ottoneu league.  But for fun, let’s walk through a few features as they apply to the FanGraphs Staff League, with a special focus on Eno Sarris’ team, “It’s A Perm“.

Eno enters July as a 3rd place team, nearly 400 points out of 1st place, and 150 out of 2nd.  In general, with at least seven teams over the 8,000 point mark, this league looks competitive at a glance.  But with the recent pickup of Ryan Braun, Eno clearly has his sights set on a title (https://twitter.com/enosarris/status/483016142831644672), so let’s break down the standings using the tool to see if Eno has the momentum to win it all in the 2nd half.

The first tab of the tool is simply the statistical breakdown of the Ottoneu standings into some common sabermetric calculations.  While we can easily see Eno leads the league offensively at 5.44 P/G, the underlying statistics also support it, showing he maintains an (slight) advantage in OPS, OPS+, wOBA, Runs Created, and Total Bases.  What may be more interesting is that Eno has more points scored from his offense than any other team in the league.  In fact, just over 58% of his points have come from his hitters (tab 3, ‘Projected Finish”). With roughly 55% of league scoring in Ottoneu coming from offense, Eno is clearly banking on this approach of shoring up the side of the ledger that carries the most weight.  The acquisition of Braun will only help.

So It’s A Perm is built on bats, but what about the pitching? Unfortunately, this is a weak spot, as Eno’s FIP, WHIP, and BB/9 are all higher than the two teams he’s chasing.  I’m sure he knows this instinctively as his 5.03 P/IP is below the league average of 5.13 P/IP (and further below the top 7 teams of 5.19 P/IP), but the dashboard makes it quicker and easier to point out these pitching deficiencies.  One possible area of improvement: the bullpen.  Without looking at his roster, I can tell you pretty quickly he’s probably pretty frustrated with his bullpen, which has been almost 42% less effective (“PEN” = Saves + Holds/IP) than the league leader, A Little Out of Context.  Shoring up a bullpen is often easier and cheaper than finding an ace SP mid season, so does Eno speculate on the eventual Sergio Romo replacement? Does he approach John Heyman’s Last Sirloin about shedding some of his bullpen pieces in a plea to “deal from strength”?

Once you’ve taken the time to digest some of the traditional sabermetric outputs in the Dashboard, your eyes will naturally gravitate toward the end of the first tab into the “League Projections” section, which is where the real power of the tool comes alive.  The key takeaways here are the “Otto” score and the “Pace” columns.  The Otto score can be better explained here by Chad Young (http://goo.gl/KK4Xy), while the “Pace” attempts to project the season-ending point totals for each team based up a range of factors, including current P/G and P/IP values, remaining IP and GP, and league averages in these areas.  In many leagues these are the columns that can better identify contenders from pretenders, but for the FanGraphs Staff league we see more evidence that the actual standings are, for the most part, very accurate, as Eno is also projected to end the season with the 3rd most points (18,042, or about 400 points out of 1st place).

There are a few interesting things to note here, however. First, John Heyman’s Last Sirloin actually has the third highest Otto score (13.66), but is still projected for 4th place, most likely due to his slower pace in IP (1,416 projected).  If this team can pick up the IP pace in the 2nd half with similar quality IP (5.54 P/IP), this team could make up ground quickly.  This team is clearly riding a league-best bullpen and trying to maximize its RP innings as much as possible.

Second, Ground Rule Double Helmet, despite sitting in 4th place with a strong 9,000 points, has had to overtax a very week pitching staff (4.74 P/IP) just to get there (1,577 IP projected).  The tool sees as much and projects this team to end the season in 5th place, but unless the pitching staff sees a significant improvement in the 2nd half, I’d expect this team to possibly fall even further as the season shakes out.

And that’s just the first tab…Once you get familiar with the tool, you’ll actually find the third tab, “Projected Finish” to be the most useful summary of some of these features described above, as it will give you a daily update of the projected champion for the league.  With Eno just 400 points out of both the actual and projected season-ending standings, this league is just too close to call on July 1st, but there are at least four clear contenders here, and It’s A Perm is one of them.  Will Ryan Braun help the cause? Just for fun, let’s say Braun increases Eno’s offense by just 2.00% (from 5.44 to 5.55).  Well, that could be all it takes, as that small increase moves the needle for It’s A Perm enough to overtake Johan Santa Claus by 100 points in the projected season-ending standings, and less than 200 points out from 1st place.  Of course, that’s if everything else stays the same, and, as in life, the only thing constant in baseball is change.  This will be a fun league to watch as the summer heats up, so enjoy the tool and use it where possible to get that 2% edge.


Why is Bronson Arroyo Still Throwing a Changeup?

I respect the change-up. As a pitcher myself, I know how difficult it is to throw a good one (thus I don’t). It’s not the most glamorous pitch in baseball, but certainly an effective one if executed correctly. Plus, what constitutes a good off-speed offering reads like a laundry list of mechanical and ball path attributes that have to be repeated over and over again. Proper grip on the baseball. Delivery and arm speed must be identical to the fastball. Velocity needs to be lower than the fastball. The ball should move (ideally both horizontally and vertically) and spotted in a good location. And lastly, there’s the intangible pitching IQ of understanding when to throw it.

The Diamondbacks Bronson Arroyo and his change-up seem to be missing a majority of these qualities… but for some reason he continues to throw the darned thing. 16% of the time in 2013, in fact, and already almost 18% of the time this season. I’m baffled.

Now, of course I can’t know what’s going on in his head (although if someone can point me to an all-encompassing Pitching IQ metric I would be more than happy to apply it). And I also can’t measure his arm velocity at release. So I can’t quantify all of his deficiencies. But there is, fortunately, hard numerical and visual data showing he’s lacking the necessary skills to throw a change-up well.

Let’s look at Arroyo compared to pitchers who threw more than 200 change-ups between 2011 and 2013:

Movement:

Since change-ups (especially the circle change) tend to move down and to the right for right-handed pitchers versus down and to the left for southpaws, absolute value of x-Mov and z-Mov is used to standardize axis movement for both.

2011-2013 Abs(x-Mov) Abs(z-Mov)
League Average 7.17 4.30
Arroyo 6.00 3.60

I’ll give him a C- for movement. F’s are left for the likes of a Samuel Deduno, who posted a whopping 0.3″ of lateral and 1.6″ vertical (ignoring the natural pull of gravity) movement in 2013.

Velocity:

Again, keep in mind this does not include all pitchers, just ones who have thrown 200 or more change-ups between 2011 and 2013.

2011-2013 vFA (pfx) vCH (pfx)
League Average 90.9 82.9
Arroyo 86.6 78.2

When batters are already sitting on a below average fastball, it’s fair to say it won’t take much of an adjustment to catch up to the change. Below average may even be an understatement. There are only 12 guys in this data set of 275 with a lower average vFA. Jamie Moyer is one of them.

D+.

Location:

There are very few pitchers that can have success locating the change-up for called strikes.  Fernando Rodney being the freak off-speed guru who fools batters looking with a career 46.2 Swing%, 48.8 Zone% and 1.51 Val/C on the change. Typically the best change hurlers induce swings. And those swings either result in bad contact or a flat out whiff. But location of the pitch is still overwhelmingly crucial to achieve either.

I’ll use 2013 poor contact master Hyun-Jin Ryu and Braves injured whiff king Kris Medlen for illustration.

Ryu, with his 56.2 Swing% and 70.9 Contact% is looking to get bat on ball with the change. Ending 2013 with a .187 BABIP, the pitch worked beautifully to induce dribbling grounders (54.7 GB%) to an already above average Dodgers defense (3.1 UZR/150). How did he do it? Pin-perfect location (courtesy of Brooks Baseball).

 photo 74025e6d-0ca0-4068-802d-d2575977591e_zps07ccd3d1.png

Arroyo also induces hitters to get the bat on the ball with the change… at a whopping 85.5 Contact% rate. But is he getting poor contact with the pitch? I somehow don’t think .600+ SLG and 23 HR  over the past three full seasons would constitute bad contact. Let’s compare his zone chart with that of Ryu.

 photo 53238386-6da5-4f8b-9c21-44707dbd34a3_zpsc37ace95.png


Not quite, Bronson.

“But what about whiffs?” you ask. With a 6.8 career SwStr%, batters aren’t swinging and missing Arroyo’s meatballs either.

Let’s look at Medlen who owns a 27.5 career SwStr% on the pitch for comparison.
 photo 312d97a3-59b7-474d-8d46-43e4196b2988_zps9c5924cd.png

Pretty, no?

I’ll give Arroyo a D- for location. At least he’s not hanging them up and in on lefties.

So overall grade: barely passing.

I really don’t know what to say at this point. I’m miffed. Confounded. And who is the culprit to blame in the grand mystery of why he continues to throw this sub-par pitch? Batters have already gone deep on it twice in 2014. Is it the catchers? Do we point the finger at Devin Mesoraco, Ryan Hanigan, and now Miguel Montero for keeping blind faith and confidence? Are these guys cursed with chronic short-term memory loss? Or do we blame Arroyo for stubbornly going out there outing after outing and continuing to shove that ball in the back of his palm and firing away? If that’s the case, I get it. I’m a pitcher. I’ve stood there on the mound and though, “This next one will be better, guys. I swear!”

So, please, Bronson. In the end, there is really nothing good that has come from you throwing the thing so often. I like you. I really do. I will forever be indebted to you for giving my beloved 2004 Red Sox their first World Series since “tarnation” was a common curse word. But please. Enough change-ups already.


Battle of the Ks: K/9, K/BB and K%

The great debate has been raging for years: which strikeout-related metric is a better predictor of actual pitching success? Some would say there is no right or wrong answer — that each metric has it’s own unique merit and value. That one must look at certain strikeout-related metrics in combination with others. Unfortunately, as tragic as it may seem, statistical evidence begs to differ. Statistics tell us there is in fact a right answer, and it’s a whopper.

Let’s start with K/9. Looking at all 2013 pitchers with 80+ innings, the correlation (R2) between strikeouts per 9 and ERA is a solid  .1081. This correlation has been consistent, plus or minus a few hundredths, for the past five years. So nothing exciting or anomalous can be found in looking at other seasons. Yu Darvish leads the category with Tony Cingrani, Max Scherzer, Anibal Sanchez, and A.J. Burnett rounding out the top five. Additionally, eight of the top ten K/9 leaders ended up with sub 3.10 ERAs. So a decent indicator all-around.

 photo 53a65e17-24d6-482d-b2de-766753f09051_zps2940fbe7.png

K/BB get’s a bit more interesting. We see a jump in linear correlation to .1671 — more than a 50% increase over K/9. Clayton Kershaw, Cliff Lee, and Adam Wainwright  all leap into the top ten of this metric, with Hisashi Iwakuma climbing into the top fifteen — four elite hurlers in 2013 left out of the K/9 leaderboard.

 photo 98225caf-a307-44c3-850b-d610a9444d32_zps70ee67d9.png

But the real gem is K%. It shows double the correlation versus K/9. Plus, the top fifteen in this category ended the year with sub 3.30 ERA — whereas Scott Kazmir (4.04) and Josh Johnson (6.20) smeared the good name of the K/9 leaderboard; with Kevin Slowey (4.11) and Dan Haren (4.67) unpleasantly loitering on the K/BB board.

The reason K% is so powerful is that it simplifies how effective a pitcher is at simply striking out each batter he faces. When BABIP gets involved — as it does for K/9 (high BABIP pitchers are rewarded on K/9 since the number of outs remains the same even if they’re giving up, say, 10+ hits per game) — the value of each strikeout is severely reduced.

 photo 17feabf1-8665-45c5-af39-48d69923e54a_zpsf45972cf.png


To recap:

2013 R2 (correlation to ERA)
K/9 .1081
K/BB .1671
K% .2089

So should we end the debate completely? No. But if you asked me to put money on Tim Lincecum, a career 25.8 K% pitcher with no decline in the stat over the past 2 years, over Tyler Chatwood, a career 13.0 K% who had a breakout year in 2013 with his freakish 76.3% LOB, I would bet on Lincecum every doggone time.