Archive for pirates

2016 Cubs Run Differential

In this post, I take a look at the 2016 Chicago Cubs though their first 100 games. I’ll start out by focusing on the Cubs’ run differential (Runs Scored – Runs Allowed). After a historic start, they reached their pinnacle after the 67th game of the year against the Pirates. At this point, the Cubs were 47-20 and had outscored opponents by 171 runs! Since then, the ball club is 13-20 and their current run differential is at +153.

Still, the Cubs’ +153 mark is 42 runs better than the next-closest team (Washington Nationals). The Cubs and Nationals are the only clubs to have a run differential that is greater than +100. The second-place Cardinals rank third in the league at +95 right now. While the Cubs dominate the top end of the spectrum, the Reds and Braves are running away with the worst run differentials in the league. The Reds have a -143 mark, largely due to the thrashings they have taken at the hands of the Cubs so far in 2016. The Braves have the second-to-worst differential at -134 runs.

Projected Runs to Wins

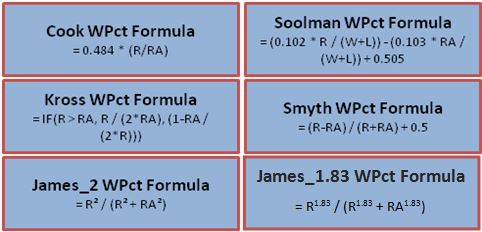
In another place, I introduced the “Pythagorean Theorem’s of Baseball” which basically tries to determine the number of games a team will win based on their number of runs scored and number of runs allowed. Here are the formulas for six of the most common win-percentage projection formulas:
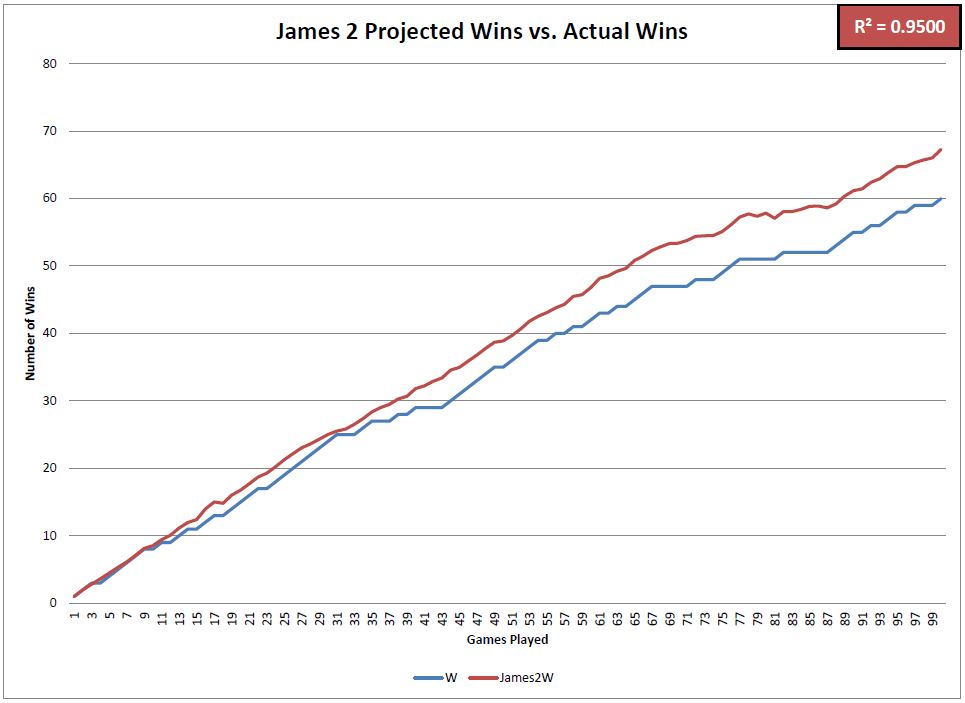
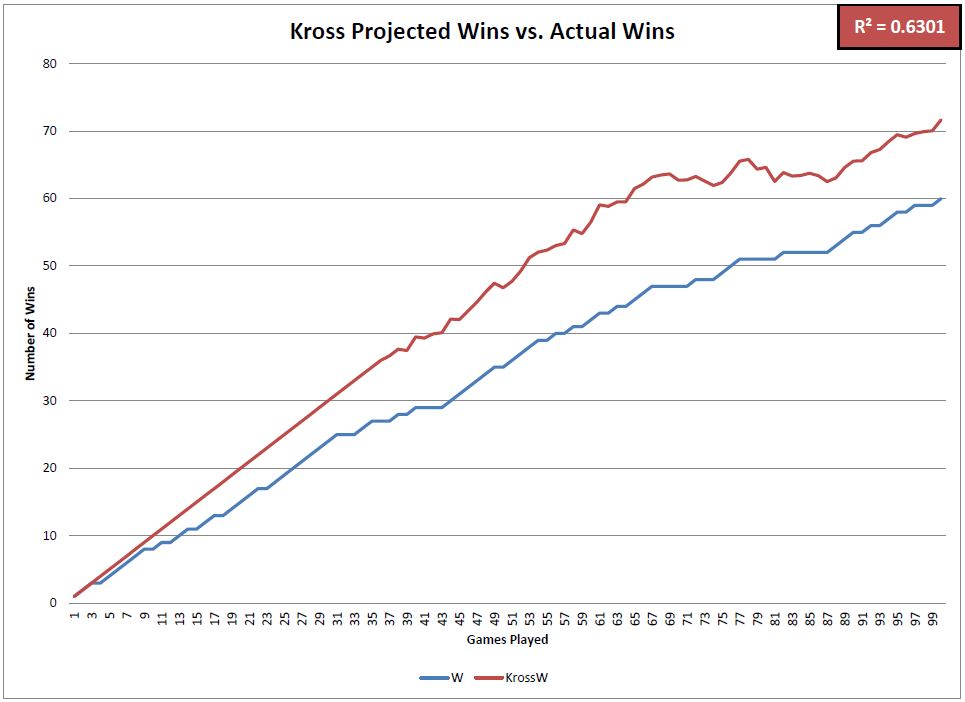
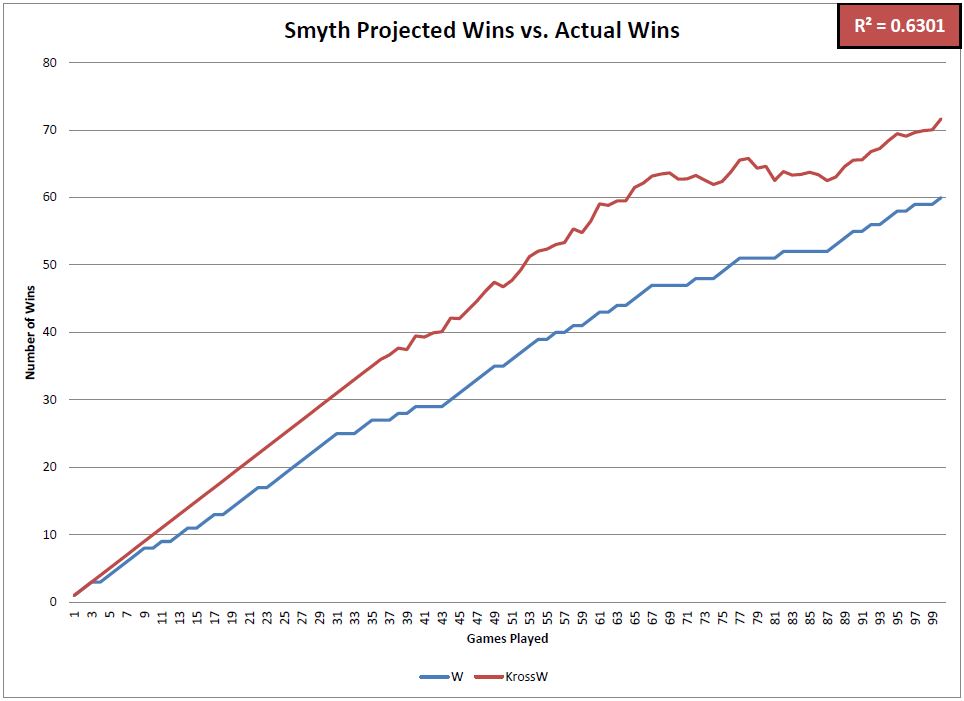
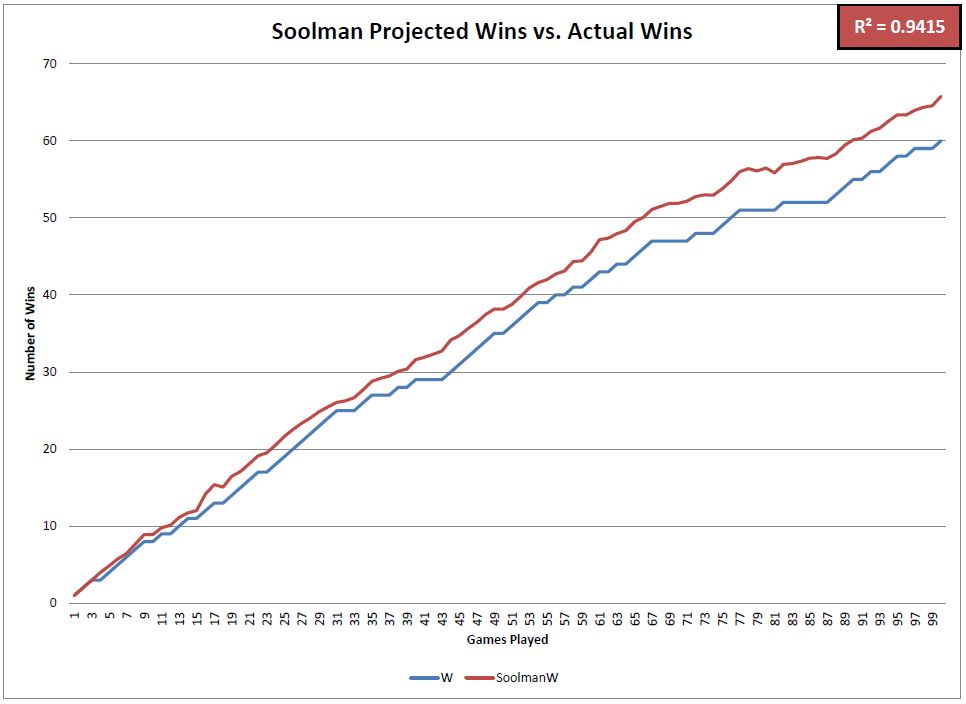
I added up the Cubs’ total runs scored and total runs allowed after each game this year and compared their actual number of wins to the projected number of wins based on each formula. These charts visualize the differences between those numbers.

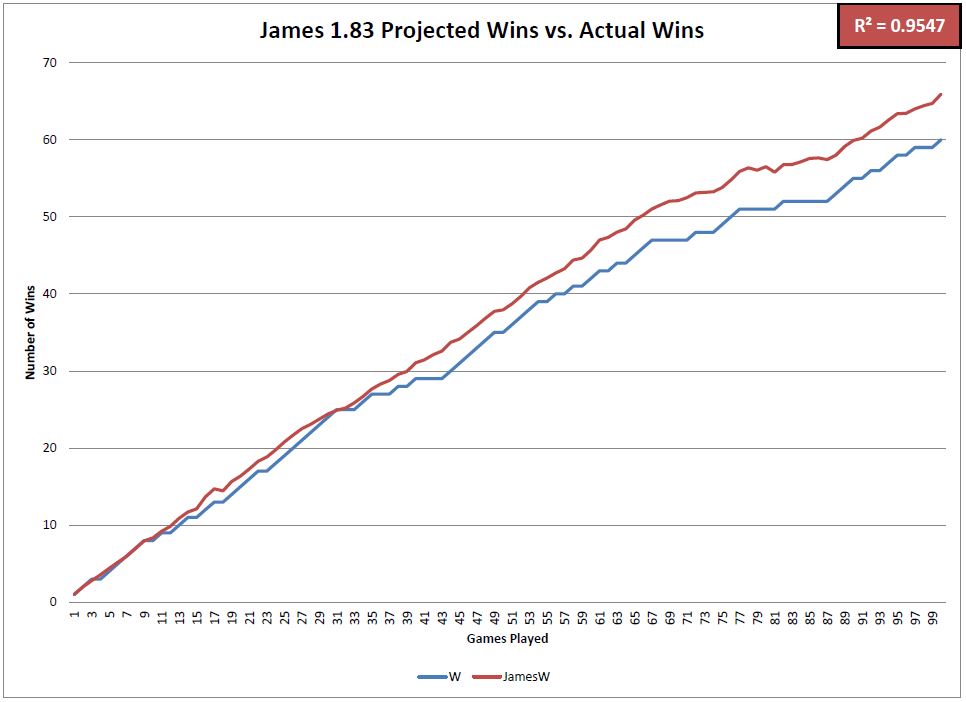
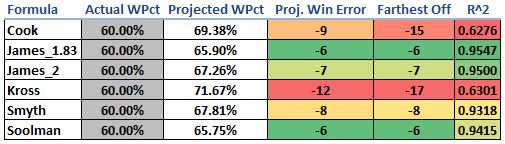
This matrix summarizes how accurate each of the projection formulas has been in predicting the Cubs’ winning percentage and total number of wins so far in 2016. The most accurate formulas was the James_1.83 followed by the James_2 and Soolman. Four of the six formulas were very good predictors, but the Cook and Kross formulas overforecasted the number of wins that they expected the Cubs to have. Notice that at one point this year, each of those formulas projected the Cubs to have over 15 more wins than they actually had. The R^2 value (coefficient of determination) is indicative of how well the projected win percentage matched up to the actual win percentage after each game this season.

All in all, the Cubs have should have at least six more wins this year based on these formulas. Scoring as many runs as they have (4th most in the MLB) and allowing as few runs as they have (T-1st in the MLB) should result in an even better record than 60-40. We knew it was unlikely that they would keep up their record-setting start in the run-differential category, but it will be interesting to see how these numbers match up as the season progresses.

@CubsAdvMetrics on Twitter


A One-Man Marte Partay Between the Bases

This article originally appeared on the Pirates blog Bucco’s Cove.

“Speed kills.” –Al Davis

Starling Marte is having a hell of a season stealing bases and this is one of the things that should have propelled him into the All Star Game without needing the stupid final vote. He is the top baserunner in the NL this year, he’s second in the league with 25 stolen bases, and he has a better percentage than the leader Jonathan Villar.

A recent game against the Cardinals gave a strong piece of evidence of Marte’s preternatural baserunning ability when he stole second base with Carlos Martinez pitching in the sixth inning:

The Pirates’ announcers commented on the fact that people very rarely steal off of Martinez. I went to look at the numbers: in 399 2/3 innings since entering MLB, Martinez has yielded only 10 stolen bases in 19 attempts. I think the 19 attempts is really indicative of his abilities to control the running game; people just don’t even try to run on Carlos Martinez. Martinez ranks 36th among all pitchers in SB/IP who have thrown at least 200 innings since 2013, which is decent. However, if we limit ourselves to looking at only righty starters over this time period (since it is much harder to steal against lefties and game circumstances are a bit different between starters and relievers), Martinez ranks 13th among pitchers with the same innings restrictions. (I’m not including tables for all of these stats, but if you want to see for yourself, mosey on over to the Baseball Reference Play Index, where all of this data comes from.)

Martinez has really shut down the running game since becoming a full-time starter in 2015, however. Over that time period, he ranks fourth among all pitchers (lefty, righty, starter, and reliever alike) having at least 250 innings in SB/IP, yielding only four SB in nine attempts over 282 innings.

Rank Player SB IP SB/IP
1 David Price 1 336.2 0.00297
2 Wade Miley 2 281 0.00712
3 Yordano Ventura 3 250.2 0.01199
4 Carlos Martinez 4 282 0.01418
5 Chris Tillman 4 279.1 0.01433
6 Wei-Yin Chen 5 290 0.01724
7 Danny Salazar 5 284 0.01761
8 Johnny Cueto 6 334.1 0.01796
9 Chris Sale 6 328.2 0.01828
10 R.A. Dickey 6 324 0.01852

(Note: If you bump this down to 150 innings to get more relievers on the list, Martinez is still in the top 10 for SB/IP.)

Of the four pitchers ahead of him in the table, two are lefties. (Sidebar: How the hell is R.A. Dickey on this list given the fact that he throws a knuckleball? It seems like it should be really easy to steal on him given that.) Martinez is similarly ranked (fifth) if you look at SB/Total Baserunners over the same period; in short, Martinez is really, really good at controlling the running game.

Furthermore, reigning eight-time Gold Glove winner Yadier Molina was behind the dish attempting to throw Marte out. Molina ranks first among all catchers since 2002 in his ability to control the running game by the defensive metric rSB. Obviously Martinez’s ability to prevent the stolen base is helped by having Molina behind the dish, but the combination of these two has been deadly over the past season and a half, making Marte’s accomplishment all the more impressive.

The Martinez/Molina duo (and Martinez in general) has only allowed one other stolen base this season so far. Who was it? None other than Bartolo Colon! Actually, I’m kidding, it was Starling Marte, which is almost as crazy! He has the only two stolen bases this season against a guy who only gave up two all of last season. These are also the only two attempts against Martinez all season. On May 6, after a bunch of false starts, pickoff moves, foul balls, and laughs between Molina and Marte, he finally got his stolen base:

The thing I find most entertaining is how loose everyone seems, goofing off and laughing about the play that just happened, which seems relatively rare in this day of boring interviews and generic soundbites. Molina had a good laugh about that one, but he was pretty upset about the more recent stolen base.

There’s nothing to be mad about, though; Martinez and Molina simply got burned by the best baserunner in the game right now.


The Clint Hurdle Effect? – The Pirates’ Improved Defense

The success of the Pirates has become arguably the biggest narrative of this season. They sit pretty at 67-44, with a game and a half lead on the St. Louis Cardinals. While some fans of the Pirates are merely thirsting for fourteen more wins to guarantee the end of the 20-year losing skid, analysts widely regard the Pirates as playoff-bound, if not contenders for the division.

Presently, we’ll continue the endless discussion of why the Pirates have succeeded thus far, but perhaps with a new spin.

The Pirates have been trending up under the tenure of Clint Hurdle, but a closer look at the numbers doesn’t necessarily indicate an offensive success, but a noticeable improvement in the defense.

Run Differential

In 2010, the last season before Clint Hurdle, the Pirates finished 57-105 with a despicable -279 run differential. Since then, the run differential has improved incrementally to -102 in 2011 and -23 in 2012, when finishing .500 felt inevitable. This year, the Bucs have outscored their opponents by 49 runs, which isn’t much, but is in an improvement over where it was on August 3rd in 2010 (-205,) 2011 (-12,) and 2012 (+33.)

Metrics

Additionally, a look at some of the advanced metrics indicate an improvement in the defense of the Pirates. In 2010, the Pirates had -77 DRS and a -7.7 UZR/150. In 2011, that improved to -29 and -3.5 (respectively,) and in 2012, -25 and -2.6. Still not great numbers, but they reflect an ostensible difference under Clint Hurdle. In 2013, these numbers are all in the green: 43 DRS, 5.1 UZR/150. Obviously, these are subject to change, but the trend continues.

BABIP

Perhaps it is an illogical step to go backwards from advanced stats like DRS and UZR/150 to one as simple as BABIP, but it seems to me that this one sticks out the most and combines the picture of improved pitching and an improved defense. The noticeable trend has continued, as these are the defensive BABIPs of the Pirates over the last few years:

2010: .311

2011: .300

2012: .286

2013: .270 (1st in MLB)

My simplistic mind appreciates BABIP in this particular instance, because this tells me something clear. These numbers are microcosmic of the fact that the Pirates are improving in the area of simply converting batted balls into outs, and that is nothing but a good sign for a club looking to win games, but it is especially good for a club with the offensive woes the Pirates endure.

Say what you will about the overuse of the Pirates bullpen, and it will not be argued at present. It is my hope that someone can combine these defensive numbers with pitch f/x data and create a more clear picture of how the Pirates have succeeded with a group of ragamuffins. This is a start to a conversation and hopefully a case study into the effectiveness of a good defense and how it can counteract and overcome an anemic offense such as that of the Bucs. We may just see how it works out in the postseason.


Do Catchers Influence Pitcher Performance? The Story of Spanky and Sluggo

From Opening Day to April 20th, Red Sox pitchers posted a 7.14 ERA when Jarrod Saltalamacchia was behind the plate versus a 2.40 ERA when Jason Varitek started. The resulting hubbub about this split made one fact extremely clear, when comparing the influence of different catchers, sample size is really really important.

Already by June 24th, Varitek and Salty’s split has been greatly reduced, with pitchers now throwing a 3.44 ERA to the veteran captain and a 4.36 ERA to the new guy. I would bet that these numbers will continue to converge as the season drags on, but even after 182 games it’s unlikely that either catcher will have enough innings to statistically test whether one is calling a better game. This is the difficulty of assessing catcher performance: comparing catchers between teams is near impossible (because the pitching staffs are different), and comparing catchers within teams is difficult (because sample sizes are small and different pitchers use different catchers). Nevertheless, many still believe that catchers do influence pitcher performance. Where can we find the data to support this hypothesis?

Read the rest of this entry »