Archive for oakland athletics

Marcus Semien Looks Remarkably Different

Marcus_Semien_on_August_15__2015.0.jpg

Marcus Semien on August 15, 2015 / Keith Allison, Wikimedia Commons

Over the course of his career, Marcus Semien has been nothing if not consistent. It’s quite remarkable, really — the 28-year-old shortstop has posted between a 95 and 98 wRC+ in each of his three full seasons (and one half season) since being traded to the Oakland Athletics by the Chicago White Sox in 2014. He has long provided a modest blend of power and speed, and his well-documented defensive improvements last year boosted him to a career-high 3.7 WAR and placed him squarely in the tier of not-great-but-pretty-darn-good shortstops in a league flush with some pretty darn good ones.

It may seem a bit strange, then, to suggest that such a player could be on the verge of a breakout, having already “broken out” last year and being on the wrong side of baseball’s aging curve. And yet, in the early weeks of the 2019 season, Semien appears to be suggesting that he is ready to do just that.

A bit of context: Semien has really flashed all the various facets of his potential at one time or another as he’s settled into a regular at shortstop for the A’s, but he hasn’t quite managed to put together a season that has wrapped it all up. He knocked 27 home runs in 2016 (although there was little in his batted ball profile to suggest any sort of adjustment), has consistently stolen around a dozen bags a year, and takes walks at a rate a tick or two above league average (8.2% across his career) — plus the aforementioned improvements on defense.

But, I ask you, what if he made a little more contact? Contact is good for hitters! It’s generally something you strive for. Allow me to present you with an incredibly simple graph:

That is what we in the industry (which one? Not sure) like to call “trending in the right direction.” A career-best 11.2 K% plus a stellar 10.3 BB% have helped Semien hit the ground running in 2019, posting a line of .311/.379/.505 over 116 plate appearances. Am I suggesting that Semien is going to hit .310 for the rest of the year? I am not (yet). Am I suggesting that an early display of improved plate discipline from him could foreshadow a step forward for him this year? We’re getting warmer! Read the rest of this entry »


The Athletics Traded for Blake Treinen and Built a Dominate Reliever

Last July when the Oakland Athletics traded for Blake Treinen, Jesus Luzardo, and Sheldon Neuse, providing the Washington Nationals the services of relievers Sean Doolittle and Ryan Madson, the Athletics trade was more notably about the prospects of Luzardo’s pitching and Neuse at third base. The Athletics are in the middle of a definitive rebuild; outside of the Athletics organization, the Treinen piece of the trade was simply for his services as a simple bullpen body to hit average (hopefully) and pander on through the remnant of the season as Doolittle and Madson’s replacement.

Contextually, when the trade occurred last July, Treinen was 28 and hitting his ceiling in the Nationals development methodology. He lost hit job in April of 2017 then slowly settled into an awful 5.73 ERA with 48 allowed hits in the first half. There is no magical analytic which explains why he was bad, no pedantically bad situational deterioration – Treinen was simply bad.

Specifically, Treinen was bland on his first pitch (which is a telling sign of a pitcher struggling), lofting sweet, contact worthy pitches to the upper zone. Overall, batters swung and made contact throughout his first-pitch zones. Hence, the same area that created his bizarre downward trend was the first area where Treinen began his 2018 correction. He has cut high zone pitches on the first-pitch count, aptly cutting contact to the high zone. Batters are attacking his first pitch less, taking (or trying to take) a more principled approach to seeing him out.

The batting delay has created Treinen’s most formidable analytical point: the second highest and lowest qualified-reliever swinging strike rate and ERA at 18.8 percent and .93, respectively.

Any improvement this stark demands a resurgence across all pitching categories. First, Treinen has begun to shift his fastball placement. In 2017, on a micro fastball scale, Treinen offered either the fastball outside (44 percent balls) or distinctly inside (76.1 percent contact), failing to hit the lateral sides of the inside zone. That crisp distinctness allowed batters to perceive where his fastball was going to land, allowing a 156 wRC+. In 2018, he has avoided letting the fastball fall distinctly outside of the zone (30 percent balls, 72.7 percent contact), thus offering more variety within more controlled movement. His fastball has kept batters to a negative 20 wRC+.

When batters have been contacting his fastball, they have a 47.1 percent fly-ball rate. Perceptually, this is an alarming rate, less that placement becomes intrinsically important. In a string of reactions, Treinen is enforcing a greater chase rate (38.7 percent, increase from 30.8 percent) while decreasing his chase contact rate from 52.2 to 38.6 percent. This has cut the ability of batters to find barrel contact (2.1 percent), thus cutting his opposite field hit-rate to 19.8 percent. In short, Treinen is deriving contact that is easy to field.

Hypothetically, this might be a philosophical adjunct to the Athletics analytic mantra. The team is shifting on 30.4 percent of left-handed batters, an increase from 17.1 percent last season with the Washington Nationals. Neither team shift at a dramatic rate, but there is a slight difference between the Nationals fielding chart and the Athletics fielding chart behind Treinen. The slight difference may not be the main reason, but the Athletics awareness of how to help Treinen with more movement is, at minimum, an interesting note.

However, for all the jovial notation Treinen’s fastball is receiving, his main-pitch, the sinker, deserves even more praise. He has kept batters to a .200 average, already hitting 17 strikeouts on the sinker for a 56 wRC+. Much like the fastball, the sinker is moving less, but in a crisper fashion (9.7 rating down from 11.9). On a meta point, Treinen is simply more confident and educated in his pitching approach – on a simple eye-test, he is perceptually prepared where to throw. Scrupulous timing and more variety in placement of his sinker has lowered contact to 71.1 percent (was an egregious 86.2 percent last season). The one data-point which fundamentally incorporates how good his sinker has been is the increase in outside swing percentage (43 percent) while decreasing outside-contact (52.1 percent).

In short, pitches that were not meant to be hit, were being hit in 2018, and Treinen has prevented that from occurring. Fundamentally, this is on the breadth of a slight mechanical edit observable with a release point grouping to the right. In the example provided, between 2017 and 2018, Treinen is releasing his pitches with more elevation, signifying a change to his release philosophy.

The Athletics somehow have tapped into Treinen to bring out the best of him; the only question they have to answer is whether he is trade-bait or a long-term staple to the bullpen.


The Future is Bright, But Will the A’s Compete in 2015?

The Oakland Athletics may have finally completed their roster turnover on Wednesday with their most recent deal sending Yunel Escobar to Washington for RP Tyler Clippard. However, you can never know if Billy Beane is finished making moves. With that being said, I’d like to break down the roster from last year to this year and assess whether or not the team will actually regress in 2015. The fact is that the Athletics got quite a bit younger this offseason and acquired many players with a lot of team control remaining. The distant future appears brighter now than it did prior to this offseason, but the main question is, will the Athletics be able to compete in 2015 as well as they would have prior to the roster turnover? Lets take a look at the numbers:

STARTING LINEUP

I will start by comparing the most common nine players in the A’s lineup last year to their projected starting nine this year, using WAR and wRC+:

[All stats give on the chart will represent the 2014 season in the MLB only. In further commentary I may bring up career numbers or minor league numbers for some players.]

2014 WAR wRC+ 2015 WAR wRC+
C – Derek Norris 2.5 122 C – Stephen Vogt 1.3 114
1B – Brandon Moss 2.3 121 1B – Ike Davis 0.3 108
2B – Eric Sogard 0.3 67 2B – Ben Zobrist 5.7 119
3B – Josh Donaldson 6.4 129 3B – Brett Lawrie 1.7 101
SS – Jed Lowrie 1.8 93 SS – Marcus Semien 0.6 88
LF – Yoenis Cespedes 3.4 109 LF – Sam Fuld 2.8 90
CF – Coco Crisp 0.9 103 CF – Coco Crisp 0.9 103
RF – Josh Reddick 2.3 117 RF – Josh Reddick 2.3 117
DH – Alberto Callaspo -1.1 68 DH – Billy Butler -0.3 97

2014 AVG WAR = 2.1 / Total wRC+ = 929

2015 AVG WAR = 1.7 / Total wRC+ = 937

As shocking as it may seem, this displays that the A’s should in fact score more runs with their lineup in 2015 than they did with Donaldson, Moss and Cespedes in the heart of their lineup last season. Although, this chart only accounts for 2014 stats, in which Billy Butler (among others) had an off year. If the A’s can get him back to, or even near his 2012 form, in which his WAR was 2.9 and his wRC+ was 139, they could be in for a significant upgrade on offense as a whole. One of the reasons why this lineup has the potential to be more successful even after losing a guy like Donaldson is because of the acquisition of Ben Zobrist. While Brett Lawrie is -4.7 to Donaldson in WAR and -28 to Donaldson in wRC+, Zobrist is +5.4 to Sogard in WAR and +52 to Sogard in wRC+, more than making up for the loss of Donaldson. While the A’s did use a lot of other DH besides Callaspo in 2014, he totaled the greatest amount of plate appearances from that spot, which might lower the 2014 numbers a little.

The average WAR is down slightly from last season, but with Stephen Vogt behind the plate and Marcus Semien most likely getting the every day job at SS, the A’s feel they are upgrading defensively. Semien’s numbers represent his slim 255 plate appearances in the majors last season, but in TripleA his wRC+ was 142. You cannot expect that out of Semien at the major league level, but it shows that he has potential to improve in 2015. The A’s did use a lot of players at each position last season and they will again in 2015; that is why it is important to also take a look at the bench players from last year and the projected bench for this year.

BENCH

While the 25-man roster is not set in stone for 2015 just yet, here is last year’s most commonly used bench players versus next year’s projected bench.

2014 WAR wRC+ 2015 WAR wRC+
Nick Punto 0.2 73 Craig Gentry 1.4 77
Craig Gentry 1.4 77 Josh Phegley 0.2 92 – 132(AAA)
John Jaso 1.5 121 Eric Sogard 0.3 67
Sam Fuld 1.3 73 Mark Canha N/A 131(AAA)

2014 AVG WAR = 1.1 / TOTAL wRC+ = 344

2015 AVG WAR = .48 / TOTAL wRC+ = 367(407)

While these numbers are a bit skewed due to the fact that Canha has not yet reached the majors and also because Jaso was actually a starter while he was healthy, they do give a good idea of what to expect in 2015. Sogard takes over for Punto as the reserve infielder. Fuld and Gentry will most likely platoon in LF, same goes for Vogt and Phegley at C. Since Fuld and Vogt are LH, they will see more time in the starting lineup, leaving Gentry and Phegley on the list of bench players for 2015. Gentry and Phegley will see most their time against lefties, which will likely help their overall numbers. The A’s always do a great job shifting their lineup to create the match ups they want, expect more of the same with platoons and late pinch hitting in 2015.

STARTING ROTATION

The starting rotation is an area where a lot of people say they A’s have question marks. This may be due to the fact that they lost Jon Lester and Jason Hammel to free agency and traded away Jeff Samardzija to the White Sox earlier this off season. However, the A’s held the best record in baseball for months in 2014 with a rotation featuring Sonny Gray, Scott Kazmir, Jesse Chavez, Drew Pomeranz and Tommy Milone. Four of those guys will be returning in 2015, with a slew of other young arms fighting for a spot in the rotation. Anyone from Chris Bassitt, Jesse Hahn, Sean Nolin or Kendall Graveman would be an upgrade or at worst an equal replacement of Milone. Let’s take a look at the numbers for the five players who started the most games for the Athletics last season VS the A’s projected rotation for next season using ERA, WHIP and WAR from the 2014 season:

2014 ERA WHIP WAR 2015 ERA WHIP WAR
Sonny Gray 3.08 1.19 3.3 Sonny Gray 3.08 1.19 3.3
Scott Kazmir 3.55 1.16 3.3 Scott Kazmir 3.55 1.16 3.3
Jesse Chavez 3.44 1.30 1.7 Jesse Hahn 2.96 1.13 0.8
Jeff Samardzija 2.99 1.07 4.1 Jesse Chavez 3.44 1.30 1.7
Tommy Milone 4.23 1.40 0.4 Drew Pomeranz 2.58 1.13 0.7

2014 AVG: ERA = 3.46 / WHIP = 1.22 / Avg WAR = 2.56

2015 AVG: ERA = 3.12 / WHIP = 1.18 / WAR = 1.96

Keep in mind that ERA and WHIP are better when they are lower and WAR is better if it is higher. While this list does not consist of Jon Lester, the A’s were at their best when they still had Chavez and Milone in their rotation. Also, it was a small sample size for Pomeranz, so we cannot expect numbers quite that solid again in 2015. However, with all that being said, the A’s, despite losing All-Stars, should not take more than a tiny step back in 2015. This rotation is still very solid and is in fact younger this year than last. Not only that, the A’s now have a lot more depth with three other pitchers not on this list that could fill a rotation spot, Chris Bassit, Sean Nolin and Kendall Graveman. Also, we cannot forget about the Tommy John rehabbers Jarrod Parker and AJ Griffin, who could make their way back into this rotation before the All-Star break. Both Parker and Griffin were huge contributors to the A’s success in both 2012 and 2013.

BULLPEN

There are a lot of similar faces coming back to the Athletics’ bullpen in 2015. So, instead of continuing with the format I’ve used for position players and the starting rotation I’m quickly going to compare Luke Gregerson and Tyler Clippard, the one main difference in the bullpen for 2015.

Player ERA / WHIP / WAR

Luke Gregerson 2.12 / 1.01 / 0.9

Tyler Clippard 2.18 / 1.00 / 1.5

These numbers are very similar, making Clippard a perfect replacement for Gregerson, taking over the 8th inning duties in front of incumbent closer Sean Doolittle. I don’t think many people expected the A’s to make a move to acquire another back end of the bullpen piece. Even after losing Gregerson, they seemed to have a very solid bullpen, but now it is even more solidified with a proven set-up man in Tyler Clippard. Another important thing to note about Clippard is his ability to create fly balls. His FB% in 2014 was 49.4% also, his IFFB% was 19.3% and that will likely increase mightily with him now pitching in Oakland. He is the perfect pitcher for the o.Co Coliseum. The A’s will pay Clippard more than they would have paid Escobar in 2015, but they are saving money in the long run due to the fact the Escobar is owed 14 million over the next two seasons and Clippard becomes a free agent after this season (in which he will make around 9 million).

Now let’s take a look at 12 potential options for the Athletics bullpen in 2015. Some of them are locks, but the others will either gain a spot due to the fact that they did not make it into the rotation or if they have a solid showing in spring training.

Name Team (2014) IP ERA WHIP WAR
Sean Doolittle Athletics 62.2 2.73 0.73 2.4
Tyler Clippard Nationals 70.1 2.18 1 1.5
Dan Otero Athletics 86.2 2.28 1.1 0.7
Chris Bassitt White Sox 29.2 3.94 1.58 0.7
Fernando Abad Athletics 57.1 1.57 0.85 0.6
Ryan Cook Athletics 50 3.42 1.08 0.3
Eury De la Rosa Diamondbacks 36.2 2.95 1.39 0.2
R.J. Alvarez Padres 8 1.13 1 0
Kendall Graveman Blue Jays (AAA) 38.1 1.88 1.02 N/A
Sean Nolin Blue Jays (AAA) 87.1 3.5 1.25 N/A
Eric O’Flaherty Athletics 20 2.25 0.95 -0.1
Evan Scribner Athletics 11.2 4.63 0.94 -0.2

There are a lot of very solid options for the A’s bullpen in 2015. I’d expect to see, Doolittle, Clippard, O’Flaherty, Cook, Otero and Abad for sure, but I expect all of these guys to make an impact at some point, if not this season then in 2016.

TAKEAWAY

The Athletics have a very deep pitching staff. With Sonny Gray and Scott Kazmir headlining the rotation, they have a plethora of options to fill the remaining three spots. Pomeranz, Hahn and Chavez look to be the leading candidates, although Billy Beane himself has mentioned Kendall Graveman as someone he sees making the rotation out of spring training. The A’s also have a very strong bullpen, especially after the recent acquisition of All-Star set-up man Tyler Clippard. After losing Josh Donaldson, Brandon Moss, Yoenis Cespedes and Derek Norris (four All-Stars), the A’s lineup for 2015, according to wRC+ actually got better. It’s not always the big name All-Stars that make a team successful. Oakland has proven this many times in the past, most recently in 2012, right after an offseason makeover similar to this year’s. The one piece that has remained since before the 2012 makeover and after this 2015 makeover, is Coco Crisp. There cannot be enough said about the value of Crisp to the A’s organization. With Crisp healthy in CF and the newly acquired pieces filling in around him, I expect the A’s to be back competing for another American League West division title in 2015.


Why Haven’t the A’s had Any Good Pitch-Framers?

The ability to quantify the value of catcher framing has been one of the biggest sabermetric breakthroughs of the last decade. By parsing through PITCHf/x data, analysts like Mike Fast, Max Marchi, Dan Brooks, and Harry Pavlidis have managed to shed light on which catchers are adept at turning balls into strikes, uncovering hidden value in otherwise unremarkable players, including Rene Rivera, Chris Stewart, and of course, Jose Molina.

MLB front offices have taken notice. Several teams, including the Yankees, Rays, Red Sox, Pirates, Padres, and Brewers have begun hoarding good-framing catchers over the past few years. But one team that’s missing from this list are the Oakland Athletics, who have historically been among the first adapters of sabermetric principles. One would think that the A’s would be all over the Jose Molina‘s and Chris Stewart’s of the world, yet Billy Beane and co. seem to have missed the memo on acquiring good framers. In fact, they’ve made a habit of employing poor ones. According to Baseball Prospectus‘ model, A’s catchers rank fourth from last in framing runs saved this season. This isn’t a one year anomaly, either. Here’s a look at all of the catchers the A’s have used since 2010, along with their career framing numbers.

Catcher Innings Share of A’s Innings FR Runs per 7,000
Kurt Suzuki 2,929 42% -9
Derek Norris 1,854 27% -1
John Jaso 755 11% -16
Landon Powell 540 8% -10
Stephen Vogt 421 6% -4
George Kottaras 217 3% -8
Anthony Recker 125 2% -17
Josh Donaldson 71 1% -9
Jake Fox 59 1% -15

That right there is a pretty sorry group of framers. There’s not a single catcher in the group who’s even above average. So what gives? Why has Billy Beane — who’s nearly synonymous with the term “market inefficiency” — been so reluctant to exploit the latest market inefficiency?

As far as I can tell, there are two possible explanations, and the real answer is probably some combination of the two:

1) The A’s have chosen to employ catchers who excel in areas other than pitch-framing.

2) The A’s aren’t completely buying into all of this pitch-framing stuff.

Let’s start with the first explanation. Since 2010, A’s catchers have accumulated 12.1 fWAR (which doesn’t account for framing), putting them 15th out of 30 MLB organizations. But since 2012, the year after Mike Fast’s research first brought the value of pitch framing to the public’s eye, the A’s rank 10th. The average wRC+ from a catcher is 93, but the A’s have done much better than that of late by employing guys like John Jaso (136 wRC+) and Derek Norris (110 wRC+). Even if you were to dock the Oakland’s catchers for their poor framing skills, they’d still fall somewhere in the middle of the pack in terms of total value. Basically, the A’s have managed to find good, cheap catchers, who generate value in ways other than framing pitches. Plus, for all we know, the A’s might have reason to believe these guys excel in other overlooked areas. They could be superb game callers, for example.

But that can’t be all that’s going on. Sure, the A’s have done a decent enough job of finding catching talent without prioritizing framing, but it’s not like they’ve had Mike Piazza or Johnny Bench behind the plate. Jaso and Norris are fine players, but aren’t exactly superstars. Plus, it should tell us something that they haven’t even brought in any bottom-of-the-barrel framing specialists. Eric Kratz or Chris Stewart were both traded for warm bodies last winter, but the A’s instead chose to roll with Vogt as their primary catching depth.

Perhaps the A’s have reason to believe that publicly available framing models overstate the value-add of a framed pitch? As Dave Cameron recently pointed out, its not entirely clear if the full value of a framed pitch should be attributed to the catcher, with none of the credit going to the pitcher. Current models don’t account for how a pitcher might change his approach based on the framing abilities of his catcher, and research shows that pitchers do in fact change their approach based on who’s catching, throwing a few more pitches outside of the strike zone:

Framing

Oakland’s brain trust is about as progressive as they come, and have a proven penchant for unearthing value from unlikely places. When a team like that zigs while others zag, it probably makes sense to ask why. This isn’t to say that the publicly-available framing data is useless, as having a good framer undeniably adds some value, even if it’s only a few runs. But the fact that the A’s have yet to employ a single plus framer should lead us to wonder if there’s a piece of the puzzle we might be missing.

Statistics courtesy of FanGraphs and Baseball Prospectus.


The A’s Declining Offense

Take a turn around Twitter or any major baseball news source and you’ll hear a familiar echo about the former best team in baseball; the offense hasn’t been the same since the deadline.  When the A’s traded away Yoenis Cespedes for Jon Lester, the impact to the lineup was noticeable.  They wagered they could get the same level of production out of some combination of Jonny Gomes, Stephen Vogt, and Sam Fuld.  In the first half of the season, the A’s were a top-six team in wOBA, OBP,and wRC+ all while being second to last in BABIP.  It’s safe to say they were rolling. Now they aren’t.  Since the deadline, the A’s have become a bottom-third team in all the aforementioned stats.  It’s easy to look at these stats and say that Cespedes was clearly the catalyst of something in the offense.

While much has been written about the rumors of Oakland emphasizing clubhouse chemistry the last couple years, Cespedes has never really been written as one of the chief leaders in that category.  We typically hear names like Coco Crisp, Scott Sizemore, the aforementioned Jonny Gomes, and Sean Doolittle mentioned there.  Cespedes by all accounts was just a crazy athletic guy who didn’t really cause any trouble, but wasn’t exactly a team leader.  Yet the fact remains: the A’s have refused to hit since the deadline. Sure, 17 games isn’t a gigantic sample size, but it’s pretty reasonable when evaluating team performance.  Baseball Prospectus just three years ago theorized that a reasonable prediction could be made of a team’s overall season after fifteen games,  so we’ve got something substantial to work with.  Is there another pattern, though?  Let’s take a look at the team’s month by month performance.

A’s wOBA wRC+ OFF WAR
April 0.339 119 25.2 7.3
May 0.330 113 15.6 5.8
June 0.314 102 2.6 4.1
July 0.312 100 0.2 3.4
August 0.288 84 -11.1 1.5

We see a steady decline here in the A’s performance, not a sudden jump.  The A’s started off really hot, leading the league in most offensive categories in April.  A notable decline can even be seen in May, as the A’s began their meteoric rise to the top, though they held steady in the top three in most categories.  In June, the team dipped even further, down to a mark that was only slightly above average.  They looked to be leveling off there to a rather league-average team in July, which wasn’t encouraging, but maybe suggested a possible rise back up to looking like a playoff team. In August, though, the wheels have come off.  The A’s have dipped below league average in most categories, and their win totals have suffered as well.  Can we blame all of this on Cespedes?  Let’s take a look at some wOBA numbers for chief contributors to the Oakland offense:

It’s a bit cluttered, but the dark blue line in the middle labeled wOBA is the team as a whole; see the steady decline as we’ve noted.  In April, we see all of these guys hovering between a .300 wOBA and somewhere above .420.  Nearly all of them are now either .300 or far below it; the one exception being Josh Donaldson, who has picked it up again since a dismal June.  Even Cespedes, having been traded to the Red Sox, is having an unremarkable August since performing poorly in July.  Let’s take a look at a wRC+ graph, with some of the members removed for clarity:

Here we see six players who routinely batted in the top five in the batting order having horrible Augusts.  Stephen Vogt and Brandon Moss, two lefty platoon bats being pressed into full-time duty in the outfield lately, lead this group with a 91 wRC+, which is below the average line.  John Jaso, Coco Crisp, and Derek Norris have been downright horrible, with wRC+’s in the barely digestible territory. So yes, the A’s have been bad since Cespedes has left the team.  It’s clearly not just the loss of his bat; the vast majority of the team, outside of Josh Donaldson and the surprisingly resurgent Eric Sogard and Josh Reddick, have been really, really bad.

So if the whole team is flailing, perhaps Cespedes was more of a sparkplug than we previously had attributed?  More importantly, did Billy Beane fail to see a trend here?  The A’s were trending downwards in hitting as demonstrated, so why the need for pitching?  Well, the A’s were unfortunately not exactly trending very well in pitching either.  They were third in pitcher WAR through April, but then plummeted to 19th in May, and further dipped to 21st in June before rising a bit to 17th in July. The A’s were a decidedly middle of the road team when it came to pitcher WAR, and FIP seems to agree, ranking them about the same spot everywhere.

So why make the trade?  If anything, this trade has only served to confuse fans.  What do we make of a team with three above-average catchers who all tank right after a trade for a top-flight starting pitcher?  While all the fans are clamoring for Jimmy Rollins to come and help the middle infield, we’ve got Eric Sogard being one of the few bright spots in the offense, and nobody seems to care. All we know is that the A’s are in trouble.  Whether it’s because Cespedes was the glue or because the A’s are peaking at the wrong time, they’re all of a sudden facing down the dire straits of a one-game coin flip at the end of the season, despite being the most aggressive pursuer at the trade deadline. The A’s can cling to a few bastions of hope; maybe their BABIP dropping all the way to .260 in August shows that they’re just a bit unlucky.  It’s either that or face the fact that sometimes the best-laid plans of mice and men fail, and pray that Jason Hammel doesn’t have to start the Wild Card game.


The Impact of Defensive Prowess on a Pitcher’s Earned Runs Average

EXECUTIVE SUMMARY

  • This study attempts to determine how much the fielders’ prowess, measured by the metric UZR (Ultimate Zone Range), affects a pitcher’s Earned Runs Average.
  • The data used for the regression (collected from FanGraphs.com) includes collective ERA, BABIP, HR/9, BB/9, K/9 and UZR for every Major League Baseball team for the past three years.
  • ERA (Earned Runs Average) is the amount of earned runs a pitcher allows per nine innings pitched. BABIP (Batting Average per Balls in Play) is the batting average against any given pitcher, but only including the at bats where the hitter puts the ball in play. HR/9 is home runs allowed per nine innings pitched. BB/9 is walks allowed per nine innings pitched. K/9 is batter struck out per nine innings pitched. UZR (Ultimate Zone Range) is a widely used metric to evaluate defense. It summarizes how many runs any given fielder saved or gave up during a season compared to the league average in that position.
  • The model passed the F-test, the adjusted “R” squared came out at 91.2 percent and every one of the independent variables passed their respective t-test.
  • The model tested negative for both Multicollinearity (using Variance Inflation Factors) and Heteroskedasticity (using the second version of the White’s test).
  • The regression equation looks like this: ERA = -2.55 – 0.187 K/9 + 0.413 BB/9 +16.9 BABIP + 1.72 HR/9 – 0.00157 UZR. Even though the independent variable UZR has a low coefficient, it definitely affects a pitcher’s ERA, and in the way it was suspected. As the UZR goes up the ERA goes down.

INTRODUCTION

Since Bill James started to write about baseball in the late 1970’s and started to defy the traditional stats used to evaluate players, hundreds of baseball fans have tried to follow his footsteps creating new ways to evaluate players and defy the existing ones. One of the stats that has been brought to light lately is Earned Runs Average (ERA).

According to several baseball analysts ERA is not an efficient way to evaluate how good or bad a pitcher performs. The rationale behind this thinking is pretty simple; ERA is the amount of earned runs that any given pitcher allows per nine innings pitched, but the pitcher is not always 100 percent responsible for every earned run allowed. Sometimes, a fielder’s lack of defensive prowess will allow hitters to reach base safely (I am not talking about errors), and when it happens, rather often, those hits will translate into earned runs, thus affecting the pitcher’s ERA.

One of the metrics that has been used to determine any given fielder’s prowess is UZR (Ultimate Zone Range). UZR compiles data on the outfielders arms, fielder range and errors and summarizes the amount of runs those fielders saved or gave up during a season compared to the league average in that position. Using that metric along with other metrics that affect the ERA, we can answer the question “How much does defensive prowess impacts a pitcher’s ERA?”

If in fact defensive prowess affects ERA, we could also determine how much it affects it. With that kind of information, cost-effective teams (Tampa Bay Rays and Oakland Athletics) can help improve their pitching staff without investing heavily on new pitchers.

DATA

The unit of observation for this study is one Major League Baseball team. And the number of observations is 90. Currently, there are 30 Major League Baseball teams, so data was collected for the past three Major League Baseball seasons. So the time period covered goes from 2010 to 2012, including both seasons.

The dependent variable used in this project was Earned Runs Average, and the independent variables are as follow:

  • BABIP: Batting average per balls in play
  • HR/9: Homeruns allowed per nine innings pitched
  • BB/9: Walks allowed per nine innings pitched
  • K/9: Hitters struck out per nine innings pitched
  • UZR: Runs saved or given up by any given fielder during a season

All the data for this study is cross-sectional because all the observations have been collected at the same point of time.

All the data for this study was collected from the baseball website FanGraphs.com. FanGraphs is a widely known source of baseball stats and news, but the data they publish on their website is collected by another company called Baseball Info Solutions.

REGRESSION ESTIMATIONS

            Regression Analysis: ERA versus BABIP, HR/9, BB/9, K/9 and UZR

The regression equation is

ERA = – 2.55 – 0.187 K/9 + 0.413 BB/9 + 16.9 BABIP + 1.72 HR/9 – 0.00157 UZR


Predictor       Coef         SE Coef              T           P             VIF

Constant      -2.5474     0.5594        -4.55    0.000

K/9              -0.18718    0.02428     -7.71     0.000    1.099

BB/9            0.41261     0.04671        8.83     0.000    1.052

BABIP          16.914        1.876             9.02     0.000     1.741

HR/9            1.7222       0.1105          15.58    0.000    1.180

UZR        -0.0015743  0.0006219  -2.53  0.013       1.669


S = 0.133650   R-Sq = 91.7%   R-Sq(adj) = 91.2%


Analysis of Variance


Source                  DF        SS            MS              F             P

Regression          5     16.5663   3.3133   185.49   0.000

Residual Error  84   1.5004     0.0179

Total                     89   18.0668

The first step used to evaluate the model was the F-test, and since the model has a p-value less than 0.05, it is safe to say that the model passed the F-test. The adjusted “R” squared for the model was 91.2 percent, which means that 91.2 percent of the variation in ERA is explained by at least one of the independent variables used in this model. The method used to evaluate the relevance of the independent variables was the t-test, and each one of them, as mentioned earlier, had a p-value below 0.05, so in conclusion, they all passed the t-test. The p-value for K/9, BB/9, BABIP and HR/9 was 0.000 for each one of them, and the p-value for UZR was 0.013.

MODEL ESTIMATION SEQUENCE

  1. Correct functional form: To check for correct functional form, each one of the independent variables was plotted against the dependent variable. The scatter plots that resulted from this check show a linear relationship between each one of the independent variables and the dependent variable.
  2. Test for Heteroskedasticity: The data for this study is cross-sectional, so it was necessary to test for Heteroskedasticity, and such test was conducted by the second version of White’s test. To do so, the residuals for the original regression were stored. Those squared residuals were regressed against the Independent variables and the independent variables squared. After running the regression, an the F-test was applied to it and since the p-value was over 0.05, it can be concluded that the regression fails the F-test, therefore Heteroskedasticity does not exist in the initial model.
  3. Multicollinearity: This model also tested for Multicollinearity and it is done by using the correlation matrix and the Variance Inflation Factors, observed in the initial regression.
    1. Since none of the VIF’s is larger than 10, it can be concluded that Multicollinearity does not exist and the p-values from the t-tests can be trusted.
    2. A correlation matrix was calculated using all the independent variables but since every one of them passed the t-test, none will be dropped from the model.
  • K/9: p-value (0.000), VIF (1.099), rho (0.252)
  • BB/9: p-value (0.000), VIF (1.052), rho (0.195)
  • BABIP: p-value (0.000), VIF (1.741), rho(0.604)
  • UZR: p-value (0.013), VIF (1.669), rho (0.604)
  1. Drop any irrelevant variable from the model: Since all the independent variables in this model are relevant, none of them will be dropped from the model.

FINAL MODEL

The final model is exactly the same as the initial model because the it passed the F-test, all of the independent variables passed their t-tests and neither Heteroskedasticity or Multicollinearity are present in the model, so it was not necessary to run another regression or drop any variable.

COEFFICIENT INTERPRETATION

  • K/9: When the team strikes out one extra batter per nine innings, the team’s ERA should go down by 0.187 runs per nine innings holding everything else constant.
  • BB/9: When the team walks one extra batter per nine innings, the team’s ERA should go up by 0.413 runs per nine innings holding everything else constant.
  • BABIP: If every time a batter puts the ball in play he records a hit, the ERA will go up by 16.9 runs per nine innings. This variable is hard to explain since it will never go up by 1, it will go up or down depending on how many hits the team allows in any given number of at-bats where the batter puts the ball in play. For example, if a team averages eight hits every 27 outs, the BABIP will be 0.296 throughout the entire season. Taking into account that every batter put the ball in play (no strikeouts). The expected increase in ERA given a 0.296 BABIP during a season, and holding everything else constant, would be 5.00.
  • HR/9: When the team allows one more homerun per nine innings, ERA should go up by 1.72 runs per nine innings holding everything else constant.
  • UZR: When the team saves one extra run defensively, ERA should go down by 0.00157 runs per nine innings holding everything else constant.

SUMMARY

The null hypothesis for this project stated that defensive prowess didn’t affect ERA, but the results showed otherwise, so it is safe to reject the null hypothesis. Defensive prowess appears to affect ERA although in a small scale. This might not seem like much, but cost-effective teams like the Rays and Athletics can acquire premium defensive players at a much cheaper cost than a premium pitcher, and although they won’t be “game changers,” they will definitely improve the team’s ERA.

Baseball is a game of numbers, and these numbers don’t lie. A good defender will help his team save runs; a lot of good defenders will help their team save multitude of runs. Is this enough to get to the postseason or win a World Series? Absolutely not, but it has been proven already that finding edges in the game, as little as they might be, will help a team in the long run. The findings in this study are a concise proof that taking advantage of defense is an edge that can be exploited for the betterment of the organization.


A Different Way to Look at Strikeout Ability

Mike Podhorzer has looked into the relationship of a batters’ average fly ball distance as it relates to their HR/FB ratio, and has found results that will allow others to more accurately project a hitter’s home run totals from year to year.

This got me thinking. Which can be a good or bad, but in this case, the authors’ labor produced a fruitful return. While a hitters’ HR/FB ratio can fluctuate indiscriminately from year to year, Podhorzer has proven a batters’ average fly ball distance is a better indication of a player’s true talent power production. In the same light, my study looks at how a player’s swinging strike rate (SwStr%) is a better indication of a pitcher’s strikeout potential than K/9.

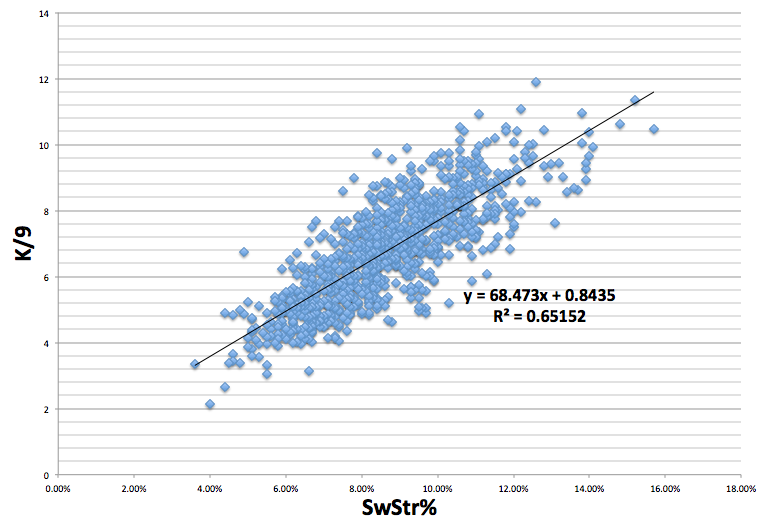
My assumption was that K/9 and SwStr% have a strong relationship. But, how strong of a relationship is it? To find this out, I took all qualified starter seasons from 2003 to 2013, which gave me a sample size of 933 pitchers, and ran a correlation between their SwSTR% and their K/9. The results showed that there is an exceedingly positive correlation between SwSTR% and K/9, to the tune of a .807 correlation coefficient and a .65 R2.

Screen shot 2013-10-03 at 1.06.11 PM

What is important to note is that there are very few pitchers present in the sample with a SwStr% above 13%, which may be symptomatic of something larger. Getting batters to swing and miss is difficult. The more often you can get a batter to swing and miss, the more valuable you are as a pitcher. As a result, the higher the SwStr%, the smaller the sample size becomes. For example, Johan Santana (2004) and Kerry Wood (2003) are the two lone dots to the farthest right on the graph with SwStr% of over 15: wow.

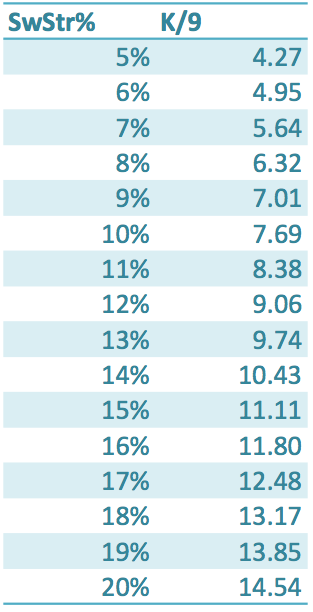
After the relationship between SwStr% and K/9 ratio became unmistakable, I calculated what a particular SwSTR%s translates into, as far as K/9, with the formula Y=68.473*x+0.8435, and got this chart:

Screen shot 2013-10-03 at 1.55.30 PM

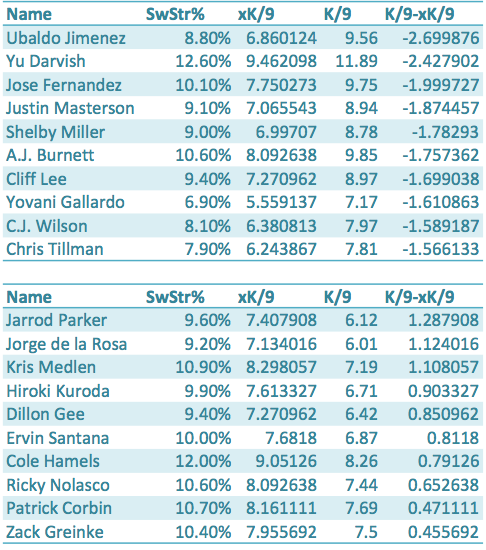
The next step is to take what we have discovered and apply it to a sample. The chart below shows each qualified pitcher for 2013, their SwStr%, xK/9, K/9, and K/9-xK/9.  xK/9 is what we would expect a pitcher’s K/9 to be based off of their SwStr%, and K/9-xK/9 shows us how much a pitcher over-performed or under-performed their SwStr% and xK/9.The first set of ten names are the pitchers who outperformed their xK/9 the most, and the second list of ten names are the players who underperformed their xK/9 the most.

Screen shot 2013-10-03 at 2.44.59 PM

The results show that Ubaldo Jimenez, Yu Darvish, and Jose Fernandez are the pitchers who have outperformed their xK/9 the most in 2013. These three pitchers also have great a great amount of deception and/or command (deception in Jimenez’s case: because, no one has ever called Ubaldo a control artist). And, while they may have outperformed their true talent in 2013 to an extent—they all had remarkable years—maybe that deception and control, which SwStr% does not take into account, leads to less swings by batters and more pitches taken for strikes, as opposed to swung at for strikes.

Perhaps xK/9 is more helpful when we look at pitchers who underperformed their SwStr%, like Jarrod Parker and Kris Medlen. Both of these pitchers had down years compared to what their projections suggested, but their xK/9s seem to be optimistic about their futures. Parker showed a .18 improvement in his K/9 from the first half to the second half of the season, while Medlen showed almost a full point improvement going from a 6.81 K/9 in the first half to a 7.67 K/9 in the second half.

While xK/9 may miss something—deception and command—when it comes to pitchers that outperform their SwStr%, xK/9 seems to find a reason to be optimistic when it comes to pitchers like Kris Medlen and Jarrod Parker who have underperformed their SwStr% and strikeout potential.

Devon Jordan is obsessed with statistical analysis, non-fiction literature, and electronic music. If you enjoyed reading him, follow him on Twitter @devonjjordan.