Archive for Minnesota Twins

Brian Dozier: Regression, Desperation, and what the Dodgers Provide

As Brian Dozier began a new month with his new Los Angeles Dodgers, it was apropos that Dozier would hit a single, double, and home run in his first game. For Dozier, the Dodgers, and specifically Yasmani Grandal walking off in the bottom of the 10th, August 1 was a magical sort of night. The Dodgers broke a three-game skid to overcome the  Brewers 6-4. regarding momentum, an establishment of tone for the month of August. Having just passed the trade deadline and tied with the Arizona Diamondbacks for the National League West, August represents a fresh start amid a long season – the line between exhaustion and giving the remainder of dwindling energy.

Los Angeles now has Manny Machado, Arizona now has Eduardo Escobar; two players who plug glaring holes to add that last substantive energy. Los Angeles, however, also obtained Brian Dozier – a second baseman who has simply regressed in hitting. He is in a season-long lull, hitting .229 with a .415 SLG, and a 95 wRC+ after finishing at .271, .498, and 125 in 2017. He has never relied on the luck of high BABIP and lucky placement, always an extremely successful hitter for the Minnesota Twins on his own merit. He simply fell flat in a flat batting order.

While not an objective point of analysis, Dozier might just need a change of pace in a new town to start finding the ball again. Open comments to the media regarding Minnesota being ‘comfortable’ and Los Angeles being a team in the race ‘rejuvenating me [Dozier] as a player’ provide surface-level follow-up for the ‘new city – new player’ philosophy.

Considering that Dozier is in the last year of his contract makes him only more of an enigma. The ‘contract-year’ is traditionally when batters inflate their statistics on a bad team for a massive contract in their later years. (Tradition in free-agency, being broken and a topic much written about). With Dozier doing the complete opposite, assuming he has the ability to rejuvenate his career, Los Angeles might be able to hide his genius and buy-low in free-agency. They have attempted to trade for Dozier the past two seasons, hence trading for Dozier has given a subtle chess piece to the Los Angeles front office for the 2019 season.

The importance of Dozier in the Los Angeles lineup is not about dazzling power. While chess piece might be a degrading term, for Dozier, it is a complement to its procedural efficiency. Second base has been Los Angeles’ worst position and Dozier will plug what has been a sloppy turnstile in the batting lineup.

On a micro-level, Dozier’s enigma of a collapse is across the board. He is making 11 percent more contact outside and three-percent less inside contact but is still contacting around 82 percent on the fastball. The only difference, a fall to a .259 from a .298 average. Despite making more contact on sinkers, 83.2 to 86 percent and two-percent less swinging-strikes, he is only hitting at a 126 wRC+ from a 171 wRC+. (And, yes, that is still above average, but a fall for Dozier).

The slider, a pitch never hit for average, has seen seven percent less outside-swings (26.6 to 19.9 percent) and a subsequent drop in outside-contact (60 to 51.2 percent). The result has been 52.4 percent in-field fly-balls, up from 22.2 percent. The worst pitch for Dozier this year has been the curveball, seeing a pitiful .054 average and -50 wRC+. This comes even as he is swinging less at the curve (39.6 to 32.2 percent).

The only pitch Dozier has seen an improvement on is the changeup, hitting at a .333 ISO (.128 in 2017) and a 178 wRC+ (120 in 2017). The main emphasis has been him attacking inside the zone five percent more. This is the same strategy which Dozier held in 2016, when he attacked the inside changeup at 69 percent and hit for a .338 ISO.

The subtle change in Dozier, however, is evident in his attack of the changeup. In 2018, Dozier has been attempting to hit opposite field for changeup power, with incredibly precise hits to right field. He also has gotten lucky on three infield hits. In 2017, however, Dozier was comfortable in pulling changeups to the left-field. While this has been a positive trend for the changeup, on a meta-level, Dozier’s fascination with hitting opposite is putting him on pace for more outs.

The following is a side-by-side comparison of balls resulting in outs for Dozier (per Baseball Savant), with 2018 on the left and 2017 on the right. He is avoiding pulling the ball, and as a result, has patterned his hits into a persistent pattern within a strangely linear line. The same comparison done on balls hit into play with no-outs is further evidence of Dozier attempting to hit balls to opposite field. In short terms, he is attempting to create distinct power by aiming the ball instead of just continuing to comfortably pull.

Conjoining the theory that Dozier will be better on a better Los Angeles roster with what can be termed as ‘futile desperation’ in attempts to hit opposite the field leads back to the subtle change within each micro-pitch. While the meta-level comparison is little changed for swinging percentage, very small, but important tweaks, in Dozier swinging outside exist. Hence, he is trying to walk more.

In other terms, Dozier has been on a bad team, and knowing so, has been attempting to take less risks outside so he walks more while also trying to create more emphatic power by targeting opposite field. He has been trying to mitigate Minnesota’s inefficiencies by playing tighter himself. While one game is hardly a good sample size, there may be an underlying psychological shift in Los Angeles which allows Dozier to relax and comfortably attack the ball.


J.D. Martinez Will Be Productive in Six Years (And Maybe Seven)

While baseball fans wait for the free agent market to finally unthaw, J.D. Martinez waits for a contract offer enticing enough for him to sign. Early reports suggested that Martinez and his agent, Scott Boras, set an early asking price at seven years, $210 million. Clearly, nobody has taken the bait. Among Martinez’ likely suitors, many have moved onto other options; the Cardinals traded for Marcell Ozuna, and the Giants traded for Andrew McCutchen, seemingly leaving the Red Sox as Martinez’ lone serious suitor.

The latest report, from Buster Olney, is that Martinez has an offer on the table from the Red Sox worth five years, $100 million. Taking the reports at face value (although Boras himself has simply declared the report “inaccurate”), the offer obviously comes up short of Martinez’ demands, which is why this article is being written in late January to begin with. To that end, here’s an excerpt from Jeff Passan’s recent column at Yahoo Sports on baseball’s economic system:

“Recently, one of the best free agents available this offseason met with a friend, and he admitted something shocking: He was preparing to sit out until the middle of the season. The market for his services this winter was so thin, the offers so incompatible with his production, that he worried he was going to need an external force to compel teams to pay him what his numbers say he’s worth. Maybe it would take a playoff race.”

Can we assume that the hitter in question is Martinez? Of course not, but considering the discrepancy between his asking price and the reported Red Sox offer, it wouldn’t be an outlandish guess. While I understand that the Red Sox have leverage in that they presumably don’t have anyone to bid against, I will argue that Martinez will be well worth a contract in excess of 5/$100M.

From 2014-2017, his Age 26 through  Age 29 seasons, Martinez posted an astounding 149 OPS+ (my apologies for not using wRC+ in this column!), with a low of 139 and a high of 166. To that end, I researched players from the DH era (circa 1973) that posted an OPS+ between 140 and 160 in their Age 26 through Age 29 seasons. Presumably, these players would make for suitable Martinez comps as we attempt to project his offensive production over the next five to seven years. Of course, some of these players are still active and haven’t played enough to give me complete data, such as Ryan Braun, so they have been eliminated from the dataset. I was left with 38 comparable players, which is a large enough sample for our purposes today.

In this chart, I condensed the sample into averages because 40 rows and 9 columns doesn’t embed so cleanly. These are Martinez’s comps for their age-26 through age-29 seasons, their offensive production for the next five years (through age-34, which is Martinez’ floor value at this point) and then their production in the sixth and seventh following years (ages 35 and 36, which represent Martinez’ ceiling value at this point).

J.D. Martinez Age 26-29 Comps Through Age 30-34, 35, and 36
Age Average OPS+ Average PA/Season Sample Size
26-30 147 637 38
30-34 134 559 38
35 124 512 36
36 117 447 33

The average player from my sample posted a 147 OPS+ in their age-26 through 29 seasons, which matches up neatly with Martinez’ 149 mark. You’ll first notice the drop off in production for these players in their age-30 through 34 seasons. There are several reasons for this. Yes, natural decline was at work, but the original search for Martinez comps included a 2000 plate appearance minimum; this means I was guaranteed to be given players both as good and as healthy as Martinez in their Age 26-29 seasons without the same guarantee they would be healthy in the years that followed. This also means players like Mark McGwire (146 OPS+ in 1913 PA) were excluded from the sample because he was injured, despite the 189 OPS+ he would put up in 3462 plate appearances through Age 36.

Nevertheless, it’s a reasonable regression one can expect for players entering their 30s, and the good news is that they were, on average, very productive (134 OPS+) and very healthy (559 PA). This is what the Red Sox believe to be worth 5/$100M, but I would argue that this data shows they should be willing to tack on a sixth year without blinking. Of the original 38 player sample, 36 players played their age-35 seasons; they were still very productive (Khris Davis has been producing along these lines the past two years) and healthy enough to play a full season.

The real question surrounding Martinez is – or at least should be, if the market weren’t so cold – whether he should be given a seventh year or not. From his comps, the sample size drops significantly for the first time down to 33, the average playing time falls below the league qualifying minimum for the first time, and the production drops below what you’d want from your DH (the reference point here would be Miguel Sano from the last couple of seasons).

At face value, I would absolutely give Martinez the sixth year, and absolutely not give him the seventh. At the same time, we should dive into our sample a little deeper and discover why some players did well and why others tanked in their 30s; perhaps there is something we can correlate with Martinez so we can get an even better projection. From the original sample, here are the twenty best performers in their age-36 seasons (based on a combination of plate appearances and OPS+).

Twenty Age-36 Producers
Rank Player OPS+ PA Rank Player OPS+ PA
1 Rafael Palmeiro 141 714 11 George Brett 123 528
2 Mike Schmidt 153 657 12 Robin Yount 102 629
3 Dave Winfield 159 631 13 Wade Boggs 142 434
4 Chipper Jones 176 534 14 George Foster 121 504
5 Carlos Delgado 128 686 15 Brian Giles 110 552
6 Jim Thome 150 536 16 Dave Parker 92 647
7 Bobby Abreu 118 667 17 Alex Rodriguez 111 529
8 Fred McGriff 110 664 18 Vladimir Guerrero 98 590
9 Eddie Murray 115 625 19 Ken Griffey 99 472
10 David Ortiz 173 383 20 Bernie Williams 85 546
Average 140 610   Average 107 543

The reason I picked the twenty best rather than the top and bottom ten is that the bottom ten would be littered with folks such as Cliff Floyd or Dale Murphy, who only came to the plate 17 and 63 times respectively during their age-36 seasons. Using the ten best players captures those who were magnificent offensive performers with full playing time. Using the next ten players captures those who were mediocre in full playing time. This looks good to me.

This would be the time for me to explain why I haven’t mentioned WAR in this piece: J.D. Martinez has been horrible on defense!

He was best suited as a DH years ago, but being on a roster with Victor Martinez and then being traded to the National League forced him to play right field, which depressed his value. If Boston signs him, he’ll see absolutely no time in an outfield that will be covered by Jackie Bradley, Mookie Betts, and Andrew Benintendi for the foreseeable future. As a DH for the rest of his career, Martinez will be solely judged by his offensive production and ability to stay on the field.

Again, our question is whether Martinez receiving a seventh year is justified. More specifically, this boils down to “In seven years, will Martinez be in the left column or the right column?” Both sides of the list contain incredible players, but there’s a way to make a reasonable projection. Here’s the same list, but instead of rank, you’ll see the positions these players spent significant time. Those who had significant time at 1B/DH are highlighted in gold.

Twenty Age-36 Producers (By Age)
Position Player OPS+ PA Position Player OPS+ PA
1B/DH Rafael Palmeiro 141 714 1B George Brett 123 528
3B/1B Mike Schmidt 153 657 CF Robin Yount 102 629
RF Dave Winfield 159 631 3B Wade Boggs 142 434
3B Chipper Jones 176 534 LF George Foster 121 504
1B Carlos Delgado 128 686 RF Brian Giles 110 552
DH Jim Thome 150 536 RF Dave Parker 92 647
RF/LF/DH Bobby Abreu 118 667 3B/DH Alex Rodriguez 111 529
1B Fred McGriff 110 664 DH Vladimir Guerrero 98 590
1B Eddie Murray 115 625 CF Ken Griffey 99 472
DH David Ortiz 173 383 CF/DH Bernie Williams 85 546
Average 140 610   Average 107 543

In this exercise, let’s consider 1B/DH to be significantly less stressful positions than the others. After all, there is a significant correlation between time spent in the field and sustaining an injury that leads to decline. While players like Brian Giles, Dave Parker, and Ken Griffey Jr. saw injuries and offensive decline catch up to them after years chasing down balls in the outfield, players like Rafael Palmeiro, Carlos Delgado, and Jim Thome aged extremely well by not exerting the same stress in the field.

Martinez is almost certain to spend no time in the field at Age 36. Hell, he might not spend much time in the field ever again. So I consider him a slam dunk to be placed in the group on the left. Referring to the averages from the first chart in this article, I’ll the over on Martinez when the time comes. To be clear, I donJD’t necessarily think he should be given the seventh year outright – an option would probably be most appropriate – but I think this data solidifies my comfort in giving him a sixth guaranteed year.

In a winter in which the market is changing in ways we have never seen before, it’s difficult to predict what  Martinez will earn. It’s important to remember that dollars are a construct; we can’t assume Martinez will get $150 million from the Red Sox because Adrian Gonzalez did after amassing similar numbers. Teams like the Red Sox are wary of contracts like the one given to Gonzalez, who will earn $21.5M from that deal this year. In this market (or lack thereof), it’s impossible for me to put dollars or years on Martinez, but I do know this: Martinez is a special hitter, and he’ll age especially well.

He will be a productive hitter for the next six or seven years, and there’s no dollar amount that can change that.


On Jake Arrieta, Aaron Slegers, and Extreme Release Points

Jake Arrieta turning himself from a Baltimore castoff to a Chicago Cy Young Award winner was a fascinating thing to watch, especially considering how it happened. This wasn’t just a guy who benefited from a change of scenery. When Arrieta adopted a new look, it was much more than his jersey color that changed.

The alterations were covered in a great 2014 Jeff Sullivan article titled Building Jake Arrieta. Among the things noted in that piece was his new release point that was primarily the result of pitching from the third-base side of the rubber.

Sullivan noted changes in Arrieta’s delivery yet again this May, pointing out an even more extreme horizontal release point in a piece titled Jake Arrieta Has Not Been Good. How extreme? Well, he’s throwing like a giant. No, not the kind that play in San Francisco. Arrieta has achieved nearly the exact same release point as Minnesota Twins pitcher Aaron Slegers, who at 6-foot-10 is one of the tallest hurlers to ever grace the mound.

Among the 562 right-handed pitchers Baseball Savant has data on from 2017, only three of them averaged a release point of at least 6.2 feet vertically and 3.3 feet horizontally: Arrieta, Slegers, and Brewers reliever Taylor Jungmann. Jungmann only thew 0.2 innings for Milwaukee last season, so there’s not much to unpack there. Below is the release point chart for Arrieta, courtesy of Baseball Savant:

And here is the chart for Slegers:

And finally, below is a graph showing how Arrieta’s horizontal release point has evolved over his career. You can see the dramatic dip to his first full season with Chicago in 2014. Things leveled out somewhat from there to 2016, but then there’s another noticeable dive last season.

Arrieta’s horizontal release point was farther toward third base than 98.6 percent of right-handed pitchers last year. It’s easy to see why a pitcher would want to create a unique look, as hitters aren’t accustomed to picking up a ball from that point, but how much does that really matter? Well, by the sound of this Francisco Cervelli quote from an MLB.com article in October 2015, I’m guessing it matters a lot.

“What makes him so tough is he throws the ball from the shortstop,” Cervelli said. “He’s supposed to throw straight. It should be illegal.”

Given Arrieta’s struggles, however, you can’t help but wonder if maybe he has taken this too far. He hit a career-high 10 batters and led the league in wild pitches for the second-straight season. Coming into 2017, Arrieta had averaged up just 6.2 H/9 and 0.5 HR/9 as a Cub. Last year, those numbers ballooned to 8.0 H/9 and 1.2 HR/9. His quality of pitch average also dipped from a score of 5.31 over his first three seasons with the Cubs to 4.98 last year.

The free agent market has been slow to get moving, but you’d have to figure things will start to pick up once the calendar turns over to 2018. It’ll be interesting to see if Arrieta’s new team tries to tweak some things with his mechanics. If nothing else, he’s shown a great openness to experiment.

Arrieta used his feet to get his arm into an angle that only a much taller pitcher should be able to achieve. Is it possible another set of eyes could get him pointed back in the right direction in 2018?

Tom Froemming is a contributor at Twins Daily and co-author of the 2018 Minnesota Twins Prospect Handbook.


Alex Cobb Will Be One of the Gems of This Free Agent Class

Of the pitchers hitting the free-agent market this winter, Alex Cobb is not likely to receive the most fanfare.

Aces Yu Darvish and Jake Arrieta will command contracts north of $100 million. Closers Wade Davis and Greg Holland will do their best to secure four-year deals with big price tags. The whole world is watching every development in the Shohei Ohtani saga. Hell, among midmarket starting pitchers, MLB Trade Rumors predicts Lance Lynn to receive a more lucrative contract than Alex Cobb.

Cobb, who broke in as a full-time starter with Tampa Bay in 2012, has historically shown great promise and good-but-not-great results. He averaged 2.5 fWAR from 2012-2014, lost the next two seasons to Tommy John surgery, then came back with a 2.4 fWAR season in 2017. Cobb has never started 30 games in a season, nor has he ever thrown 200 innings. These facts are concerning to some, but I would argue that he is one of the wisest investments one can make this offseason.

Alex Cobb has evolved as a pitcher through pitch selection. Cobb has a great curveball. You either already know that, or you’re about to find out. He also mixes in a four-seam fastball, a splitter, and a sinker. Right now, curveballs are all the rage in baseball, resulting in tremendous success for pitchers like Rich Hill, Trevor Bauer, and Lance McCullers. They throw their curveballs so often that we can consider the breaking ball, not the fastball, to be their primary pitch. Like Hill, Bauer, and McCullers, Cobb has a quality breaking ball, so it stands to reason he should throw it more often and perhaps eschew his mediocre offerings. With Brooks Baseball, we can track the usage rate on each of his pitches throughout the season.

Look at the first couple data points for the usage rates on his pitches, and then compare them to his points at the end of the season. It’s clear that Cobb began to realize he works best by using the fastball and the curveball exclusively, so he increased his usage rate on those pitches and gradually phased out the splitter and sinker.

The question for Cobb is whether this was a good idea. In Cobb’s career, he’s only posted a strikeout-to-walk percentage (K-BB%) above 15% twice, and only ever so slightly so. He’s not bad in that regard, but it’s not where he makes his bread and butter. Fortunately for Cobb, he is one of the better pitchers in the league at inducing ground balls, which we know is favorable contact. The more grounders Cobb induces, the better he gets, and his curveball is a ground-ball machine. Consider the correlation between the rate at which Cobb increased his curveball usage and his ground-ball rate (GB%) throughout the season:

That’s a pretty strong correlation. It seems that Cobb is ready to join the Hills, Bauers, and McCullerses of the world and ride a high breaking-ball-usage rate to breakout success. Of course, it’s never going to be that easy for Cobb or anybody, but let’s go through one of his starts and parse what we can from the good and bad.

On September 4, Cobb pitched against a red-hot Minnesota Twins lineup and had one of his better starts of the season. His first batter of the game was second-half monster and fly-ball connoisseur Brian Dozier, and he managed to get him out on the first pitch.

It’s been proven that batters from the “fly-ball revolution” can be neutralized if you throw them high fastballs. These hitters are swinging up to lift the ball, but it’s difficult to put much lift on a high pitch coming in fast.

We’re going to focus on the curveball throughout this piece, but here is a fun fact about his fastball. Cobb’s heater sits at 92 MPH and had a spin rate of 2101 RPM this season, which seems pretty pedestrian. However, among starting pitchers with at least 100 batted-ball events involving fastballs, Alex Cobb’s has the 31st lowest exit velocity (87.1 MPH). To put this in perspective, that’s a better mark than James Paxton, Chris Sale, Max Scherzer, Jon Gray, Justin Verlander, and Luis Severino.

Cobb was smart to bait Dozier here, and he reaped the benefits with a first-pitch out to begin the ballgame.

In the second inning, we see Cobb pitching out of the stretch and unleashing a curveball that Ehire Adrianza buries into the ground. This will be the common theme today.

I mentioned earlier that Cobb doesn’t have the K-BB% of Chris Sale or Corey Kluber, so every once in awhile he walks batters. The common thought is that Cobb, who throws so many breaking balls, might end up behind in the count thanks to misplaced curves. Then, to get back in the count, he throws his 93 MPH fastball in the zone, which gets crushed by every hitter expecting it.

This would be a bad habit for Cobb to fall into, but he certainly didn’t in 2017. Consider the list of pitchers who threw the most curveballs while behind in the count this season (via Baseball Savant):There’s Cobb, in fifth place, not far behind Rich Hill himself. All five of these guys have great curveballs, so it makes sense for them to Trust the Process™ and continue dropping the hammer rather than submitting to doom and throwing a predictable fastball in the zone.

After walking the leadoff batter to start the third inning, Cobb knew Joe Mauer could make him pay. So rather than giving Mauer the fastball he wanted, Cobb began the at-bat by dropping a curveball for a strike that even froze the great Mauer.

This changed the whole at-bat, because now Mauer didn’t know whether Cobb would be coming at him with the curve or the fastball. Cobb took advantage of his opportunity, used the fastball to get him in an ideal 1-2 count, and then he went back the curveball and got Mauer to ground into a double play.

Cobb is comfortable throwing the curveball both behind in the count and with runners on base, so he can reap the rewards and induce quite a few double plays. That is an asset. Additionally, Cobb is comfortable throwing his curve from both the stretch (as we saw against Adrianza and Mauer) and from his big windup, as you can see here.

Eddie Rosario is a good hitter who made great strides late in the season, but even he found himself to be another ground-ball victim of Cobb’s curveball.

By the fifth inning, Cobb was almost through his second time against the Twins’ batting order. At this point, they weren’t sure whether to expect the curveball or the fastball, so Cobb was often ahead in the count. Here, he has Eduardo Escobar in a 1-2 count and throws a high fastball that Escobar swings right through.

Everyone in the park was expecting Cobb to throw the curveball to finish Escobar off. From a look at Escobar’s swing, it’s safe to say he was expecting a curveball himself. Cobb’s fastball isn’t necessarily anything special, but the way he uses it to pitch off the curveball can be.

With two outs in the inning, Cobb faced his 18th batter (which would complete his second time through against the opposing batting order). He quickly got Ehire Adrianza into an 0-2 count and then unleashed his best curveball of the night, which Adrianza pounded into the ground for another easy out.

At this point, Cobb had gone through the opposing order twice, pitched five innings, and only given up one run. Teams around the league are beginning to realize that most of their starters simply shouldn’t go out for the third time through the order, even if they are rolling. The Houston Astros just rode using Lance McCullers, Brad Peacock, and Charlie Morton in tandems all the way to the World Series. Those three guys are valuable pieces, and if Cobb is utilized liked this, so is he.

Unfortunately for Cobb, his pitch count was at 85, so his manager decided to bring him out for another inning. The Twins got their third look at Cobb, and I don’t need to cite the statistics to you about what happens at this point. Hitters are smart, so they can pick up on the tendencies of a pitcher if they see him so many times. Alex Cobb, as great at he was through five innings and two times through the order, is no exception to this rule.

Here is Joe Mauer taking an 0-2 curveball from Cobb and driving it into the gap in center for a double.

The important question here is, “was that Cobb’s fault or just a good piece of hitting from Joe Mauer?” Of course, the answer in baseball is always going to be both, but you can see in the embedded GIF that Cobb doesn’t necessarily leave the pitch up. In fact, if you compare it to the curveball that Cobb threw earlier in the game to get Mauer to ground into a double play, it doesn’t look much different — maybe an inch or two higher, at worst. The bigger change is Mauer, who swings like a guy fighting to stay alive in the first GIF, then like he knew exactly what was coming and how to handle it in the second.

This is the “third time through the order” effect in a microcosm. Pitches that fool batters earlier in the game become cookies, so the key is to relieve your pitcher while his pitches still fool the batters. Cobb should not be penalized by us for giving up a double to Mauer there; in 2018, analytical teams will be bringing in a new pitcher in these situations.

In this sense, Cobb is the first free-agent test case for the newest pitching trend in the industry — the tandem starter — one who pitches twice through the order, hopefully gets 15-18 outs, and then gives way to someone else. The Mets, who hired progressive Indians pitching coach Mickey Callaway to be their new manager, have made it clear that all starters not named deGrom or Syndergaard will be shielded from facing lineups more than twice in a game. Baseball has never experienced a shortage of five-inning pitchers in its history, but these changes in pitcher usage are leading to new premiums for these specialists.

It’s as simple as this: every team wants to stock their pitching staff with Alex Cobbs. To be clear, every team wants a Justin Verlander, but there is only one Justin Verlander; even horses Chris Sale and Corey Kluber showed significant wear and tear in October. To combat this dilemma, the Houston Astros deployed Lance McCullers, Brad Peacock, and Charlie Morton in five-inning tandems and rode them all the way to the last out of Game 7.

I expect Alex Cobb will fit into this role quite nicely for whichever team he signs with.


Pitch-Framing and Twins Pitchers

On Wednesday, November 30, 2016 the Twins announced the signing of free-agent catcher, Jason Castro to a 3-year, $24.5MM contract, a move that was widely attributed to the Twins’ new front-office comfort with advanced analytics. Jason Castro is widely regarded as very good defensive catcher, due in large part to his ability to frame pitches and steal strikes for his pitchers. In 2016, Castro ranked third in all of baseball in Baseball Prospectus’ Framing Runs statistic, with 16.3. Kurt Suzuki, the Twins primary catcher in 2016, ranked 92nd at -6.8. Suzuki’s main backup, Juan Centeno, ranked 97th with -9.7.

Castro is a roughly average offensive catcher. He put together a 88 wRC+ in 2016, which ranked 17th among catchers with at least 250 PAs, via FanGraphs. For reference, the league-average wRC+ for catchers in 2016 was 87. But, he got a $24.5MM contract primarily because of his framing and the Twins are expecting him to make an impact on their pitching staff.

So where might the Twins pitchers benefit from better framing? Let’s look at the Twins pitchers (that are still with the organization in 2017) that threw at least 50 innings in 2016, sorted by innings pitched:

Table 1 Twins 50 IP

Using this list of pitchers, we can utilize FanGraphs’ excellent heatmaps tool to explore each pitcher’s distribution of pitches around the strike zone. For example, here is Kyle Gibson’s 2016 pitch% heatmap, which displays the percentage of pitches thrown to each particular segment in and around the strike zone (from the pitcher’s perspective). The rulebook-defined strike zone is outlined in black.

Gibson Pitch% Heat Map

There are not many surprises here, as we can see Gibson most often pitches down in the zone, and to his arm side, which is likely driven in large part to the high number of 2-seam sinking fastballs he throws (27.2% of total pitches in 2016, per PITCHf/x data available on FanGraphs).

What this data also lets us do, is explore each pitcher’s propensity for pitching to the edges of the strike zone. Let’s assume much of the benefit of pitch framing occurs at the edges of the strike zone, where pitches are less definitively a ball or a strike to the eyes of the umpire. By focusing on the edges of the zone we can identify which Twins pitchers might benefit most from better framing.

For this analysis, I focused explicitly on the strike-zone segments just inside and just outside the rulebook strike zone, which are the areas between the gold lines in the graphic below:

Gibson Total Edge Pitch%

Using the pitch data in these sections, I calculated a metric for each Twins pitcher, Total Edge%. These data points are summarized in the table below and show us the percentage of pitches thrown on the edge, or just off the edge of the strike zone, by each Twins pitcher:

Table 2 Twins Total Edge%

What we can see is the Twins’ starting pitchers seemed to pitch toward the edges of the strike zone more than the league average and more than their reliever teammates in 2016, with the exception of Brandon Kintzler. Ervin Santana is approximately at league average, which was 44.7%. Kyle Gibson is significantly above, at almost 49%. Jose Berrios, Phil Hughes, and Hector Santiago are all up around 47%.  So, as a starting point, we can assert that Gibson, Berrios, Hughes, and Santiago are the primary candidates to benefit from better framing.

But how do they fare in getting called strikes around the edges of the zone?

Using the same heatmaps tool, we are also able to visualize each pitcher’s called strike percentage (cStrike%), in each segment of the strike zone. Here is Gibson’s for 2016:

Gibson Total Edge cStrike%

As we would expect, pitches located in the middle of the zone are nearly always called a strike, evidenced by the bright red boxes and rates at or near 100%.

Our interest is just on and just off the edge of the strike zone, which I again outline in gold. Here, we see more variation, with the called strike percentage ranging from as high as 88% in the zone to Gibson’s arm side, to as low as 27% inside the zone up and to his glove side. We also see, pitches just off the strike zone are called strikes at a much lower percentage than pitches just in the zone, as you would expect. We need a reference point. How do the Twins compare against the rest of baseball?

Using this data, I calculated two additional metrics, In-Zone Edge cStrike% and Out-Zone Edge cStrike%, which delineate the called strike percentage on the edge and in the zone, and on the edge and out of the zone. Focusing on these strike zone segments, I calculated the called strike percentage for each Twins pitcher. Also included are the MLB averages for each metric.

Twins In Zone Edge cStrike%

What we see above is that six of the 10 Twins pitchers to throw 50 innings last season had a lower than league-average called strike rate on pitches on the edge and inside the legal strike zone. Ryan Pressly and Jose Berrios appear to be the most impacted, with called strike rates of significantly less than the league average of 64.9%, at 52.8% and 57.5% respectively.

But what about just off the edge?

Twins Out Zone Edge cStrike%

When we focus on the segments just off the strike zone, we see this same trend play out, but even more significantly. The visual above shows that eight of the 10 Twins hurlers had lower than league-average called strike rates on pitches just off the strike zone. This indicates that they were not getting many strikes stolen in their favor. In most cases for the Twins, the difference from league average is quite significant. Berrios, Michael Tonkin, Pressly, Taylor Rogers, and Santiago each have rates right around half the league average of 10.4%. The net result, when we add up the In-Zone and Out-Zone Edge cStrike% for Total Edge cStrike%, is that seven of the 10 Twins pitchers studied had called strikes rates around the edges of the strike zone that were decidedly less than league average.

Now, this probably isn’t all that surprising intuitively. We know the Twins as a whole did not pitch well last year (29th in ERA, 27th in FIP, per FanGraphs), and we know the Twins catchers did not rate well as pitch-framers. Kurt Suzuki and Juan Centeno combined to catch nearly 86% of the Twins’ defensive innings last season. But for as bad as the team pitched, it is also clear the pitchers were not getting much help from their catchers.

But how many pitches are we talking about here? If we assume a league average called strike rate on the edges of the strike zone (which was 36.1% in 2016) for the Twins, we can estimate an additional number of pitches that would be called strikes. This is what we find:

Table 3 Estimated Called Strike delta

By this analysis, it seems that Jose Berrios, Ryan Pressly, and Ervin Santana would benefit the most from better pitch-framing, with each gaining roughly 20 additional called strikes over the course of the season.

But how much does a pitch being called a ball, instead of a strike, matter?

Let’s look at the major-league batting average by count in a plate appearance. The data in the table below is from a 2014 Grantland article written by Joe Lemire, and calculates the batting average for plate appearances ending on specific counts. For example, the batting average on plate appearances ending on the 0-1 pitch is .321. The data fluctuates slightly year to year, but in any given season, you’ll find a table that generally looks like this:

Table 4 Batting Average By count

By this measure, the value of a strike, depending on the count is quite significant. In a 1-1 count, for example, if the next pitch is called a strike, making the count 1-2, the batter’s expected batting average drops from .319 to .164. Similarly, if the pitch is a ball, making the count 2-1, the batter’s expected average increases to .327. That’s a .163 swing in expected batting average.

Others have approached this differently by trying to calculating the expected outcomes by the result of the at bat that reaches each count. So for example, what is the expected outcome for all plate appearances that reached an 0-1 count, regardless of whether it was the 0-1 pitch that the outcome of the plate appearance was created. Nonetheless, we find a similar result. This is a revisit of the idea by Matt Hartzell published on RO Baseball in 2016:

Chart 1 Batting Average By count

Chart 2 OBP By count


While the differences here are not quite as steep as before, we still see the swings matter. Batting average after a 1-2 count is .178, where after a 2-1 count it is .247. That’s still a .069 swing in batting average. We also have added on-base percentage, and the trend holds. OBP after a 2-1 count in 2016 was .383, versus just .229 after a 1-2 count.

So, all of this helps us show the Twins have a pitch-framing problem and pitch-framing matters because getting more pitches called strikes leads to fewer runners on base.

But can Jason Castro fix it?

To try to find out, let’s look at the Houston Astros, Castro’s former employer. Using the same methodology as with the Twins pitchers, I again calculated the cStrike% on the edges of the strike zone for the all Astros pitchers that threw more than 50 IP in 2016.  What we find is pretty telling:

Astros Total Edge cStrike%


Of the 12 Astros to throw more than 50 IP, only one, Michael Feliz, had a lower than league-average called strike rate on the edge. But even he was roughly league average at 36.06%, compared to league average of 36.11%. The rest of the pitchers studied were above league average, and in most cases, quite comfortably so. Six of them are clustered close together right around 41.0%.

Now, to be fair, not all of this is directly attributable to Castro. These are different, and arguably, better pitchers. And Castro didn’t catch every pitch thrown (he caught 61.9% of the Astros’ defensive innings in 2016). But, the difference is stark and by this rough measure, it seems Jason Castro will make a positive impact for the Twins pitchers.

To the Twins’ credit, they recognized they had a weakness, and they used the free-agent market to acquire a player they hope can help address it.


The Twins Gave Up on Pitching to Contact Before We Did

For many Minnesota Twins fans, the recently vintage dominance of the AL Central that spanned seemingly the entirety of the first decade of the 2000s had been taken for granted. I, for one, am guilty of this, and like many fans, am starting realize that winning is not easy, although the Twins made it seem as easy as Torii Hunter made robbing home runs look effortless. Nostalgia aside, the Twins, and their fall toward mediocrity, are an interesting topic to look into. To some, they seemed a similar team to the Oakland Athletics (perhaps aiding in the creation of a post-season rivalry). The Twins, who were not quite as much of a small-market team as Oakland, seemed to develop from within. They had a deep minor system, so deep that when Johan Santana or Torii Hunter deemed it time to cash in, the Twins were able to find a quick replacement and continue their success. Santana, and Hunter, as well as Joe Mauer and Justin Morneau (who have both had their careers altered due to more recent concussions) and many other corner pieces, all made their debut in a Twins uniform and became cornerstones, yet they could never win the big playoff series.

They did not have the ability to flex the financial muscle that the Red Sox, Yankees, and even division rivals Detroit Tigers were capable of; however, they still managed to win the AL Central six out of the 10 years in the previous decade, including a loss in a playoff game to decide the division winner in 2008. The success carried into the Target Field era, represented by a beautiful ballpark that fans spent what seems like an eternity waiting for. After another disappointing playoff loss to the hated Yankees, the Twins entered 2011 looking to improve, with a similar roster and the intrigue of Japanese second baseman, Tsuyoshi Nishioka. That year was filled with injuries, and despite a post-All-Star Game push, the Twins ended the year with the worst record in the American League. Since then, the Twins have failed to reach the playoffs, and are currently battling with the Atlanta Braves for the worst record in baseball. Not to mention, long-time general manager Terry Ryan, the one credited with building the farm system leading to the team’s prior success, was fired on July 18th. Time to find out where the Twins went wrong.

Those successful Twins teams were always credited for their small-ball and defensive skills. With Joe Mauer behind the plate, Torii Hunter (replaced by Carlos Gomez, who could also flash some leather) and many other solid defenders manning the diamond, a lot of the Twins’ success was credited to this defense.

Yet the Twins were far from a one-dimensional team. The Twins had a solid pitching staff, including, most famously, Johan Santana, who was a two-time Cy Young winner with the club, before being sent off to New York. The Twins also produced one of the most exciting pitching prospects at the time in Francisco Liriano. Liriano’s career was marred by injuries, which led to his inconsistency. Despite Johan’s departure and Liriano’s ineffectiveness, the Twins’ pitching was still an effective unit. The Twins raised their pitchers not on the attractive strikeouts, but on “pitching to contact.” The premise behind this was that pitchers would attack the lower half of the strike zone, induce weak contact, and show excellent control to give up few walks. It seemed to work, as pitchers with low to average strikeout rates were able to be effective pitchers, such as Scott Baker, Nick Blackburn, Kevin Slowey, and Brian Duensing.

Before I delve into my research, I should point to Voros McCracken’s ideas about Defense Independent Pitching for those less sabermetrically inclined (if you are sabermetrically inclined, feel free to skip the next few paragraphs). If I were to give a brief summary of his work, I would say McCracken’s main point is that if a pitcher does not give up a home run or strike out or walk a batter, then he has little control of what happens to the batted ball in play. A lot of what happens can be credited to luck, sequencing, and how good his defense is. For those unaware of sequencing, it is the idea that if a pitcher gave up three singles and a home run in an inning, there are many different possibilities of what could happen. The three singles could come in a row, followed by the dinger, for a total of four runs, or, two singles could come early, the pitcher gets a double play or some other way to get out of the jam, then gives up a home run with the bases empty, followed by another single and an out. In that scenario, only one run was surrendered, despite an equal amount of hits. McCracken suggests there is randomness in this effect, which combined with the quality of defense behind the pitcher and a good deal of luck, can make ERA a poor indicator of a pitchers true skill.

McCracken looked at defense-independent pitching stats (HR, BB, K) and defense-dependent stats (ERA), and noticed that the defense-independent stats correlate much better from year to year, and are a better indicator of how a pitcher will perform, since a pitcher does not have control of what happens to balls in play.

While McCracken did not actually create FIP, his work was a building block for modern pitching analysis. FIP (Fielding Independent Pitching) tracks what a pitcher’s stats would look like if he played behind a league-average defense and experienced league-average luck. It is a much better indicator of future performance than ERA. All the data I used was from 2007-2014. Over that span, for pitchers who pitched more than 100 innings in at least a two-year span, a pitcher’s ERA from one year to the next (tracking how consistent the stat is in tracking performance) had a correlation coefficient of 0.338. FIP, conversely, had a correlation coefficient of 0.476. Clearly, FIP performs better when predicting future performance, as McCracken suggested.

To end my digression on McCracken’s importance, if I had to sum up its importance to this article, it is that pitchers have little or no control over what happens to a ball in play.

When I was talking Twins recently with some recent, justifiably uneasy Twins fans, they attributed the Twins’ recent troubles to injuries and inconsistent pitching. This was when I was reminded of the “pitch to contact” philosophy heralded by the Twins. Since the days of recently past successes, the Twins have changed management, and hopefully have let go of this ideology. Anyways, I thought to myself that McCracken’s work and subsequent furthering of the topic do not go along with the pitch-to-contact philosophy. Sure, if a pitcher can prevent walks and home runs, then it does go along with part of McCracken’s ideas. But, if the goal is to induce weak contact, yet the pitcher does not have control of what happens to a ball when it is contacted, then there is a bit of a discrepancy.

So, like any other statistically-oriented college mind looking for how to spend the rainy days of my summer break, I decided to run some regressions to test if “pitch to contact” actually succeeded and the Twins were able to induce weak contact, or if the relative success of the pitching staff is related to luck and a good defense.

To reiterate, the data I looked at came from the seasons of 2007-2014. To sum up the Twins’ pitching through the period, the period starts with solid pitching from guys who lack the ability to post high strikeout rates, excluding the one season Santana pitched in the study. Guys like Scott Baker and Nick Blackburn had solid seasons early on, but Blackburn and many others faded once things went downhill for the team. From the outside looking in, it may seem like a chicken-or-the-egg scenario, whether it was pitching that caused the downfall or some other factor that caused the pitching to fail.

I gathered data for Twins pitching over this span, and compared it to the rest of the league. The pitch-to-contact philosophy was easily visible, as over this eight-year span, only five Twins pitchers had higher strikeouts per nine innings than league average (Johan Santana, Phil Hughes, Scott Baker, Francsico Liriano, Kevin Slowey). At the same time, only four pitchers had a walks per nine innings above league average (Nick Blackburn, Boof Bonser, Sam Deduno, and Liriano), and most of those seasons came in that pitcher’s last season with the team. The data shows that despite few strikeouts, Twins pitchers found some success in limiting numbers of walks. However, for those pitchers who struggled with control, their combined ERA in those seasons was 4.82, with a FIP of 4.60. Clearly, if a pitcher struggled with control, their success was hindered by the high walk rate.

Much of the Twins’ pitching was inconsistent over this time as well, as pitchers such like Blackburn or Brian Duensing seemingly went from quality starters to below-average pitchers. For the most part, I found this to be a team-wide theme. For pitchers with multiple years with the club, I correlated year-by-year ERA and FIP, to see if any consistent trends arose. Amazingly, there was no correlation from ERA from one year to the next, as the R-squared value was 0.002, stressing no relationship at all (graph). FIP, on the other hand, showed an R-squared value of 0.15; so while not a concrete relationship, a weak relationship exists (graph).

Why this lack of consistent ERA and FIP? This is where I think BABIP comes into play. Since FIP does not take into account BABIP, it did produce more reliable data. A few outliers threw off the data, and since it is not a large sample size, those outliers did affect correlation. By the nature of the relationship, this probably did more to affect the FIP correlation than the ERA, but nonetheless, the small sample size of pitchers from this period did affect the relationship. Interestingly, but perhaps not surprisingly, I performed a regression graphing FIP to ERA, and a solid relationship exists, with an R-squared of 0.36 (graph). This would be even better of a correlation if I took out seasons by Phil Hughes and Liriano, as in those two seasons their FIP was almost a full point lower than their ERA, respectively. This shows the validity of FIP as a metric, as it accurately predicts how a pitcher likely will perform based on independent factors.

Nonetheless, there is a clear difference here in the two pitching metrics. FIP implies a relationship, while ERA does not. How can this be? My theory is that it has to do with the pitch-to-contact philosophy. If pitchers are constantly relying on luck and defense to produce outs, rather than getting batters out themselves, then random variation will play much greater of a role in a pitcher’s effectiveness. Additionally, a team’s defense will play much greater of a role in pitching.

How much can a defense affect pitching? Well, I graphed the total WAR produced by the various Twins defenses against the team ERA from the 2007-2014 seasons. I additionally graphed BABIP against team defense. Amazingly, an ERA to defense regression produces an R-squared of 0.47 (graph), while a Defense to BABIP regression produces a 0.37 R-squared value (graph). Team defense clearly has a relationship with team ERA and team BABIP, as when the Twins defense was in its prime (2007, 2010), pitching performed well. Similarly, in the defense’s worst two seasons, the team also had its highest BABIP (2013, 2014). For those wondering, FIP to team defense produces no correlation (as we expect, since it does not account for a team’s defense) with an R-squared of 0.003.

What does this all mean?

Putting it all together, we notice a few trends. After 2010, the defense took significant steps back, along with pitching (ERA). As we expect, the team’s BABIP was affected by the defense’s regression. FIP, on the other hand, remained fairly constant through the span, showing how the defense must play a role in team ERA. For example, we will look at 2014. This was the defense’s worst year in the span, with a defensive WAR of -46.5. Team ERA was second-worst in this year, at 4.58. FIP, conversely, showed the team had its second-best year in pitching, with a value of 3.97. This shows that if the Twins would have had an average defense, their ERA would have been much lower.

As team ERA ballooned, the quality of the Twins’ defense fell. Since Twins pitchers were taught to rely on their defense through the pitch-to-contact ideology, this relationship was amplified. Pitching to contact, although relying on luck and defense, may have had some merit when the Twins’ defense was in its prime. If the team could get to more balls, produce a few more outs, then as long as the pitchers kept batters from getting on for free via the walk, the team would succeed. The pitcher would not need to strike out as many batters since the defense would make more outs than the normal team. This sounds nice on paper, but as the team defense decayed, the pitching regressed. This is most evident in 2014, as a solid pitching staff was marred by the defense behind them.

If the Twins were to truly focus on pitching to contact, then they should have looked at the defense, not the pitcher. At the same time, pitching to contact is flawed in a way. Why should a pitcher rely on a defense if he can just get the batter out himself? Teaching a pitcher not to use his natural talent to strike out a batter is counter-productive. I am not saying the Twins’ coaching staff directly did this, but when only four pitchers in an eight-year span have above-average strikeout rates, it raises the question. Perhaps the Twins looked for pitchers who were undervalued because of their low strikeout rates, and used these undervalued pitchers in their pitch-to-contact system. Yet, this does not seem to be the case, as the Twins pitchers with the lowest ERAs and FIPs were the pitchers with the highest strikeout rate, excluding Brian Duensing, whose downfall could have been predicted by his 3.82 FIP (to a degree), as it showed is 2.62 ERA would be much closer to 4.00 with an average defense. Even in a pitch-to-contact system, the pitchers with the best ability to get the batter out without putting the ball in play were the best pitchers.

If pitching to contact were to have a textbook year, it would be 2007, where a team with a 4.37 FIP had an ERA of 4.18. Yet, soon after, the defense plummeted, bringing the team pitching down with it. Clearly, through the team’s porous defense, the Twins gave up on pitching to contact, too. They just hadn’t realized it yet.

Hopefully, with the new management in place, pitching to contact is forgotten. While it is also important to keep a viable defense behind the pitcher, I still can’t trust the pitch-to-contact ideology. It had a good run, but seriously, when was the last time the Twins were able to produce a consistent pitcher out of a highly-praised prospect? Liriano wasn’t consistent, Kyle Gibson has yet to dominate, and Jose Berrios has looked shaky is his brief appearances. I think Scott Baker might be the answer to my question, but if not him, then maybe Johan Santana?

Clearly, the Twins need a new philosophy for grooming pitching. It’s a team riddled with questions, and this is not the lone answer, but it can be one step in the right direction for the team currently pegged at the bottom of the AL barrel.


The Park Effect: Ignore Minnesota’s Korean Slugger at Your Peril

The Premise: Byung-ho Park will be a very good, and potentially great, first baseman/DH as soon as this season.

The Format: A typical line of discourse between a Park believer — such as myself — and a Park-skeptic.

The First Argument: Park comes from a league with little track record of successful MLB transplants — after all, if Eric Thames can be a star, how good can the league be?

The Rebuttal: It is true that the Korean Baseball Organization (KBO) has sent very few players to the major leagues. However, consider these caveats before rendering judgement. Unlike in Japan, in which baseball has ruled supreme for decades, the sport has only really taken off in Korea in the last 20 years, spurred largely by the success of Chan-ho Park in Korea and then in the majors. Now, however, the country is baseball-crazy: their national team is among the best in the world and the KBO is by far the most popular professional sports league in Korea. This dramatic rise in interest has led to a correspondingly dramatic rise in baseball infrastructure as more talent is discovered and developed from an early age. The early success of Hyun-jin Ryu and Jung-ho Kang in the United States speaks to the ability of the Korean infrastructure to develop its top-tier talents. Korean national teams regularly beat Americans and others on the international stage. The notion that Korea is not on the same level as a baseball-playing nation as Japan, Cuba, the Dominican Republic et al. is a farce.

The Second Argument: Park strikes out too much to be an effective major-league player.

The Rebuttal:  There are two responses to this, one league-oriented and one player-oriented. Implicit in this argument is the notion that the KBO is sufficiently worse than the MLB that all numbers should be significantly adjusted to account for better pitchers in the MLB. While the average KBO pitcher is undeniably worse than the average MLB pitcher, it is worth noting that Cuban League pitching is also decidedly below-average (see this piece by BA’s very talented international correspondent Ben Badler), and Cuban hitters are being snatched up like airline tickets after a decimal point error.

Second, a look at Park’s past seasons reveals an interesting shift in approach. Park’s K% in 2012 and 2013 was 19.8% and 17.2%, respectively, and his slugging percentages were .561 and .602. In 2014, his slugging percentage jumped to .686, but his K% also climbed to 24.8%. Since strikeout rate is a stat which normalizes fairly quickly — 60 PAs, according to FanGraphs — and the overall KBO strikeout rate actually declined from 2013 to 2014 (from 17.3 percent to 16.7 percent), we have to assume that Park changed something in his approach.* My conclusion, given what we know about power hitters striking out more in general, is that Park decided to trade contact for power, much like Mike Trout did before the 2014 season. This is indicative both of Park’s recognition of his strengths as a player, which speaks to his baseball intelligence and ability to learn, and also to his adaptiveness at the plate. If he is striking out too much, I am confident that he can reorient his approach and still be a highly valuable player.

The Caveats: There is, of course, no guarantee that Park will succeed in Minnesota. MLB competition is significantly better than any other league anywhere and there will be a learning curve for Park as he learns to hit MLB pitchers. The steeper hurdle in my mind, however, is culture: American culture is very different from the Korean culture with which he is comfortable. Kang Jung-ho, thanks to no small helping of self-confidence, a good team environment, and a penchant for the dramatic, has thrived in Pittsburgh, but there is no guarantee that Park will adjust as successfully or as quickly.

The Conclusion: These caveats aside, drafting (or signing) Byung-ho Park is a risk worth taking. He will be cheap and the upside is enormous. Acquire Park with confidence; there is a good chance that in the not-so-distant future, both you and the Twins will be the proud owners of one of the best power hitters, and best bargains, in baseball.**


*KBO stats pulled from baseball-reference.com
**Read Dan Farnsworth’s recently published Twins prospect list for further analysis of Park


A Different Way to Look at Strikeout Ability

Mike Podhorzer has looked into the relationship of a batters’ average fly ball distance as it relates to their HR/FB ratio, and has found results that will allow others to more accurately project a hitter’s home run totals from year to year.

This got me thinking. Which can be a good or bad, but in this case, the authors’ labor produced a fruitful return. While a hitters’ HR/FB ratio can fluctuate indiscriminately from year to year, Podhorzer has proven a batters’ average fly ball distance is a better indication of a player’s true talent power production. In the same light, my study looks at how a player’s swinging strike rate (SwStr%) is a better indication of a pitcher’s strikeout potential than K/9.

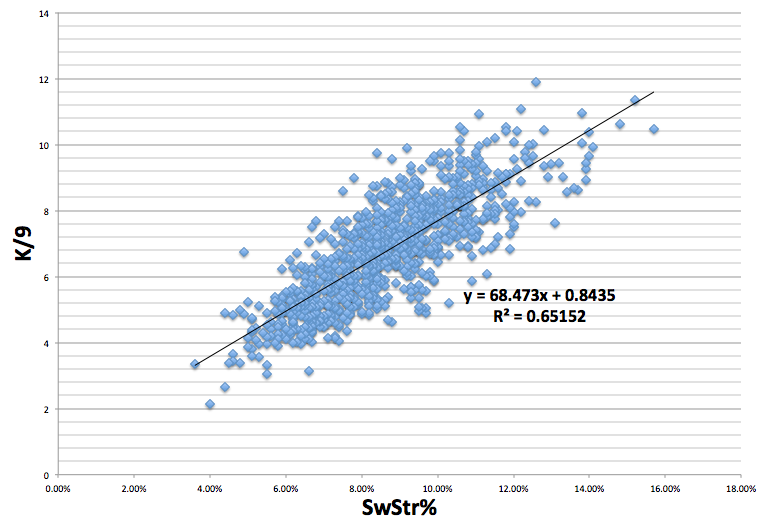
My assumption was that K/9 and SwStr% have a strong relationship. But, how strong of a relationship is it? To find this out, I took all qualified starter seasons from 2003 to 2013, which gave me a sample size of 933 pitchers, and ran a correlation between their SwSTR% and their K/9. The results showed that there is an exceedingly positive correlation between SwSTR% and K/9, to the tune of a .807 correlation coefficient and a .65 R2.

Screen shot 2013-10-03 at 1.06.11 PM

What is important to note is that there are very few pitchers present in the sample with a SwStr% above 13%, which may be symptomatic of something larger. Getting batters to swing and miss is difficult. The more often you can get a batter to swing and miss, the more valuable you are as a pitcher. As a result, the higher the SwStr%, the smaller the sample size becomes. For example, Johan Santana (2004) and Kerry Wood (2003) are the two lone dots to the farthest right on the graph with SwStr% of over 15: wow.

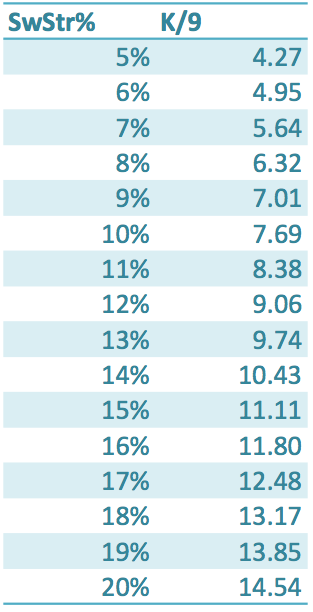
After the relationship between SwStr% and K/9 ratio became unmistakable, I calculated what a particular SwSTR%s translates into, as far as K/9, with the formula Y=68.473*x+0.8435, and got this chart:

Screen shot 2013-10-03 at 1.55.30 PM

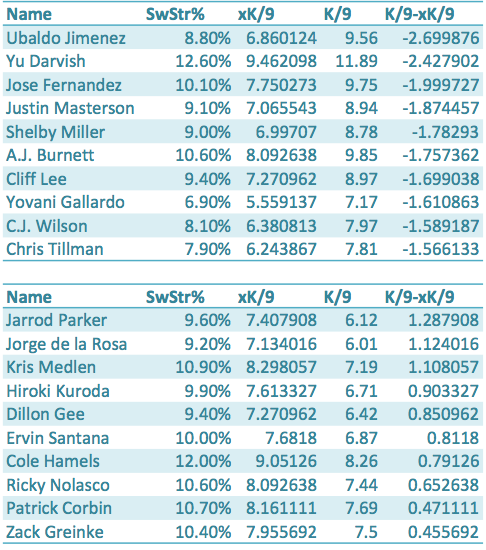
The next step is to take what we have discovered and apply it to a sample. The chart below shows each qualified pitcher for 2013, their SwStr%, xK/9, K/9, and K/9-xK/9.  xK/9 is what we would expect a pitcher’s K/9 to be based off of their SwStr%, and K/9-xK/9 shows us how much a pitcher over-performed or under-performed their SwStr% and xK/9.The first set of ten names are the pitchers who outperformed their xK/9 the most, and the second list of ten names are the players who underperformed their xK/9 the most.

Screen shot 2013-10-03 at 2.44.59 PM

The results show that Ubaldo Jimenez, Yu Darvish, and Jose Fernandez are the pitchers who have outperformed their xK/9 the most in 2013. These three pitchers also have great a great amount of deception and/or command (deception in Jimenez’s case: because, no one has ever called Ubaldo a control artist). And, while they may have outperformed their true talent in 2013 to an extent—they all had remarkable years—maybe that deception and control, which SwStr% does not take into account, leads to less swings by batters and more pitches taken for strikes, as opposed to swung at for strikes.

Perhaps xK/9 is more helpful when we look at pitchers who underperformed their SwStr%, like Jarrod Parker and Kris Medlen. Both of these pitchers had down years compared to what their projections suggested, but their xK/9s seem to be optimistic about their futures. Parker showed a .18 improvement in his K/9 from the first half to the second half of the season, while Medlen showed almost a full point improvement going from a 6.81 K/9 in the first half to a 7.67 K/9 in the second half.

While xK/9 may miss something—deception and command—when it comes to pitchers that outperform their SwStr%, xK/9 seems to find a reason to be optimistic when it comes to pitchers like Kris Medlen and Jarrod Parker who have underperformed their SwStr% and strikeout potential.

Devon Jordan is obsessed with statistical analysis, non-fiction literature, and electronic music. If you enjoyed reading him, follow him on Twitter @devonjjordan.