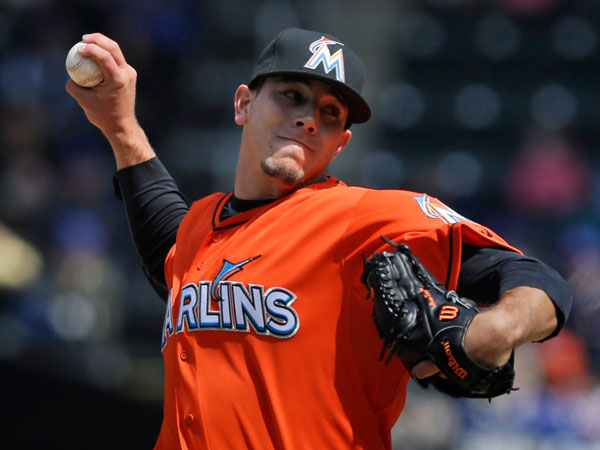
Caleb Smith will likely be one of the names you’ll hear a lot as we close in on the trade deadline. It is not a foregone conclusion, but the Marlins probably won’t be playing meaningful games in late September. Derek Jeter and Co. make no bones about their willingness to trade talent, and Smith, who turns 28 years old three days before the deadline, might be the best trade chip Miami will have.
Smith is still in pre-arbitration and could be very appealing to a contender with budget concerns looking to add an arm. Depending on where the emerging staff ace might land, Smith could serve as a strong No. 2 or No. 3 starter. Should the Marlins make him available, what could Smith provide, and would he be worth the haul Miami may ask for?
Smith landed on the injured list back in early June and returned to the Marlins rotation on July 6th. He went six innings and gave up three earned runs on five hits with six strikeouts and one walk, earning his first victory since May 1st. He had a great first half, striking out at least six hitters in 10 of his 12 starts and currently stands ninth overall in K-rate at 31.5% (min 70 IP).
Smith works with three pitches — a four-seam fastball, a slider, and a changeup. His overall called-strike plus whiff rate (CSW) for all three is 31% (28% is average).
The most-used pitch in his repertoire is the four-seamer (48.6%), which sits in the 39th percentile for velocity alongside a higher-than-average spin rate (80th percentile). It gets some decent vertical break with a lot of horizontal action as a result of its 138-degree average spin axis. Read the rest of this entry »
With all the blabbing about the fire sale of the Miami Marlins, and less so with the Pittsburgh Pirates, does the philosophy of ‘tanking‘ in Major League Baseball work? Can it come to fruition the same way it does in the National Football League or the National Basketball Association?
The biggest and most obvious difference in those sports is the vast majority of players you’ll draft in the NFL or NBA are ready to play (even start) the following season. Not only that, players are more of a ‘sure thing’ in those leagues; you’re more likely to hit on a player since the pool is much more shallow than it is in baseball.
While in MLB, there are several levels to break through before you’re actually ready to play in the top-level.
Now, I understand the angle of ‘tanking’ to accumulate funds and eventually splurge on some free agents or wanting to make your team younger. I can follow that train of thought (sort of) but we are going to go on the premise that teams are doing it to grab top-level draft picks through each round.
Yes, the Houston Astros and Chicago Cubs, after many seasons of horrid baseball, are now World Champions thanks to patience and a great analytics department. Let’s just break even and apply this to your average front office.
According to research done by Cork Gains of Business Insider back in 2013:
“After three years, we will probably only see about 15% of this year’s draftees in the big leagues. And for most players, it will take 4-6 years to make it to the highest level”.
Let’s take a more recent peek at draft success within the first five rounds of the MLB draft. We only go that deep because, honestly, after that point (and even five rounds is a reach) it’s mostly a crap shoot and I’d venture to guess no team has any sort of advantage over the other.
I’m using five years as its reasonable to expect, even with a high schooler, to reach the big leagues within that amount of time. Of players drafted in 2017, none have reached the majors; no surprise there. In 2016 just one player drafted, third-round pick Austin Hays of the Baltimore Orioles, has made it to the majors. We ought not to reference that year, either.
In the 2015 draft, out of 165 players picked in the first five rounds, 7% have made it to the big leagues.
It goes without saying the list grew considerably in 2014 and it follows that it would in subsequent drafts. Out of rounds one through five in 2014, we have 19% currently in the majors.
Let’s investigate the success rate by round, referencing research done by Mike Rosenbaumof Bleacher Report.
So the first round, you’re likely to get two out of every three players in the majors, then 50/50 in the second round. However, this chart is no reference for success or failure for the player once they do reach MLB.
The standard deviation of success rate drop-off is 4.96%, with a variance of 24.6%
Here, we’ll observe the first overall picks since 2006 and their yearly average WAR from all MLB seasons.
The first-overall pick in this era yielded about 50% averaging WAR over 3.2 (we’ll get to the context in a bit).
Lastly, let’s look at the cumulative WAR of rounds one through five, starting at 2011 to 2015. As mentioned before, there was just one player who reached MLB that was selected in the first five rounds during the last two years.
*Mookie Betts 24.1 WAR
So the chart lends itself to logic; the older the year, the higher the cumulative WAR. But, there is still a lot we don’t know yet as there are still players in the 2011 draft toiling in the minors, yet could break into the big leagues in the next year or so.
Yet, something funny happens. There is a spike in WAR once we get to round 5. As noted, the majority of WAR from that round in 2011 comes from Mookie Betts. Could we infer that later rounds will increase as well? Probably not, as the random variation would likely be all over the place player to player. But it’s not a stretch to assume that you can find just as much value in later rounds as you can in the first couple.
Obviously, the bigger success stories come from the first round. But, keep in mind that’s just one player. On a team of 25 guys, it’s less likely that this player can turn an entire franchise around by themselves. In the NBA its possible, or the NFL where a quarterback can pull a team out of mediocrity within a year or so.
I’ll average the first round pick WAR to get an idea of what a team who continually ‘tanks’, could expect to get out of first rounders for the next several years.
2011- 2.8 2012- 1.7 2013- 1.2
Again, this isn’t concrete information but it’s enough data to get a rough inference. If you ‘tank’ for several years, and get a high first round pick, you can expect to get a players who will average a WAR of about 3 (after about five years); the average WAR of a number one pick (using the data in the ’06-’16 chart) is a little better than 2.
So you’ve got a good shot to get a player considered decent or, at best, above average.
The following chart give some context on WAR for those unfamiliar.
Is it really worth ‘tanking’ in baseball? In, say, five years of mediocrity, how often can you expect to hit on a player in the early rounds (average 2.5+ WAR)? Again, in the first round (’06-’16) chart above, you’ve got a 50/50 shot. Is it worth driving your franchise into the ground with those kinds of odds?
Like I’ve said before, we are using a small amount of data that is on a sliding scale (the older the draft, the higher the WAR). Since it would take roughly 3-5 years for an organization to acquire draft picks that could break into the league and help push the team into championship contention, it’s not too far of a reach. Meaning you can expect your first couple of picks per year to start normalizing WAR after a couple of seasons…if they reach the majors at all at all.
So is ‘tanking’ worth it? Allegedly to the Marlins and Pirates, it seems to be. They have highly paid analysts and I’m a lowly blogger, so they know better than I do. But, with the information I’ve been able to acquire, it doesn’t seem as though stockpiling high picks will benefit an organization enough to risk losing fans, revenue, and respect in MLB in the short term.
Giancarlo Stanton has missed significant playing time since his MLB debut in 2010 and has never played more than 150 games of a 162-game season (145 and 123 games being his next two highest totals). In spite of his injury-shortened seasons, Stanton has still been among the league home-run leaders in 2011, 2012, and 2014 (his 150, 123, and 145-game seasons, respectively).
Giancarlo Stanton Since Debut (June 2010)
Season
Games
PA
HR
HR MLB Rank
Injury Report
2010
100
396
22
T-55
——
2011
150
601
34
9
Hamstring issues limited time
2012
123
501
37
7
15-day DL: Arthroscopic knee surgery
2013
116
504
24
T-31
15-day DL: Strained right hamstring
2014*
145
638
37
2
Season-ending facial fracture
2015
74
318
27
T-25
15-day DL: Season-ending hamate (hand) fracture
2016
119
470
27
48
15-day DL: Strained left groin
*=finished 2nd in NL MVP race (Clayton Kershaw)
Career-wise, Stanton has amassed a total of 208 home runs, good enough for 16th-most of any player through their age-26 season and among the likes of Miguel Cabrera and Jose Canseco.
HR-leaders through Age-26 season
Rank
Player
HR
1
Alex Rodriguez
298
2
Jimmie Foxx
266
3
Eddie Matthews
253
4
Albert Pujols
250
5
Mickey Mantle
249
6
Mel Ott
242
7
Frank Robinson
241
8
Ken Griffey, Jr.
238
9
Orlando Cepeda
222
10
Andruw Jones
221
11
Hank Aaron
219
12
Juan Gonzalez
214
13
Johnny Bench
212
14
Miguel Cabrera
209
14
Jose Canseco
209
16
Giancarlo Stanton
208
Given Stanton’s injury-plagued career, his career home-run numbers are a lower bound on what he may have accomplished had he played full, injury-free seasons following his debut. To quantify how Stanton’s injuries have suppressed Stanton’s career power numbers thus far, I extrapolated the home-run totals of Stanton’s injury-shortened seasons into full-season hypothetical home-run totals (hHR) using the formula below:
hHR = FLOOR(HR/G * 162)
The formula simply assumes that Stanton maintains his HR/G rate through a whole 162-game season and then conservatively rounds down. We can now compare home-run totals between the real Giancarlo Stanton and our hypothetical Giancarlo Stanton. I excluded his 2010 debut from the extrapolation.
Real Giancarlo Stanton vs. Hypothetical Giancarlo Stanton
Season
Games
HR
HR MLB Rank
hGames
hHR
hHR MLB Rank
2010
100
22
T-55
100
22
T-55
2011
150
34
9
162
36
8
2012
123
37
7
162
48
1
2013
116
24
T-31
162
33
T-9
2014
145
37
2
162
41
1
2015
74
27
T-25
162
59
1
2016
119
27
48
162
36
T-16
The real Stanton never led the MLB in home runs, but our hypothetical Stanton climbs into the MLB lead in three of his hypothetical seasons (2012, 2014, and 2015).
Career-wise, our hypothetical Stanton would have hit 275 total home runs. This hypothetical Stanton adds 67 home runs to his real total, jumping from 16th to second place on the Age-26 leaderboard, only 23 home runs behind the far-away leader, Alex Rodriguez.
HR-leaders through Age-26 season
Rank
Player
HR
1
Alex Rodriguez
298
2
Giancarlo Stanton (hypothetical)
275
3
Jimmie Foxx
266
4
Eddie Matthews
253
5
Albert Pujols
250
6
Mickey Mantle
249
7
Mel Ott
242
8
Frank Robinson
241
9
Ken Griffey, Jr.
238
10
Orlando Cepeda
222
11
Andruw Jones
221
12
Hank Aaron
219
13
Juan Gonzalez
214
14
Johnny Bench
212
15
Miguel Cabrera
209
16
Jose Canseco
209
17
Giancarlo Stanton (real)
208
Of note, using the same formula to calculate Stanton’s career strikeout totals predicts a whopping 1271 strikeouts for our hypothetical Stanton. His 977 strikeout “real” total through age 26 (second-highest) balloons and surpasses Justin Upton’s age-26-leading 1026 for a clear command of first place.
In reality, Stanton is a three-time All-Star, a Silver Slugger (2014), and a Home Run Derby champion (2016), and he historically ranks among the best in home-run totals for his age, all while facing injury issues in all of his first six full big-league seasons. Our hypothetically-healthy Giancarlo Stanton greatly improves his career numbers and garners himself a few MLB home-run crowns, giving a glimpse into how much larger his career numbers could be today had his first six full seasons been injury-free. As Stanton’s career progresses, it will be interesting to see where his home-run totals end up, and, unfortunately, how much greater they could have been.
Steven Matz’s season debut quickly went south, with him giving up seven earned runs in the second inning en route to a 10-3 New York Mets loss against the Miami Marlins. Matz exhibited one mechanic flaw leading to his lack of command, particularly in two-strike counts, resulting in the Marlins’ second-inning carousel around the bases.
Steven Matz (L, 0-1) 1.2 IP, 7 R, 6 H, 1 SO, 2 BB
Arrows were pointing up after watching a 1-2-3 first inning with fastball velocity at 95 mph, culminating in striking out one of Major League Baseball’s best power hitters, Giancarlo Stanton.
Unfortunately, Matz started the second inning breaking one of the cardinal rules of pitching: walking leadoff man Martin Prado. When a leadoff hitter makes it to first base, he scores approximately 35% of the time. Making matters worse, Matz walked the following batter, Chris Johnson. Five of the next seven batters ground out hits, including a Giancarlo Stanton man-bomb home run to left field, knocking Matz out of the game.
The frustrating aspect for Matz and Mets fans alike was during all three Marlins RBI single at-bats, Matz was ahead in the count 1-2 or 2-2. Matz proceeded throwing hanging curveball after hanging curveball. Even in Marcell Ozuna’s pop-out, both two-strike pitches were hanging curveballs which thankfully Ozuna missed (Side note: Ozuna can’t hit an outside pitch….at all). Obviously, Matz’s objective was not to hang curveballs or throw hittable two-strike pitches. The reason lies in Matz’s release point.
Simply, Matz’s throwing arm lagged behind his body forcing his release point to be late, rushed and higher than normal as opposed to his normal release point out in front of his body. This results in an inability for Matz’s throwing fingers to stay on top of the baseball.
Matz, and every other Major League pitcher, needs his fingers on top of the baseball at release, allowing his fingers to stay on top of the seams on the baseball. This allows his fingers to manipulate the spin of the baseball at release, whether ripping down on the seams for a four-seam fastball or getting over the top of the baseball throwing a curveball.
Consequently, Matz’s fingers come around the seams of the baseball instead of over the seams of the baseball when throwing his curveball, resulting in a weak spin rate and a floating or hanging curveball. Additionally, fastballs tend to sail high and towards the throwing arm side (up and to the left for Matz) out of the strike zone as seen in four straight fastballs during Prado’s leadoff walk.
Why Matz’s arm lagged is a separate question I couldn’t unveil through the TV broadcast. Originally, Matz appeared throwing across his body, meaning his stride/planting leg lands too far left towards first base, blocking off his arm from releasing the baseball out in front of his body. But this was not the case as Matz was landing with good alignment towards home plate. Other reasons could include rushing his motion or opening his front shoulder and glove hand too soon but I didn’t see those either.
Whatever the reason, pitching on ten days’ rest is very difficult, especially for a starting pitcher in a rhythm and routine created during spring training. Do not put too much stress in the results of this start.
Dee Gordon is a polarizing player. His all-speed, no-power approach on offense has both fans and projection systems divided on what to make of his bat. Is he an elite offensive second baseman? Is he a one-hit wonder that won’t be able to repeat his numbers from 2015? Reasonable people can really disagree on Gordon’s bat.
Reasonable people can also really disagree on Dee Gordon’s defense, and that’s where I intend to focus my analysis today. Dee Gordon led all second basemen with a 6.4 Ultimate Zone Rating (UZR), which means he was worth roughly six runs on defense compared to an average second baseman. That doesn’t sound too unreasonable, right? Here’s where things get interesting. Gordon, despite his obvious athleticism, had previously been considered a below-average defender, coming in with a -3.4 UZR last year at second base. He had been a massively below-average defender at shortstop (where he played a few years ago before moving to second base full-time in 2014), so there are years of data painting him as a minus defender relative to other middle infielders.
In 2015, Gordon’s advanced defensive metrics took a massive jump forward. Dee Gordon improved by exactly 10 runs according to UZR, which is roughly an entire win difference thanks to his defense. Which defender is the real Dee — the one that flailed around in 2014, or the elite defender from 2015?
Let’s find some historical comparisons, and see what they can teach us about the repeatability of Dee Gordon’s defensive statistics.
We know Dee Gordon improved 10 runs defensively at second base to become one of the best defenders in the league at the position. Let’s take a look at the past 10 years, and find all second basemen that improved by at least 10 runs in UZR from year to year and had a UZR of at least 5 in the improved year. There are 16 player seasons that fit this criteria. Excluding those that didn’t play enough innings to qualify at second, 11 player seasons were left fitting the criteria. The numbers are presented below, along with the UZR that the player recorded the season following his improved year.
Among the second basemen in the last 10 years that made a big jump into the elite of the defensive statistics, on average those players lost almost nine runs of UZR the following season after the leap. The group lost about 60% of the improvements they had made the following season, indicating that a big jump in UZR for a second baseman is unlikely to signal a new level of performance. Among the qualifying group, not a single second baseman improved their UZR the following year again and only one member of the group, Placido Polanco in 2009, regressed by less than four runs.
However, there is a slight bright side. Only one member of the group had a UZR that was lower the year after “the leap” than before the improvement, indicating that taking a leap of over 10 runs of UZR means you almost certainly have improved as a defender. It’s just not by nearly as much as you would think from the leap-year UZR, but the players kept about 40% of the improvement they made in their improved year.
What does this mean for the Marlins’ speedy second baseman? While Dee Gordon’s huge jump in UZR this year means he’s almost certainly a better defender than he was two years ago, the improvement to his talent is likely only modest and not nearly what you would hope for after his great 2015 defensively. To those who pointed to Dee Gordon’s greatly improved UZR this season as a reason to believe he’s made big strides as a defender, I’ll sadly have to point out that we can expect Dee Gordon to return much closer to the mediocre defender he was in 2014 than the star he was in 2015.
Weighted On-Base Percentage (wOBA) is typically considered to be the best measure of offensive ability and effect on runs scored among other rate statistics such as batting average, slugging percentage, and on-base percentage. 89.8% of a team’s runs scored correlates to wOBA between 2005–2015. I decided to look at a team’s performance, measured by how many runs they scored in a season, against the amount of runs wOBA predicted* they would have scored. (wOBA Expected Runs was calculated based on a linear regression model with runs modeled as wOBA. The adjusted r-squared value of R~wOBA is .898)
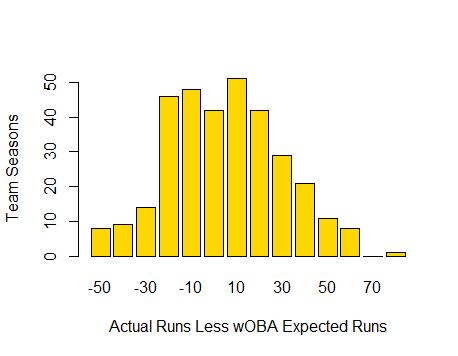
Generally, the results are what you would expect. Teams deviate from their wOBA Expected Runs, but the 50% of the teams (between the 25th and 75th percentile of the observations) range between -17.49 and 16.9 runs from their wOBA Expected Runs.
The outliers even fall within the uncorrelated portion of the relationship between runs scored and wOBA. As stated above, wOBA explains 89.8% of runs between 2005 and 2015. At the far right of the graph is the 2008 Minnesota Twins, who scored 829 runs against their 756 wOBA Expected Runs. The difference, 73 runs, is less than the 10% of runs that is theoretically not explained by wOBA. At the far left of the graph is the 2005 Arizona Diamondbacks who scored 696 runs against their expected amount of 756. Again, this 60-run differential falls within the 10% gap we would expect.
The mean difference of runs scored from the wOBA Expected Runs Scored is minuscule (.003 runs) and the standard deviation from that mean is 24.9 runs. This all strengthens wOBA’s position as the best offensive run predictor.
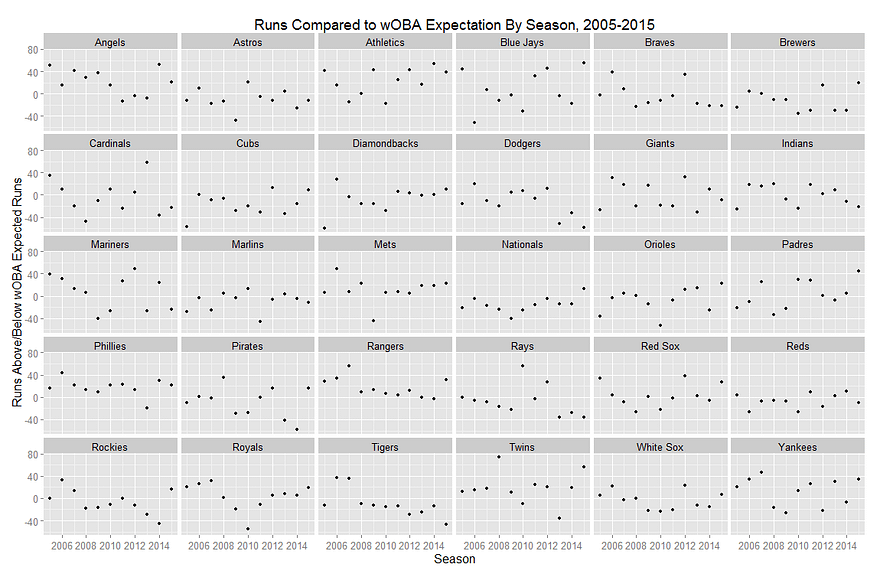
What does this all have to do with Don Mattingly and the Dodgers? The graphs below show each team’s runs scored below or above their wOBA Expected Runs Scored. You’ll see that teams fall within the standard deviation of runs scored less wOBA Expected Runs (-25.93–24.87), with some exceptions. The exceptions that fall outside of that range generally do not display a tendency for extreme over- or under-performance of their wOBA Expected Runs in consecutive seasons; however one team does stand out.
The 2013–2015 Dodgers consistently under-performed their wOBA Expected Runs, with the following differences in the respective seasons from 2013–2015: -51, -33, and -58 runs. To put this in context, only 8 of 330 of teams, or roughly 2%, that took the field between 2005–2015 under-performed their wOBA Expected Runs by more than two standard deviations (-49.8). The 2013 and 2015 Los Angeles Dodgers were two of those teams. No other franchise appears on the list twice, much less twice within three seasons.
In Mattingly’s first two seasons with the Dodgers (2011 and 2012) the results were standard, with a -6 and +12 runs to wOBA Expected Runs differential, but when the Dodgers came under new ownership and started spending to bring in new players things changed. The team got better but their performance in relation to what they were doing got worse.
A glance at the graphs above will show that teams have under-performed their expectations, but never this badly for a three-year stretch. There is luck and there are trends, and the Dodgers are a trend of under-performance. Does this mean Don Mattingly is a bad manager? Maybe. Does it mean that Mattingly was a bad fit for this Dodgers team as constructed? Probably.
It could all be on the hitters; it could all be bad luck, but those seem unlikely. The 2013–2015 Dodgers are the worst offensive under-achievers in the last decade. The results suggest that Mattingly was unable to shuffle a cast of talented and enigmatic hitters into the right order to produce the best sequencing of results. Alternatively, the other narrative is that Mattingly was handed a group of talented and enigmatic hitters that couldn’t execute situational hitting and hit inconsistently. Either way, the Dodgers cost themselves a lot of wins through one, or a combination of the two narratives. The team lost 5, 3, and 5 wins each year, compared to if they met their wOBA Expected Runs, as calculated using the Runs per Win for 2013–2015.
This doesn’t necessarily bode poorly for Mattingly in Miami. The Marlins don’t have the benefit of a deep and talented bench. They are a fairly straight-forward offensive team that should allow Mattingly to write-up consistent lineups so long as the team remains healthy. This is not to say the Marlins will out-perform the Dodgers. It is to say that the Marlins may perform closer to how we would expect them to perform.
However, if the problem did not lie with Mattingly, but instead the Dodgers’ roster, than things do bode poorly for the Dodgers. It will be interesting to see if Dave Roberts can unlock something Mattingly could not; or whether the players are to blame; or whether Los Angeles must wait for Gabe Kapler, baseball’s philosopher-king, to set the runs free.
I know that I’m not alone in saying that one of my favorite parts about baseball is the projection of young players. In fact, I’d probably even say that I enjoy dreaming on what young players could be even more than I enjoy players for what they actually are. It’s one of the reasons I follow the Cubs and Twins (get well soon, Byron) farm systems as closely as I do the A’s and Dodgers big-league clubs. Obviously, it’s especially exciting when a group of young prospects on the same team all come up and meet expectations, as rare as that may be. To take it one step further, it’s just the best when all of that talent is concentrated in one positional group (pitchers, infielders, outfielders). So in an effort to combine my love of projection with what is currently happening on the field, I’m going to take a look at a couple of the most exciting young units in baseball.
Here are the top ten outfields as currently ranked by fWAR:
Of the top ten, only two teams are currently starting an outfield where all three players are 28 years old or younger. Now, it would be pretty funny if I said they were the Orioles and Blue Jays just to make you angry, but since you’re a person who ostensibly reads titles before you read articles, you know that these two teams are the Pittsburgh Pirates and Miami Marlins. Spoiler revealed.
Anyways, both young outfields are clearly extraordinarily talented. Each unit has an excellent case as the most promising outfield for the next five or ten years. That said, it’ll almost surely be a young outfield that exceeds them, because if baseball does nothing else, it destroys our expectations each and every season.
But focusing on the task at hand, the two outfields are very similar if you look at them in a certain arbitrary way. They each feature one superstar (Andrew McCutchen and Giancarlo Stanton), a strikeout-prone “tools” guy (Starling Marte and Marcell Ozuna) and a skinny corner guy with all-star potential (Gregory Polanco and Christian Yelich). Now, those descriptions don’t really matter, but they’re interesting nonetheless. What does matter, however, is performance on the field.
The Pirates outfield has probably been the more hyped unit so far, and I think the majority of people would choose them to be better going forward as well. Their core three is currently the more productive, and they blow away the Marlins in production over the next four years, using the Oliver projection system.
If the projections turn out to be correct, the Pirates outfield is going to be, on average, 4.8 wins per season more valuable than the Marlins. But I have a couple of issues with these projections.
First, wow do they hate Marcell Ozuna. This is somewhat understandable considering Ozuna never was that highly regarded as a prospect, and some people thought that the Marlins were making a mistake by promoting him to the big leagues so quickly last year. But as he’s shown since his call-up, Ozuna is actually pretty valuable. In only 70 games in 2013, he was worth 1.6 fWAR. In 2014, he’s been hitting for power and been worth nearly 2 wins with a month and a half left to go in the season. He’s not a perfect player (28.7 K%), but I think it’s fair to say that he’s not the borderline replacement-level guy that he is projected to be right now.
My second issue is that I just can’t get comfortable projecting Gregory Polanco as a 5 fWAR player just yet. He’s obviously a top prospect holding his own in the majors, but five-win players are really good. Only 19 position players were more valuable in 2013 than the 5.2 fWAR that Polanco is currently projected to reach by 2018. I certainly won’t be shocked if he reaches that level, but man, as fun as prospects are, sometimes they bust for no apparent reason. I’ll need to see a full productive season before I feel good about calling him a future MVP vote-getter.
Unfortunately for the Pirates’ case in this argument, the outfield fWAR top ten that I posted at the beginning of the article largely reflects the contributions of a player whom I have not mentioned thus far: Josh Harrison. At just 27 years old himself, Harrison has continued to be productive after what most assumed was just a hot couple of months. However, with Polanco now in the majors, it looks as though Harrison will be playing in the Pirates infield over the coming years, assuming all of the outfielders are able to retain their health. So it will likely be up to Polanco to replicate Harrison’s 2014 numbers (144 wRC+) going forward, a tall task even for someone as talented as he. Combine that with the possibility that Andrew McCutchen begins to decline upon hitting 30 in a couple years, and the Pirates outfield may not look quite as pretty as it does on paper at the moment (though it’ll still probably be really good).
Now, rather than continue to list reasons why you shouldn’t choose the Pirates, let’s talk about one final reason why you should choose the Marlins in our completely meaningless debate. Talent aside, the Marlins’ greatest advantage over the Pirates is their youth. Stanton is actually the oldest of Miami’s outfielders at the decrepit age of 24, while Ozuna and Yelich are 23 and 22, respectively. As a group, they certainly have the longest way to go to reach their ceiling, but they also have the most time to get there. And if you’re like me, you may be inclined to be on upside.
When choosing between these two outfields, there’s really no wrong option, as cliche as that may sound. They each have a combination of current production and future projection that we simply don’t see very often. Personally, despite all of the reasons I listed against them, I’m still inclined to go with Pittsburgh, but the choice is harder now than it was when I began this post. Either way, it doesn’t really matter. We’ll be able to sit back and enjoy both units, hopefully for the next decade or so.
This article was originally posted on gappower.wordpress.com, a site you’ve definitely never been to. I’ve checked. You can also find me on Twitter, at least occasionally.
Giancarlo Stanton. What a trip this guy is. One second he is hitting home runs and the next he is running to first and coming up lame with a pulled hamstring, or a knee injury, or even an eye injury. He is an enigma that we seemingly know little about. He is hard to project into the future because of the injuries, but the one concrete thing we know about him is that he possesses monstrous power.
Recently I have come to see Stanton as similar to Ken Griffey Jr., in that he hammers the ball and could put up single season home run figures similar to Griffey’s, who hit 56 home runs in consecutive seasons. In addition, Griffey averaged 32 doubles per season, while Stanton averages 36, Griffey had a career OPS of .907, while Stanton’s is .892, and they are only .001 point apart in slugging percentage. I could go on with more statistics, but you get the point, these guys are like statistical clones. Stanton does not have the benefit of playing in the Kingdome like Griffey did, so we should even take into account the fact that Stanton currently plays half of his games in the Petco Park of the East.
Unfortunately, they are also similar in the injury department. I’m not saying Stanton will miss as many games as Griffey, but Stanton has missed 95 games due to injury since the beginning of 2012. What is even more worrisome is that he is hurting in many different regions of the body. I alluded to the numerous injuries in the opening; he has missed time for arthroscopic knee surgery, shoulder issues, and hamstring issues. The ability of each of these separate injuries to flare up again is something that should concern all fans of Stanton, as well as fantasy owners. In fact, I owned Stanton last year in my own fantasy league and we had a running joke going that we couldn’t call him “Giancarlo” (we referred to him as “Mike”) until he hit five home runs. I thought this was a very trivial joke at first, but the other owners had the last laugh because Stanton did not reach five homers until June 15th, mainly due to injuries.
If Stanton can stay healthy, he may be this generation’s Griffey. He does not have the flair, mechanically perfect swing, or happy-go-lucky attitude that Griffey seemed to carry on and off the field, but Stanton is similar to him where it matters most — in the statistics category. As an avid baseball fan I would certainly not be opposed to watching Stanton bash 600, or even 700 homers over the next 15 years and I know every Marlins fan would thoroughly enjoy that kind of production, assuming he stays in Miami. He may not have quite the average that Griffey achieved (Stanton career: .267, Griffey career: .284) but he can certainly smash the ball at a consistent clip.
Strange as it is, I want Stanton to be like Jeremy Renner in Hurt Locker. I want him to step up to the plate and discern what puzzle the pitcher (or the insurgent) is putting in front of him and then solve the riddle and hit the ball 450 feet, like when Renner disarms a circle of six IEDs. Then, I want him to keep the bomb suit on and run around the bases so he doesn’t injure himself. In fact, he should keep the mask on so he doesn’t get an eye injury again.
I am basically asking for Stanton to break numerous batting records all while playing at half speed (or maybe in a bomb suit) so that he will stay healthy. I know that is unfeasible, but we basically have a prior tale of what will happen if he keeps getting injured. We can always just take a look back at Griffey’s career and see what Stanton’s production will be if he keeps landing on the disabled list at his current pace. But the interesting and exciting thing is that if we want to know what could’ve been if Griffey’s career hadn’t been riddled with injuries, we might get a realistic clue if Stanton can get healthy and remain that way for the years to come. Hopefully we will be able to sit back and enjoy the moments of Stanton’s career where he “disarms” pitchers and launches moon shots off the Marlins’ scoreboard.
The Miami Marlins are always in the news at the Trade Deadline, and the story is no different in 2013.
Bullpen
Steve Cishek Fist Pump
The Marlins possess sought after relievers Steve Cishek, Mike Dunn, Ryan Webb, and Chad Qualls. Cishek, Dunn, and Webb still have multiple years under team control, while Qualls’ is signed on a one-year deal. Of the four, I would be most inclined to keep Cishek, who is currently closing games for the Marlins, and doing so extremely well. Qualls is the most likely to be dealt, as the Marlins don’t want to part with valuable bullpen arms who could contribute to next year’s team. Also, they don’t want to leave the young starting rotation with an inexperienced bullpen to back them up for the remainder of this season. Qualls would be a rental reliever for any team, as a 34 year-old journeyman doesn’t scream “Long-term plans”. Nevertheless, Qualls has caught fire in 2013, putting up the best season of his career. Through 42 IP in 42 Appearances, Qualls has put up a 2.57 ERA, 1.024 WHIP with a 7.29 K/9 and a 1.93 BB/9 leading to a 3.44 FIP.
The Marlins dealt relief to a contender at last year’s deadline as well, sending Edward Mujica to the Cardinals for 3B prospect Zack Cox. Mujica had a 4.38 ERA at the time he was sent to St. Louis, so Qualls’ numbers are significantly superior. However, Mujica was just 28 at the time, and still had a year of Arbitration remaining, which increased his value. All things considered, Qualls should be able to produce the same return as Mujica did, possibly more. What Mujica brought in was fairly significant. Zack Cox was the Cardinals #4 prospect heading into 2012 by Baseball America. He was drafted in the first round out of the University of Arkansas in hopes that he would develop into a premier hitter. He showed that ability during his first full minor league season in 2011, but fell off dramatically in 2012, hitting .254/ .294/ .421 in the hitter-friendly Pacific Coast League. Cardinals management decided it was time to move on from Cox, and shipped him to the Marlins, who sent him back down to AA. Cox has been solid in AA this season, hitting .292/ .393 / .391. his power numbers decreased, but he’s hitting more consistently as the Marlins are allowing him to take a slow track through the system. He has the Marlins’ future 3B job in his sights, but will be competing in the system with recent 1st round pick, Colin Moran out of UNC.
In my opinion, the Marlins sold Mujica enormously high The Cardinals’ frustration with Cox allowed him to be moved at a fairly cheap price, and it’s difficult to say that this trade is comparable to what the Marlins can get for Qualls. Nevertheless, this shows that the Marlins can target mid-level prospects (or seemingly declining former top level prospects) in exchange for Qualls.
Decision: Avoid trading Qualls for the sake of trading him. Aggressively shop him around, but if the return isn’t right (comparable to Mujica’s return), try to negotiate a 2014 contract in the off-season. Cishek, Dunn, and Webb are main contributors to the Marlins bullpen, and with the team appearing to be a contender in 2014, I would want to keep that consistency.
OF Justin Ruggiano
Veteran Position Players
The Marlins could potentially move Placido Polanco, Juan Pierre, Greg Dobbs, and Justin Ruggiano. Polanco and Pierre are signed to one-year deals, and will be Free Agents after the season. Dobbs is in the last year of a two-year contract. All four are most likely fits on the bench for a contender, and none of them would be able to bring in a significant return. Ruggiano had a breakout year in 2012, his first full season, hitting .313/ .374/ .535 in 91 games. However, he’s slumped this year, removed from his everyday role, floating around a .200 batting average. He holds the most value, as he still has another season before he’s arbitration eligible, and teams may hope that he returns to his 2012 form. However, his remaining pre-Arb year is valuable to the Marlins as well, who didn’t want to move him a few weeks ago. The Marlins called up their top two outfield prospects last week, which makes Ruggiano slightly more available.
Decision: Without much to gain in return, I’d hold on to the veterans, and try to retain Polanco, Pierre, and Dobbs for another year to serve as valuable bench players for the 2014 season.
Giancarlo Stanton
The feature of this article, and many national news stories is Right Fielder Giancarlo Stanton. I’ve admittedly flip-flopped back and forth about what the Marlins should do with the face of the franchise. He’s 23 years old, and will be arbitration-eligible for the first time after this season, which will increase his salary by a couple million dollars. He led the league in slugging in 2012, and had already amassed over 100 career Home Runs. He is a budding superstar, and teams are willing to pay a very high price for him.
Keep Him
Giancarlo Stanton
The Marlins are historically known to being a penny-pinching team, but are in a position to spend big money, which they have available to give to Stanton. If the Marlins stick with Stanton, I see them avoiding arbitration this year with a one year deal in the neighborhood of $7-8MM. I then project him to earn $10-12MM after 2014, and $13-15MM after 2015. To avoid paying Stanton $13-15MM for 2016, and then have a future long-term deal based on that salary structure, I would begin working on a back-loaded multi-year deal immediately after the season. My first offer of a proposed contract would follow a similar structure to my predicted arbitration salary hike, but then level off around $17-18MM for 2016 and beyond. Miguel Cabrera, former Marlins emerging offensive superstar, signed a long-term deal with the Tigers in 2008, which levels off at about $20MM per year. In my opinion, Stanton has shown the potential to deserve a similar contract, but there is no way that I would begin the negotiations at Miguel Cabrera’s deal.
Trade Him
Dontrelle’s Delivery
Stanton’s value is as high as it’s ever been. As mentioned before, he’s an emerging superstar who is just reaching arbitration for the first time. Comparing him again to Cabrera, the Marlins traded him after the 2007 season to the Detroit Tigers along with pitcher Dontrelle Willis for the Tigers #1, 2, 6, 8 rated prospects according to Baseball America, along with other mid-low level players. The Marlins would be able to reel in at least three of a team’s top ten prospects, ideally two of the top five. In my opinion they should throw in one of the relievers teams have been calling for (preferably Qualls) to bump up the level of the prospects they would receive.
The most important thing to consider in this situation, is that the Marlins already have multiple potential replacements for Stanton. According to Baseball America, three of the Marlins’ top five prospects are outfielders, all of whom have been in the majors this season (Christian Yelich #2, Jake Marisnick #4, Marcell Ozuna #5). Beyond those three, they also feature Jesus Solorzano, Austin Dean, Brent Keys, and Isaac Galloway in a rich system of minor-league outfielders. Stanton is simply not at a premium position of need for the Marlins, which in my opinion makes him expendable. Also, the millions of dollars that would be used to lock up Stanton could be better used to lock up the Marlins phenomenal young pitching staff.
Don’t Trade Him
The rebutting argument against trading Stanton is how unpredictable trading for prospects can be. Once again, the Marlins traded Miguel Cabrera and Dontrelle Willis to the Tigers for four of their top ten prospects, including #1 and #2. A total of zero of them are still with the Marlins, and Cameron Maybin (#1) and Andrew Miller (#2) never lived up to their potential. All those two names do is make Marlins fans cringe. Bad trades happen, Major Leaguers are known commodities, while prospects are prospects, something that might be good in the future. The unpredictability and risk of trading Giancarlo is something that cannot be over-analyzed.
Decision: Make Stanton Available, and listen to offers, but don’t undersell him
Yelich at the 2013 Futures Game
If a team wants to give you their entire future, then by all means go for the trade. But if I’m Michael Hill, and I’m not receiving everything that I want from a team, then there’s no deal. If I’m trading Giancarlo Stanton to your team, I want to be able to go through your organization, and hand-pick the players I want like I’m at a buffet. If any compromise has to be made, then it’s no deal. Stanton won’t break the bank in the off-season, and it’s worth keeping him around to see if the Marlins can be truly competitive in 2014, which I believe is very possible, barring unforeseen injuries.
Needs
Jose Fernandez
The most difficult part about making trades for prospect is to decide where you need help. The Marlins are set in the outfield, no question about that. 3B seems locked down with Cox and Moran, and I’m a big fan of future Gold Glove winner Adeiny Hechavarria at SS. Derek Dietrich hasn’t been amazing at 2B, though I really like Ed Lucas. If only he wasn’t 31. Donovan Solano could still be a fit, but this is a position that could use improvement. At 1B, there isn’t much behind Logan Morrison, who is finally fully healthy. Rob Brantly has been a disappointment behind the plate after impressing at the end of 2012 after he came over from the Tigers for Omar Infante and Anibal Sanchez. Brantly is still just 24, but is hitting .232/ .283/ .294 while splitting time with Jeff Mathis. Former first round pick Kyle Skipworth hasn’t been able to hit at any level, and relying on J.T. Realmuto to be the future isn’t a safe bet. The Marlins pitching is phenomenal, led by Jose Fernandez, and followed by Nate Eovaldi, Jacob Turner and Henderson Alvarez. The Marlins also have Andrew Heaney and Justin Nicolino in the minors among others with a young pitching staff whose future is just as bright, if not brighter than the Marlins’ outfield crop.
Trade Possibilities
Chad Qualls
2B Kolten Wong
If we assume that Chad Qualls can bring in a similar return to Edward Mujica, then we’re talking a downward-trending lower high-level prospect (if such a thing exists) or a mid-level prospect. I love what the marlins did in the Mujica trade, by taking a risk on a possible high-level guy, who is having a bad season. If the Marlins deal with the Cardinals again, Kolten Wong’s name has been thrown around, as he’s blocked at the Major League level by Matt Carpenter. However, the Marlins aren’t likely to be able to put together the package for him without having to part with an integral piece. His name has been linked to a potential Alexei Ramirez trade, who holds more value than Qualls. The Marlins would have to throw in another reliever or two (Dunn, Cishek, or Webb), or maybe even Derek Dietrich who replace Wong’s spot in the Cardinals system, obviously to a lesser extent. As an outsider, it’s unclear what the asking price is for Wong, but maybe the Cardinals could sell low again. Wong is more highly regarded than Cox was at this time last year, but then again Qualls has been better than Mujica was, and the Marlins have arms to give.
Giancarlo Stanton
SS/IF Xander Bogaerts
I’m trying very hard not to be one of those internet users who has no sense of trade balance, but it would take a completely unreasonable package for me to trade Stanton right now. The Red Sox reportedly are willing to give up everything to get Giancarlo. Any deal with them would need to include Xander Bogaerts, and Henry Owens, plus much more. Bogaerts plays the same position as Hechavarria, but could move over to 2B to create a stellar middle infield that already has me excited. Bogaerts, the Red Sox #1 prospect by BA, is a 20 year old from Aruba, who has absolutely torn it up in the minors. Owens, their #5 prospect, recently turned 21, and has pitched very well at High-A Salem. The Red Sox also have C Blake Swihart at #6 who is showing an upward batting trend. Their #2 prospect, former South Carolina Gamecock standout, Jackie Bradley Jr. has already spent time in the majors, but being an Outfielder isn’t necessarily attractive to the Marlins. Again, I’d just pick out the Red Sox star prospects, and if I can’t have everyone I want, then sorry Beantown, Giancarlo will still be a Marlin.
The Pirates and Rangers have also expressed interest in Stanton. For me, the Pirates would have to part with Gerrit Cole and Jameson Taillon at least. It would create a very crowded pitching rotation for the Marlins, but is that ever a bad thing? Unfortunately for the Pirates, many of their top prospects are Outfielders which doesn’t help. The Rangers have Jurickson Profar, who has been playing 2B. However, they just traded for Matt Garza which took a hit out of their system, and don’t have many other guys close enough to being Major league ready for me to feel comfortable about.
If Stanton does get traded, I’m thinking that it’s going to be the Red Sox.