Archive for Launch Angle

Did Sinkers Make the Comeback That Was Promised?

Back in mid-February — a truly different time for all of us — I applied to work at Statcast as an intern, a position that was unfortunately canceled in mid-March. However, I wrote an answer to a question that I intended to turn into an article at some point during the season. At the time, I figured I might write it in May, but a delayed season meant a delay to my piece as well.

Who would like to consider the curious case of Alex Presley? His career was relatively muted; he played for five teams in eight seasons as a fourth outfielder, only once cracking 100 games played and only once posting an OPS over .800. His Baseball-Reference page has him sporting a White Sox hat despite never having played a regular-season game for the team. He had a .620 OPS across 55 minor league games in 2018 and was released before he could make his way into July. He has the ignoble mark of having the second-lowest career WAR of any MLB player born in Monroe, Louisiana, finishing sixth out of seven players (Chuck Finley laps the field, and Presley finished above only Wayne Cage’s 0.1 career WAR). But Alex Presley was never supposed to be a star; rather, he was the now-forgotten harbinger of the launch angle revolution.

In the past several seasons, launch angle has absolutely been all the rage. Being able to capture new data has made an impact on the scene due in large part to fascinating statistics such as pitch movement, exit velocity, improved defensive statistics like OAA, and launch angle. During that time, teams have been changing their exit velocity drastically as well. In 2015, the earliest year with Statcast data, the measured average launch angle for all of baseball was 10.1. By 2019, it was 12.2.

In 2014, Pirates pitchers, the leaders of the sinkerball revolution, allowed an average launch angle of only 6.9 degrees. Since then, only three teams have been below 7.0 (the Rockies twice and the Cardinals once), and in 2018 and 2019, only three were under 10.0 and none were under 9.0. Additionally, even though the Pirates led the league in Barrel% by over a percentage point in 2014, the top teams in Barrel% in 2019 were much closer to a league-average launch angle. The data makes it clear: Launch angle is certainly going up. Read the rest of this entry »


Marcell Ozuna Has a Slice

This article was originally published at Birds on the Black, a St. Louis Cardinals blog. You can find the blog (@birdsontheblack), author (@zjgifford), and artist (@cardinalsgifs) on Twitter.

Back in November, the FanGraphs staff ranked Marcell Ozuna as the seventh-best available free agent. In that article, Kiley McDaniel and the FanGraphs crowd both expected Ozuna would receive a four-year deal, with the median crowdsource estimate coming in at $64 million ($16 million per year) while McDaniel was a little higher at $70 million ($17.5 million per year). Teams could dream on Ozuna’s potential and a return to his 2017 production with relatively minimal risk — since his 2013 debut, Ozuna has consistently produced as an average or better player. Coming into this offseason, he had produced more than 2 WAR in four straight seasons dating back to 2016. Free agents are never a sure bet, but Ozuna seemed pretty close to one at a reasonable price.

Ozuna ended up betting on himself by taking a one-year deal with Atlanta, which was a bit of a surprise. With that context, I wanted to see what happened during his breakout 2017 campaign and what might be holding him back from tapping back into that potential. We’ll start with some numbers: Read the rest of this entry »


What Would it Have Taken for Aaron Judge to be Clutch?

During one of my recent visits to the Fangraphs home page, while scrolling across the leaberboards, I was confronted by a fact I had once known but had long ago forgotten over this slow and tired off-season. Aaron Judge led the league in WAR! as a rookie?! and by quite a wide margin. That happened last season? Shoot just over a year ago Judge was still relatively unknown and Jeff Sullivan was telling us not to underestimate his power.

This realization conjured up memories of last season’s AL MVP vote, how one of Sabermetrics’ patron saints shook the foundations of Sabermetrics’ most prominent statistical achievement, and how article after article were written about clutch hitting.

This, in turn, reminded me of another leaderboard Judge topped last season, this one more dubious. He led (lagged?) the league with the lowest Clutch score. He was fourth in WPA/LI with 5.85 Wins, trailing only this generation’s Mickey Mantle, Judge’s clone, and some guy who plays for the Reds and just a fractional win behind the leader. In contrast, he ranked just 38th in WPA tied with some guy who used to play in Korea. Add this up and he had by far the lowest Clutch score at -3.64 wins, a full win lower than the rest of MLB save for one blue-eyed Cub.

Which led me to ask the question: What would Aaron Judge have had to do to be a clutch batter? And I don’t mean the obvious answer, “Hit better in high leverage situations“. Duh! He batted an astounding 190 wRC+ in low leverage situations to just a 107 in high leverage at bats. But that’s not the answer I was looking for. I wanted to know specifically, what would Aaron Judge have had to do to be a clutch batter? as in what could we change from his epic near MVP season to bring his Clutch stat into the positive?

So I set to find out.

Using Fangraph’s own Play Log, and with plenty of assistance from BaseballSavant.com and Statcast, I decided to play as one of the “Baseball Gods” and see if I could tweak a few of Judge’s plays to make him more clutch. As a “Fair and Just Baseball God” I wouldn’t be aiming to increase Judge’s overall stat line. If I nudge a groundball a little to turn an out into a single in a high leverage situation, I’d do the opposite in a low leverage situation (Judge had nearly 50 PA’s with a Leverage Index, LI, of effectively 0) nudging another grounder into a fielder’s glove for an out.

Thus his overall stat line and his WPA/LI would remain effectively the same, and since in those low leverage situations no (or nearly no) WPA was added, we’ll only be looking at how the play’s I change increase Judge’s WPA.(And I’ll only be going through the plays I add not the ones I’d need to take away.) I also won’t worry about any of the time traveler unintended consequences stuff, I’ll assume that only the single event changes without it affecting other plays in the same game or others. (I’ll let some of the other “Baseball Gods” worry about that stuff…)

Recall the Equation for Clutch:

Clutch = (WPA)/(pLI) – (WPA/LI)

With my rule that Judge’s pLI (0.95) and WPA/LI (5.85) will remain fixed we are just looking to increase Judge’s WPA.

With that lengthy explanation out of the way, let’s begin!:

Judge Initial WPA = 2.10
_________________________________________________________
Situation #1:

July 27th, Bottom 9, 1 Out, Runner on Third, Yankees down 1.
LI = 5.81 – Actual Play – Judge Fly’s Out to Right. – WPA = -.252

We’ll start with a big one, in fact Judge’s second highest leverage play of his season!
With a chance to tie the game in the 9th, Judge just miss-hits the ball sending it not quite far enough to allow the speedy Brett Gardner to score from third. As you can see, similar hit balls all had the same result:

”7/27/2017”
But as my first act as “Baseball God” I’m gonna adjust this hit ever so slightly, notching Judge’s bat up a millimeter to two to lower the Launch Angle of this hit and allow it to carry just a bit further. Something more like this:

”7/27/2017_Alt”
That should be far enough out to score Gardner giving Judge a Sac Fly.

New Play – Sac Fly – New WPA = .112 – Net WPA Change = .364

Judge’s New WPA = 2.46
_________________________________________________________
Situation #2:

August 2nd, Bottom 8, No Outs, Runner on Second, Yankees down 2.
LI = 2.72 – Actual Play – Strike out swinging. – WPA = -.08

Sometimes the job of a “Baseball God” is rather easy. In this case I’ll just need to do some umpire convincing. In this at bat Judge struck out on a 3-2 slider, but earlier in the at bat, after three wild pitches, here was the 3-0 offering from Bruce Rondon:

”8/2/2017”

Ok, sure, most umpires probably call this a strike on a 3-0 count, but I’m gonna go ahead and give this one to Judge. Ball Four!

New Play – Walk – New WPA = .087 – Net WPA Change = .167

Judge’s New WPA = 2.63
_________________________________________________________
Situation #3:

September 19th, Bottom 2, 2 Outs, Runners on Second and Third, Tie Game.
LI = 2.03 – Actual Play – Fly out to Center. – WPA = -.061

Judge crushed a Jose Berrios offering at 107 MPH:

Here’s what it looked like.

He was just a little under this one, wouldn’t take much more to send this ball out. So we’ll make the charge and turn this loud out into a bomb.

New Play – Three Run Home Run – New WPA = .249 – Net WPA Change = .310

Judge’s New WPA = 2.94
_________________________________________________________
Situation #4:

September 9th, Top 9, No Outs, Runner on First, Tie Game.
LI = 3.40 – Actual Play – Fielder’s Choice to third, out at second. – WPA = -.084

Judge grounds one to third, and nearly into a double play.
Here’s what it looked like.

Thing is, Rougned “De La Hoya” Odor is in such a hurry to turn two that it almost looks like he jumps off Second too early. Take a closer look:

”8/2/2017”

Your guess is as good as mine, but here’s the thing: As a “Baseball God“, I don’t have to guess. I’ll just make the throw from third just a little higher and wider pulling Odor off the bag and leaving both runners safe on a throwing error. Did you know that errors count as positive WPA plays?!

New Play – Reach on Error, Throwing Error at Third, Runners safe at First and Second – New WPA = .109 – Net WPA Change = .193

Judge’s New WPA = 3.13
_________________________________________________________
Situation #5:

August 18th, Top 6, 2 Outs, Bases Loaded, Yankees down 1.
LI = 4.52 – Actual Play – Ground Out to Shortstop. – WPA = -.119

Judge hits a sharp ground ball at 103 MPH.

Here’s what it looked like.

Hit hard, but right into Xander Bogaerts‘ glove for a routine out. But per Statcast balls hit at that Velocity and at that Launch Angle become hits about half the time.

One can imagine Judge hitting this ball just a little closer to the pitcher’s mound, and seeing it get past a diving Bogaerts. With the runners going, that hit would easily score 2.

New Play – Ground Ball Single up the Middle Scoring 2, – New WPA = .275 – Net WPA Change = .394

Judge’s New WPA = 3.53
_________________________________________________________
Situation #6:

June 14th, Top 7, No Outs, Runners on First and Second, Tie game
LI = 2.89 – Actual Play – Fly Out to Left. – WPA = -.085

Judge ropes one into left field, where Eric Young Jr. makes an awkward dive for it.

Here’s what it looked like.

Young makes the out, but just barely. Imagine if his dive is just a little more awkward… That ball probably gets by him and clears the bases.

New Play – Bases Clearing Double to Left Field – New WPA = .219 – Net WPA Change = .304

Judge’s New WPA = 3.83
_________________________________________________________
Situation #7:

June 15th, Top 9, No Outs, Bases Empty, Yankees down 1.
LI = 2.88 – Actual Play – Strike Out Looking. – WPA = -.073

Were picking up steam now! And as a “Baseball God” I haven’t had to work very hard changing these last few plays. Now it’s time to work just a little harder.

Leading off a do or die ninth, Judge took three easy balls, then saw and fouled consecutive fast balls. This set up a full count pitch where Santiago Casilla froze him with a beautiful knuckle curve. Here’s what it looked like.

”6/15/2017”
No doubt that’s a beautiful pitch. But guess what? Umpires sometimes miss calls, especially when they get some inadvertant dust in their eye…

New Play – Walk – New WPA = .110 – Net WPA Change = .183

Judge’s New WPA = 4.02
_________________________________________________________
Situation #8:

September 10th, Top 3, 1 Out, Bases Loaded
LI = 2.26 – Actual Play – Sac Fly to Right. – WPA = -.002

In an RBI situation, Judge blasts one.

Here’s what it looked like.

So Judge clearly gets under this pitch… but he still hit it over 300′ and scores a run.
The thing is the next two times up he did this and this!
I’m just gonna do a little rearranging on when these homers take place…

New Play – Grand Slam to Right – New WPA = .256 – Net WPA Change = .258

Judge’s New WPA = 4.27
_________________________________________________________
Situation #9:

April 18th, Bottom 9, 2 Outs, Bases Loaded, Yankees Down 3
LI = 3.86 – Actual Play – Fielder’s Choice to Shortstop, Out at Second. – WPA = -.100

Judge ends the game on a weakly hit grounder to shortstop.

Here’s what it looked like.

Looks like a routine grounder, but per Statcast similar balls become hits about a third of the time. And we don’t really need a hit here, Tim Anderson looks a little shaky fielding the grounder as it hops to his glove. In a critical situation like this who’s to say he doesn’t boot one? The answer is me, the “Baseball God“. I say he boots it…

New Play – Fielding Error at Shortstop, 1 Run Scores – New WPA = .090 – Net WPA Change = .190

Judge’s New WPA = 4.46
_________________________________________________________
Situation #10:

July 21st, Top 3, 1 Out, Runners on First and Third, Tie Game
LI = 2.12 – Actual Play – Sac Fly to Center. – WPA = +.016

Another well struck ball that just stays in the yard for a sac fly.

Here’s what it looked like.

But Judge would get one more try at Andrew Moore that game, and you may remember it. Judge’s next at bat was that time he broke Statcast!

I’m just gonna move that Statcast breaking smash up one AB if you don’t mind…

New Play – Three Run Home Run – New WPA = .216 – Net WPA Change = .200

Judge’s New WPA = 4.66
_________________________________________________________
Ok, awesome we’re 10 plays in, and as a “Baseball God” I don’t feel like I’ve had to work all that hard. But were still only at 4.66 WPA, nearly a win short of our target. It’s time to pull out the big guns. It’s time to perform a MIRACLE!

Situation #11:

July 30th, Bottom 9, 1 Out, Runners on First and Second, Yankees down 2.
LI = 4.78 – Actual Play – Foul out to First. – WPA = -.112

Representing the go ahead run, Judge pops up in foul ground to the first baseman. You can see his hit in blue in the image below.

”7/30/2017”
(As to why this shows up as a -57° LA I think sometimes Miracle Work messes with Statcast…)

Just a lazy pop-up. Not much a “Baseball God” can do to affect this play without revealing myself to the world. So I’ll just void the play and blows this ball a little further to the right and into the seats where Trevor Plouffe can’t catch it!

So I’ve just given Judge a new lease on this particular at-bat. I hope he uses it wisely. I’ll just assume it goes something like this!

New Play – Walk Off Three-Run Home Run – New WPA = .793 – Net WPA Change = .905

What?! You don’t think that’s fair. Tough! I am Beerpope the Baseball God and this is my Miracle, don’t tell me what’s fair!

Judge’s New WPA = 5.57

And with that spectacular finish, we check Judge’s Clutch score:

5.57 / 0.95 – 5.85 = +.01 Wins

And there you have it. Aaron Judge – CLUTCH BATTER. My work here is done.

So what does this all mean? Really I’m not sure. Does the fact that it took 10 twists of fate and one walk-off miracle just to bring Judge barely into the positive show just how deeply un-clutch he was last season? Maybe. But it may also show us how futile it is to focus of how clutch or un-clutch a batter is if an ump call, miss hit, or bounce here or there in just 10 at bats can invalidate the other 600 plus plate appearances in a player’s season.

I’ll leave that determination to the readers.

Now enough with the 2017 Season. It’s time for me to begin contemplating what Miracles to perform thus upcoming season…

Cheers!


What About Batted Ball Spin?

Recently, for my job, I got to mess around with Statcast data for fly balls. I have a good job. As part of the task I was working on, I attempted to calculate the maximum heights and travel distances of fly balls using my extensive ninth-grade physics knowledge. Now, I was excellent at ninth-grade physics, especially kinematics, but my estimates, compared to the official Statcast numbers, were terrible. Figuring the discrepancies must be due to air resistance, I did my best to remember AP physics (with the help of NASA) and adjusted my calculations for drag. The results improved, but were still way off. There are many additional factors that affect the flight of a fly ball such as wind, air temperature and altitude, but I think the biggest factor causing the inaccuracy of my estimates is batted-ball spin. (If you disagree, let me know in the comments.) Exit velocity and launch angle get all the attention when discussing batted-ball metrics, but the data I was looking at suggested that batted-ball spin merits attention too. Are there batters who are consistently better at spinning the ball than others, and if so, is this a valuable skill?

We already know that balls hit with top-spin sink faster than normal while balls hit with back-spin stay in the air longer. It’s unclear, though, whether it’s better for the batter to hit the ball with more or less spin, and whether top-spin or back-spin is more beneficial. Back-spin would seem to be better if you are a home-run hitter while top-spin might be more beneficial if you are a line-drive hitter.

As far as I know, Statcast doesn’t measure batted-ball spin, and if it does, it’s not available on Baseball Savant. So to act as a proxy for spin, I calculated the estimated travel distance (adjusted for air resistance) from its launch angle and exit velocity for every line drive, fly ball and pop up hit in 2016 and subtracted this number from the distance estimated by Statcast. The bigger the deviation between these two numbers, the faster the ball was spinning, theoretically. Balls with positive deviations (actual distance > estimated distance) must have been hit with back-spin and balls with negative deviations (actual distance < estimated distance) must have been hit with top-spin.

The following table shows the 20 hitters (min. 50 fly balls hit) who gained the most distance on average in 2016 due to back-spin:

Batter Name Number of batted balls Avg Statcast Distance (ft) Avg Estimated Distance (ft) Avg Deviation (ft)
Travis Jankowski 87 254 235 19
DJ LeMahieu 213 282 264 18
Carlos Gonzalez 226 293 276 17
Daniel Descalso 102 285 270 14
Max Kepler 150 285 271 14
Billy Burns 108 234 221 13
Rob Refsnyder 57 269 257 12
Jarrod Dyson 98 243 232 11
Martin Prado 256 262 251 11
Ketel Marte 154 250 239 11
Justin Morneau 73 278 268 11
Gary Sanchez 66 323 312 11
Tyler Saladino 107 270 260 10
Phil Gosselin 77 264 253 10
Jose Peraza 107 257 248 10
Mookie Betts 311 279 270 9
Melky Cabrera 280 271 261 9
Ichiro Suzuki 137 251 242 9
Omar Infante 68 269 261 9

With a few exceptions, these are not home-run hitters. This group of 20 players averaged 8.25 home runs in 2016. The players who are getting the most added distance on their fly balls are not the ones who need it most. (Note: four players on this list and three of the top four players played their home games at Coors Field. Did you forget that Daniel Descalso played for the Rockies last year? Me too.)

What about the other end of the spectrum? The following are the 20 players who lost the most distance on average in 2016 due to top-spin:

Batter Name Number of batted balls Avg Statcast Distance (ft) Avg Estimated Distance (ft) Avg Deviation (ft)
Colby Rasmus 136 285 306 -21
Tommy La Stella 72 273 294 -21
Brian McCann 195 273 294 -22
Todd Frazier 248 276 297 -22
Jorge Soler 88 278 300 -22
Brian Dozier 263 287 309 -22
Curtis Granderson 238 284 306 -22
Franklin Gutierrez 76 304 327 -23
James McCann 131 277 300 -23
Miguel Sano 158 301 324 -23
Khris Davis 213 303 326 -23
Freddie Freeman 269 289 312 -23
Mike Napoli 205 290 315 -25
Chris Davis 207 304 330 -26
Tyler Collins 54 270 296 -26
Ryan Howard 129 306 334 -28
Kris Bryant 284 281 309 -28
Jarrod Saltalamacchia 96 290 321 -31
Mike Zunino 63 295 327 -33
Ryan Schimpf 122 298 331 -33

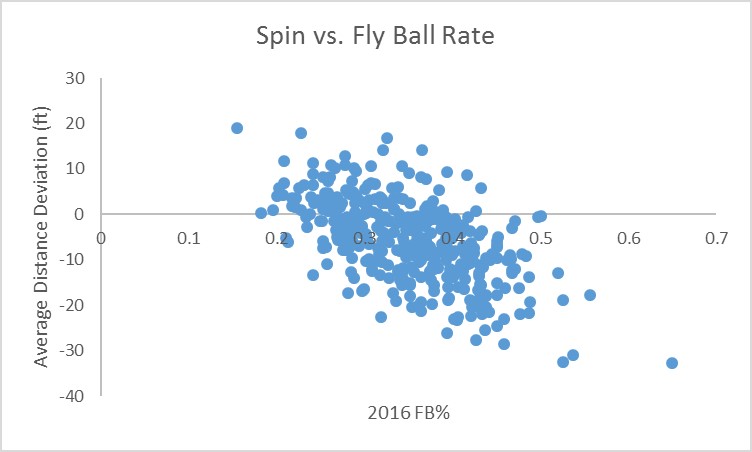
Kris Bryant, Miguel Sano, Ryan Schimpf: this list is full of extreme fly-ball hitters with an average of 24 home runs last year. The scatter plot below with a correlation of -0.58 shows the relationship between batting spin and fly-ball percentage for all players in 2016.

Mountain View

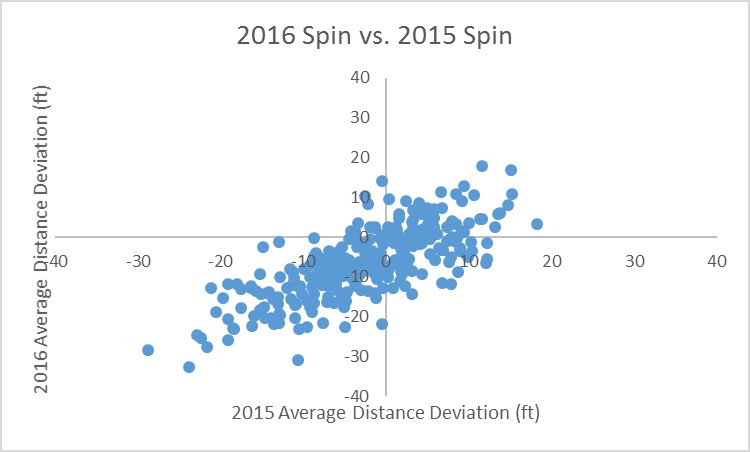
And this isn’t just a one-year phenomenon. I was relieved to find out that the correlation between 2016 average distance deviations and 2015 average distance deviations is 0.75. Players who hit balls with a lot of spin in 2015 overwhelmingly did so again in 2016. Again, the plot below shows the strong relationship.

Mountain View

Mechanically, this is not such a surprising result. Players with a more dramatic uppercut swing (like a tennis swing) will impart more top spin onto the ball while the opposite should be true for players with a more level swing.

It remains to be seen whether this knowledge is useful in any way or if it falls more into the “interesting but mostly irrelevant” category of FanGraphs articles. There is essentially no relationship between a player’s average distance deviation and his wRC+ (correlation = -0.13), so we cannot say that spinning the ball more or in either direction leads to better results. And I imagine it is difficult to alter one’s swing to decrease top-spin while still trying to hit fly balls. At best, maybe this is a cautionary tale for players who want to be more hip and trendy and hit more fly balls like James McCann (FB% = 0.41), but don’t have the raw power to absorb a loss of 28 feet per fly ball (HR = 12, wRC+ = 66).

Let me know what you think in the comments.


Why Doesn’t Mauricio Cabrera Strike Out More Batters?

For many years, the undisputed king of velocity in Major League Baseball has been Aroldis Chapman, with his fastball that averages around 100 mph and regularly reaches higher. Few pitchers have even been able to approach the level of Chapman’s fastball since he came into the league, and none have surpassed him. However, in 2016, one pitcher finally did it. Mauricio Cabrera of the Atlanta Braves averaged nearly 101 mph on his fastball in 2016 and he regularly touched 103; but yet there was still a major difference between Cabrera and the incredible Chapman. Chapman struck out over 40% of the batters he faced last year, while Cabrera struck out less than 20%. Strikeouts are intuitively related to fastball velocity. The faster that a pitcher can throw the ball, the less time a batter has to react, making it harder to make contact. So how does a pitcher such as Cabrera, who throws as hard as anyone in the game, strike batters out at a well below-average rate?

I first thought that maybe his perceived velocity is not as great as his actual velocity, and sure enough Cabrera does gets very little extension toward the plate when he delivers the ball. He only extends about six feet toward the plate before he releases the ball, which is a full foot shorter than fellow reliever, Zach McAllister, and several inches shorter than average for fastball-heavy relievers. This lack of extension means that the velocity that the batter perceives is slower than the actual velocity coming out of Cabrera’s hand, because it has farther to travel before it gets to the plate. However, this is only a minor difference, as Cabrera’s perceived velocity is still above 100 mph. This is not a huge drop, but it does bring him closer to the pack, as many relievers get good extension that increases their perceived velocities above their actual velocities. Chapman, for instance, gets great extension toward the plate on his already incredible fastball, which results in his excellent perceived velocity of over 101 mph. Cabrera’s lack of extension is likely a contributing factor to his low strikeout numbers, but it does not seem to be the main culprit.

Next, I wanted to see if there was something about the spin rate on his fastball that doesn’t lend itself to strikeouts. Spin rates correlate quite strongly with strikeout rates. Pitchers with high spin rates on their fastballs typically generate more swings and misses, and thus more strikeouts. It turns out that Mauricio Cabrera does have a low spin rate on his fastball. His fastball spin rate of 2300 rpm is well below average for fastball-heavy relievers, which is probably a major reason why he doesn’t miss many bats.

While it makes intuitive sense that something like the amount of spin on his fastball could be the reason for his low strikeout totals, it is still puzzling to see that his spin rate is so low, because spin rate is typically correlated with velocity. For most pitchers, the harder you throw, the more spin you will put on the ball. Aroldis Chapman, for example, has one of the highest spin rates in the sample. In order to single out the spin rate from the velocity, I divided the spin rate by the velocity to find the Bauer Unit, named after Indians pitcher Trevor Bauer. Cabrera’s average Bauer Unit of 22.85 is one of the lowest in the entire sample of fastball-heavy relievers. This means that he has some of the lowest spin per MPH in the game. There must be something inherent in how Cabrera throws a baseball that just doesn’t allow him to generate the amount of spin that is typically commensurate of how fast he throws.

Cabrera’s low spin is not all bad, though. Just as high spin rates lead to strikeouts, low spin rates lead to ground balls. An average spin rate is really where you don’t want to be, as those are the pitches that get squared up more often. While Cabrera actually has an above-average spin rate for the entire population of major-league pitchers, his spin rate is one of the lowest in the league compared to his velocity. This effectively makes him a low-spin pitcher, and last year’s batted-ball numbers bear that out. Nearly 50% of the batted balls Cabrera gave up last season were on the ground, and he didn’t surrender a single home run all season despite giving up the hardest average exit velocity in the game last year on his fastball. Cabrera got away with that extreme exit velocity by only allowing an average launch angle of 5.9 degrees, which was one of the lowest among the fastball-heavy relievers. It is hard to do much damage on balls hit on the ground, even if they are hit 95 mph. While the myth that the harder the ball is thrown the harder the ball can be hit has largely been disproved, it is interesting to see that the pitcher who throws the hardest also gave up the highest average exit velocity.

Of course, strikeouts aren’t just about swinging strikes; you have to get called strikes as well. Throughout Cabrera’s minor-league career, he struggled to throw strikes consistently. So much so that many thought his strike-throwing ineptitude might prevent him from ever even reaching the big leagues. However, once he started pitching in the majors, he suddenly discovered how to find the strike zone. Of course, walking four and a half batters per nine innings is still poor, but that mark represented his lowest walk rate since rookie ball in 2012. Even with the high walk rate last year, he actually threw strikes at an above-average rate. His Called Strike Probability, according to Baseball Prospectus, was 47%, which is slightly above league average. For a guy like Cabrera who has always struggled with control, it is probably a good thing to see him filling up the strike zone at an above-average clip. However, the tendency to pitch within the zone could result in more contact and thus bring his strikeout numbers down. Since he doesn’t command his pitches well, he cannot nibble at the corners or trust himself to throw his pitches just off the plate to generate swings and misses. This allows hitters to either lay off pitches that are safely outside, or lock in to the pitches that are squarely in the zone. This could be another significant cause for his lack of strikeouts.

Another reason Cabrera doesn’t strike out many batters is because he doesn’t possess a bat-missing secondary offering. His secondary pitches are all used primarily to get hitters off of his fastball. He throws the hardest change-up in baseball at 91 mph, and a mid-80s slider with good depth. The change-up got squared up pretty often in 2016, which makes sense, seeing that he throws the pitch with the velocity of a league-average fastball. The slider also does not get many whiffs, but hitters were not able to do much damage off of it in 2016. Batters only slugged .136 off of his slider last season, and the pitch generated the highest rate of fly balls of any slider in the game. Perhaps what is even more significant is that hitters had an average exit velocity against his slider of 85 mph and an average launch angle of 30 degrees. For reference, hitters that hit the ball with an exit velocity of 85 mph at a 30-degree launch angle went 4 for 72. His slider may not be a swing-and-miss offering, but it sure seems to be a good out pitch for him.

It looks like Cabrera’s low spin rate on his fastball relative to its velocity is the main reason for his lack of strikeouts. However, it is also likely that that same low spin rate allows him to induce an extreme amount of ground balls, which helps him limit the damage from the opposing batter. His lack of extension toward the plate and his tendency to live in the strike zone are also contributing factors. He also doesn’t have a secondary offering that gets many swings and misses. His slider, however, does produce a great deal of pop-ups, which is another way he limits damage on his batted balls. A major reason for his success last season despite his low strikeout totals and high walk numbers was that he didn’t give up any home runs. While a complete lack of dingers is very unlikely to persist, the types of batted balls he allows on his fastball and slider make it difficult for batters to hit it deep off of him.

Cabrera walks too many batters, and while I wouldn’t be surprised to see some progression in his strikeout rate, I don’t expect him to ever strike out batters at the same rate as someone like Chapman. He should be able to persist for several years as a good late-inning reliever, but he probably will never reach the elite levels that his fastball might suggest.