
Who’s the Best (non-Bonds*) Baseball Family in History?
One of my favorite things about baseball is its deep reverence for history. While the relatively recent advent of sabermetrics is sometimes scorned by “traditionalists,” baseball has always been a data-loving sport. So much so, the man credited with inventing the box score all the way back in 1859 — a full year before Abraham Lincoln was elected President — was given a prestigious spot in the Hall of Fame. Any discussion of “who’s the best?” is always going to be subjective, and that’s part of the fun. Whether you’re a casual fan, avid Fangraphs reader, or true baseball historian, I think this article will offer some insight (and fun debate) for everyone.
As it happens, the term “WAR” meant something very different then.
Even casual baseball fans have an understanding of batting average, home runs, runs batted in — all statistics that have been around for more than a century — and still have plenty of relevance even in the era of analytics. Some might say, baseball’s respect for tradition runs so deep, that there was (and still is) a great deal of mismanagement and inefficiency in areas like scouting, player utilization, and player valuation. Perhaps one thing that worries traditionalists is that the game is being reduced to a “science” such that we are removing the fun of debating things like “who’s the best?” While I hope even staunch traditionalists understand that on-base percentage is more important than batting average in determining offensive value, allow me to put your mind at ease: we are a long, long, way from being able to predict with any reasonable accuracy/confidence how a player will perform. Suffice it to say, there is still plenty to debate when it comes to comparing players from past and present, and projecting the future. As you read, take part in the polls to cast your vote in the head-to-head “best family” debate. At the end, you can cast your overall vote.
In more than 140 years as the National Pastime, fewer than 20,000 players have ever played in a Major League Baseball game. For some perspective, only about 10% of players who are drafted will ever reach The Show; and even among first-round picks — youngsters so highly sought after that they are made millionaires before they even play a game in the minor leagues — only about two-thirds will make it the majors, and even most of them won’t amount to much. With so few players to ever make the big leagues, with so many barriers to success, it’s amazing to learn just how many had parents or siblings in the majors. Unlike a sport such as basketball where most players are very tall, thus heritability playing an obvious role, Major League Baseball players are mostly normal-sized human beings (the average player is about 6’1 190) with no immediately evident genetic superiority compared to the average Joe.
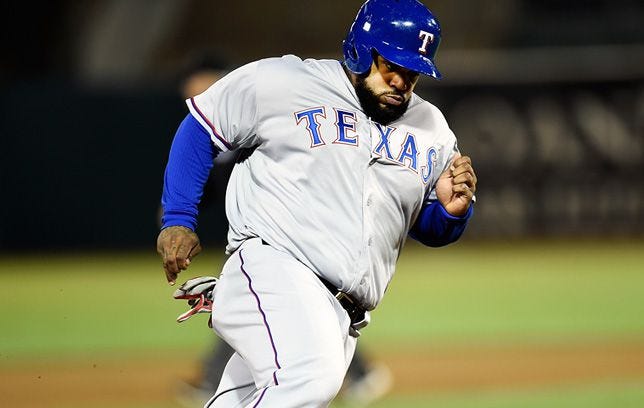
Pictured: elite professional athlete whose dad also played in the MLB (photo from Men’s Health)
Interestingly, genetics may actually play an even more vital role in success in baseball than in basketball. You have probably heard that hitting a baseball is the hardest thing to do in all of sports, and that’s probably true (Ted Williams said it, who am I to argue?). It’s not enough that pitchers throw the ball as hard as they can with pinpoint control, they also throw the ball as hard as they can with pinpoint control and make it move.
Good luck! (Source: MLB GIFS)
When it comes to hitting a baseball at the professional level, it requires an elite combination of hand-eye coordination, strength, reaction time, visual acuity, and I assume some sort of animal sacrifice. It turns out, the average MLB player has 20/12 vision. If you’re not sure why that is so insane, consider that the best possible vision a human could have is somewhere between 20/10 and 20/8. When your decision whether or not to swing — and how to position your hands and body for that swing — is within a window of literally milliseconds, the difference between elite and unknown could depend on a few extra milliseconds of pitch recognition. While vision is only one factor, it does appear to be an important prerequisite in success at the highest level. When you have such extreme outliers genetically, it at least somewhat answers the question “why have there been so many siblings/parents to play Major League Baseball?” Which brings us to the real question:
Who is the best family to ever play?
Here are the basic criteria I looked at in my research:
- Grandparents, parents, siblings — minimum 5 seasons played
- Fangraphs WAR
- Minimum of 6 “third-WAR” combined
- No family member active in the minor leagues
While WAR (wins above replacement) may be an imperfect statistic, it is a great place to start, as it allows us to compare players from different eras and players from different positions with one number. I decided to, admittedly somewhat arbitrarily, use the player’s third-best season in terms of WAR (third-WAR) to value them. To me, this fairly encompasses how good the player was in their prime, while excluding outlier seasons. It also avoids the difficulty of understating a player’s greatness just because they enjoyed a long career, as might happen if you simply used a career average or median, or overrating a player who was good for awhile but never great. Based on this, let’s take a look at some of the greatest baseball families:
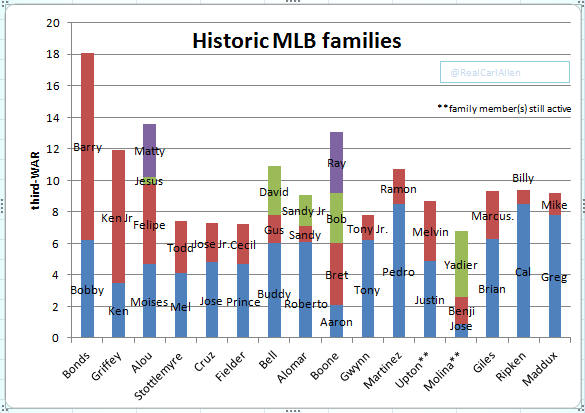
third-WAR is the player’s WAR in their third-best season. While somewhat arbitrary, it is a metric that reflects a player’s skill in his prime, while removing outlier seasons.
From this, as expected, the Bonds family is far and away the most impressive. While you may be thinking “but Barry’s career should have an asterisk” don’t forget that even before his alien stretch starting with 73 home runs he had already had some of the best seasons in baseball history. And his father Bobby was responsible for five of the first ten 30 home run/30 stolen base seasons in MLB history. After the Bonds family, who would you take on your father-son-sibling squad?
Before I did any research, the obvious answer seemed like the Griffeys. In a lot of ways, the Griffey family mirrors the Bonds’ in that dad was great but under-appreciated in his era, while Junior’s greatness had him in the conversation of “greatest of all time” during his prime. Of course, injuries plagued Ken Jr., while Barry enjoyed a long, healthy career. As I delved deeper though, I was surprised to find that the Griffeys may not even be the best baseball family in Cincinnati Reds history.
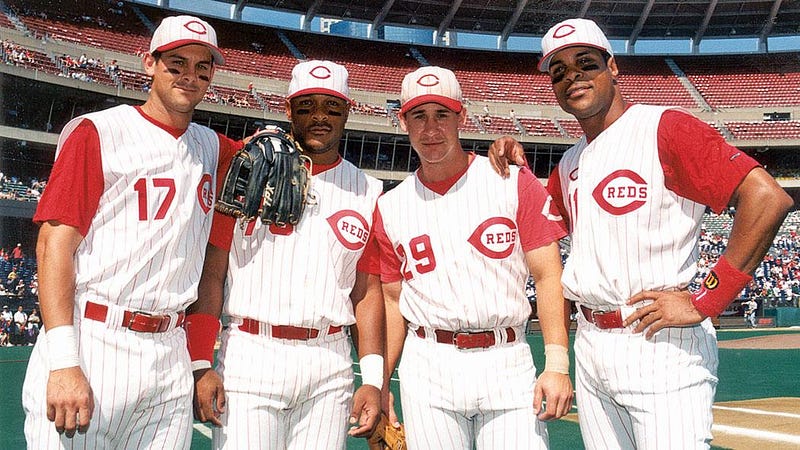
This Boone-Larkin-Boone-Larkin infield actually appeared together, but just once. Stephen Larkin, younger brother of Hall of Famer Barry, only played in one MLB game. (Photo credit Cincinnati Reds)
Four Boones or two Griffeys?
Now comes the discussion of quality over quantity. No one would argue that Ken Jr. in his prime wasn’t superior to any of the Boones, but the Boone package includes four very good players. To complicate matters in this very serious cross-generational debate, Aaron, Bret, Bob, and Ray even played unique positions for much of their career (3B, 2B, C, and SS respectively).
So who would you take? Below are the “third-WAR” seasons for each family.
Bret Boone, 2B: .278/.339/.462 (3.9 WAR) 24 HR/107 RBI, Gold Glove
Aaron Boone, 3B: .267/.327/.453 (2.1 WAR), 24 HR/96 RBI/23 SB
Bob Boone, C: .256/.310/.337 (3.2 WAR), 7 HR/58 RBI, Gold Glove
Ray Boone, SS: .295/.376/.466 (3.9 WAR), 20 HR/85 RBI/4 SB
Ken Griffey, LF: .294/.364/.454 (3.5 WAR), 13 HR/85 RBI/23 SB
Griffey Jr CF: .309/.408/.617 (8.4 WAR), 45 HR/109 RBI/17 SB, Gold Glove
Is there a wrong answer here? Looking only at WAR, the Boones edge out the Griffeys. The case to be made for the Boones is that you’d be able to fill four very important positions with all-star caliber players. But if you want to get technical, not all WAR is created equal (for example, one 8 WAR player is better than four 2 WAR players, because 2 WAR players are easier to replace). A superstar Junior and an all-star Senior is a very tough duo to pass on. But at the risk of repeating history and trading four players for Griffey (more on Mike Cameron in part two — dads with prospects) I’m going to go with the quartet of Boones.
What do you think? Go here to vote.
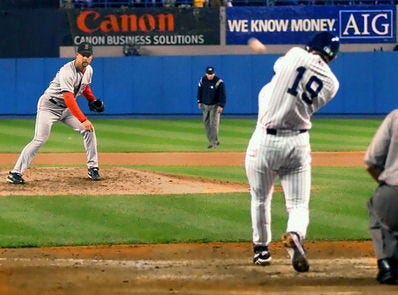
I’m not sure if “launching knuckleballs for game-winning home runs to send your team to the World Series” is a stat, but I know who leads it. (Photo credit: InsideSoCal)
What about the Alous?
Not to be outdone, the Alou family has an important place in this discourse, too. By the third-WAR metric, they actually edge out the Boones for the #2 spot. The four big leaguers from their family present a noteworthy, even if less well-rounded bunch than the Boones:
Moises Alou, OF .339/.397/.592 (4.7 WAR), 22 HR/78 RBI/7 SB
Felipe Alou, OF .297/.338/.481 (5.1 WAR), 23 HR/78 RBI/8 SB
Jesus Alou, OF .324/.345/.417 (0.4 WAR), 2 HR/19 RBI, 3.3% K%
Matty Alou, OF .338/.372/.413 (3.4 WAR), 2 HR/28 RBI/16 SB, 7.2% K%
Moises and Felipe make for a formidable tandem themselves, but the high average and contact rates of Jesus and Matty are what makes this foursome competitive with the Boones. Ignoring the fact that we have four outfielders (Matty and Felipe both played some first base as well) this group compares favorably to the Boones on paper; Moises and Felipe would be preferable to any of the Boones, while Matty is a fun guy to remember and had a nice career too. But for me, the fact that the Boones cover three premium positions (C, 2B, SS) makes up for the less impressive offensive numbers. Perhaps I’m biased in that I grew up watching Aaron and Bret, while Moises is the only Alou I had a chance to see play.
In any case, the WAR (which does take into account positional value) disagrees with my opinion — what do you think? Vote here.

“Your opinion is wrong” is how every good debate should end.
Bells and Alomars
Moving on to the trios, we’ll start with the Bell family. We have Buddy, one of the most underrated players in history, leading the group; Buddy won six gold gloves as a third baseman, hit for average and power, but never received much attention (or Hall of Fame consideration) because he played for some bad teams and was a contemporary of the best third baseman in history. David was a true journeyman, playing for 7 teams in 12 seasons, but put together some very good years as a utility infielder. Grandpa Gus was lucky enough to play for the Redlegs when they actually changed their name to “Redlegs.”
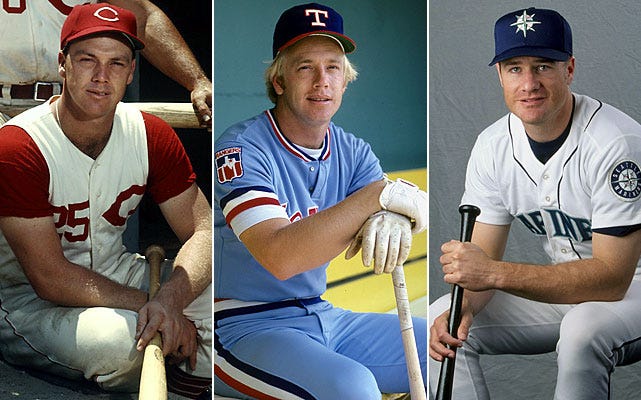
Youngest brother Mike appeared in a few games in 2000, but didn’t qualify for this list. (Photo credit: Blavity)
The Alomars, led by Hall of Famer Roberto, would make for an elite defensive squad in any era: Sandy Jr. behind the plate with Sandy Sr. and Roberto as the double play combination at short and second.
While Sandy Jr. certainly looked the part of a power hitter (he’s listed at both6’3 and 6’5 but was remarkably athletic for his size) he never hit more than 21 HR in a season. I was surprised to learn, that other than his breakout .324/.354/.545 season during which he mashed those 21 homers, he was mostly an average offensive catcher for his career. Sandy Sr. had a very long, successful career in the MLB as a speed-and-defense middle infielder, though he was never feared at the plate. Roberto, meanwhile, was one of the most valuable players of the era; he played a premium position at second base (and did so quite well — hence the ten gold gloves) while also hitting for average, power, and being a force on the bases. For a stretch of ten seasons from 1992–2001, Roberto hit .300 nine times, posted a double-digit walk rate six times, and in each of those six seasons he walked more than he struck out. He also won nine gold gloves, and stole more than 300 bases in that time frame. The Alomar versus Bell comparison is tough, if only because Roberto was so damn good.
Buddy Bell, 3B: .329/.379/.498 (6.0 WAR) 17 HR/83 RBI, Gold Glove
David Bell, 2B/3B: .261/.333/.429 (3.1 WAR) 20 HR/73 RBI, 12.7% K%
Gus Bell, OF: .299/.349/.465 (1.8 WAR) 17 HR/101 RBI/5 SB, 8.5% K%
R. Alomar, 2B: .310/.405/.427 (6.1 WAR) 8 HR/76 RBI/49 SB, Gold Glove
S. Alomar, 2B/SS: .239/.277/.305 (1.0 WAR) 2 HR/39 RBI/28 SB
S. Alomar Jr., C: .288/.347/.490 (2.0 WAR) 14 HR/43 RBI/8 SB, 9.7% K%
As hard as it is for me to do — given my preference for guys who play up the middle (and totally healthy baseball man crush on Roberto Alomar) — the Buddy-David-Gus combination is just too solid for me. I think Buddy is very underrated, and although not on the level of greatness Roberto, I’d take David and Gus over Sandy Jr. and Sr. You could just as easily make the case for the Alomars, as I did for the Boones, that despite lower WAR you might prefer the premium positions.
Would you pick the Bells or the Alomars?
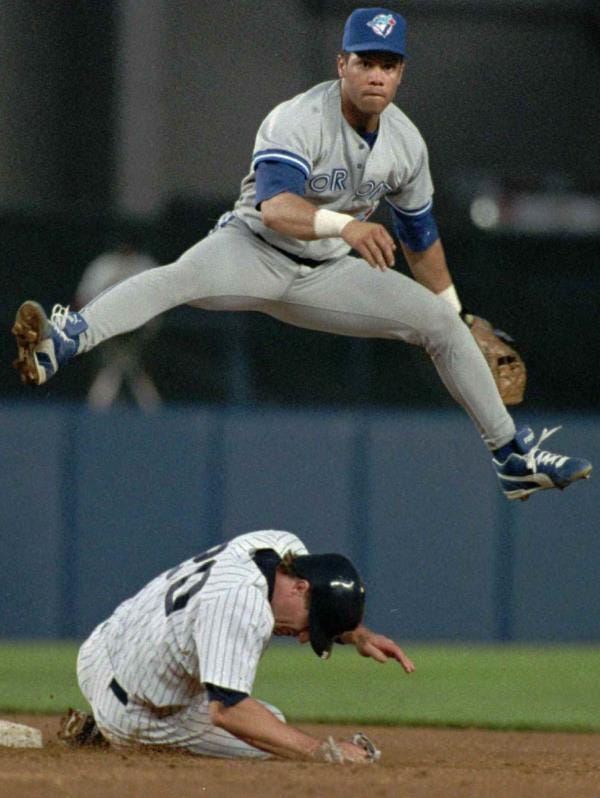
If you don’t have a baseball crush on Roberto Alomar, I didn’t do him justice. (Photo credit: El Nuevo Dia)
Martinezes and the importance of pitching
Yes, it’s true, that is how you make “Martinez” plural. Now that that’s out of the way, let’s talk about the family that I think will be the toughest to categorize.
So far, we’ve only had families of position players on our list. While theStottlemyres represent an impressive pitching duo, it’s hard to compete with Pedro and Ramon. While Pedro’s highest WAR seasons don’t match up to those of Bonds, he has a real case for the best pitcher of all-time, coming from an era that was totally unfair to pitchers. To complicate matters, we are faced with the fact that pitching wins championships. And now we are faced with some limitations of the WAR statistic. Just for fun, which season do you think was better? (follow link to vote):
Griffey Jr CF: .309/.408/.617 (8.4 WAR), 45 HR/109 RBI/17 SB, Gold Glove
Pedro Martinez, P: 17–8, 241.1 IP 1.90 ERA/2.39 FIP (8.5 WAR) 32.2% K%
Considering that these seasons are even from the same era, we aren’t even tasked with grading on a curve. WAR would give a slight edge to Pedro in this category — though basically a tossup. Here’s the Martinez family compared to the Griffeys:
Pedro Martinez, P: 17–8, 241.1 IP, 1.90 ERA/2.39 FIP (8.5 WAR) 32.2% K%
Ramon Martinez, P: 17–7, 206.1 IP, 3.66 ERA/4.21 FIP (2.2 WAR)
Ken Griffey, LF: .294/.364/.454 (3.5 WAR), 13 HR/85 RBI/23 SB
Griffey Jr CF: .309/.408/.617 (8.4 WAR), 45 HR/109 RBI/17 SB, Gold Glove
From this, the Griffey family seems far superior to the Martinezes. Why, then, do I really want to pick Martinez family? I think that depends on how you think about the question “who is best?” If you view the question as an observer, and are merely comparing groups of stats, the Griffeys are the clear choice. But if you are like me, and for some reason imagine yourself picking these families to participate on your “team” then you might find yourself taking the dominant, ace pitcher over a Hall-of-Famer and All-Star combo.
Go here to vote between the Martinezes and Griffeys.

If there was a 0.000001% chance it would work, I’d build the shit out of some fields (Field of Dreams).
Greg and Mike Maddux
Speaking of dominant aces, the Maddux family creates an almost impossible choice between pitching families. While Mike had a successful career, mostly as a reliever for ten different teams across fifteen seasons, it was younger brother Greg that puts this duo in the same category as Pedro and Ramon.
For an era dominated by batters that were bigger, faster, and stronger than ever before, it’s suiting that one of the purest finesse pitchers in history shut them down so consistently. Like Pedro, Greg did not have what most would consider ideal size for a pitcher; unlike Pedro, Greg never posted gaudy strikeout numbers, and relied on pinpoint command and pitch movement.
This tailing fastball, combined with pinpoint command, helped make Maddux absolutely dominant.
The young, lanky version of Maddux topped out in the mid-90s according to scouting reports at the time. However, many of those same scouts doubted his ability to make it as a starter in the Majors. He struggled mightily in his first season with the Cubs, and again the following season even with extended innings: his ERA was north of 5.5 both seasons. Even still, scouts were turning the corner on their evaluations, noting his solid “stuff” and athleticism — in those rough two seasons he was only 20 and 21 years old. He broke out in a big way the following season, evolving into the “Mad Dog” we know today, largely thanks to his improvements in command and less reliance on a hard fastball.
After five more great seasons with the Cubs, Greg left via Free Agency for the Braves. The already great Maddux somehow got even better with the Braves. Across a span of ten seasons, Maddux posted — get this — more than 72 WAR. While Pedro was more dominant at his peak, Maddux was elite for a much longer span, posting a WAR over 5 for a full twelve seasons. For comparison, we have to lower the bar to 3 WAR to find twelve seasons for Pedro. At 3 WAR, Greg had nine-freaking-teen seasons (as in, 19) where he cleared that. And I guess the eighteen gold gloves that Greg won are worth mentioning, too.
This is what makes the Pedro vs. Greg debate tough: is a long span of elite performance more impressive than a shorter span of flat dominance? If you think the two are close, does the fact that Ramon was more valuable than Mike make a difference in the best pitching family debate?
Pedro Martinez, P: 17–8, 241.1 IP, 1.90 ERA/2.39 FIP (8.5 WAR) 32.2% K%
Ramon Martinez, P: 17–7, 206.1 IP, 3.66 ERA/4.21 FIP (2.2 WAR)
Greg Maddux, P: 15–11, 245 IP, 2.72 ERA/2.73 FIP (7.8 WAR), Gold Glove
Mike Maddux, P: 7–2, 5 SV, 98.2 IP, 2.46 ERA/3.08 FIP (1.4 WAR)
Go here to vote between these two pitching families.
Ripkens
While Ryan Ripken is still an active minor league player, which would technically make the Ripkens a part of my part two discussion of families with active prospects (will be linked once article is complete) I decided to include them here because Ryan doesn’t seem to have much promise as a 24 year old struggling in A ball. Barring some very late blooming, it’s just Cal and Billy representing the Ripkens. I have to admit, while I enjoy all of the research I’ve done to put this article together, the most enlightening research has been on that of Cal.
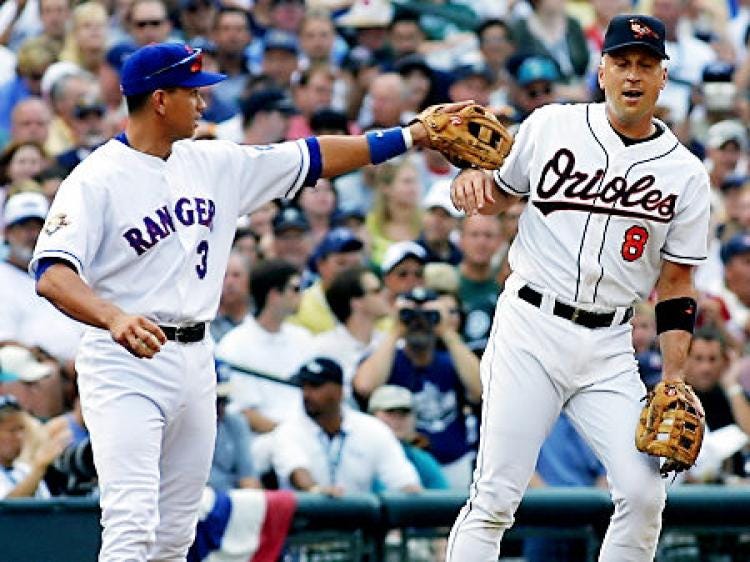
As a relatively young baseball fan, this is about the beginning of my experience watching Cal play. (Photo credit: NY Daily News)
While his durability and the number 2632 are probably the first things that come to mind when you think of Cal Ripken Jr., this amazing consecutive games played record (which I believe will never be broken) may actually be a disservice to him, in that it overshadows just how great of a player he was. He is credited with being the progenitor of offensively-capable, taller shortstops, but he is still in my opinion the greatest shortstop not named Rodriguez to ever play. He hit for average, power, took walks, didn’t strike out much, and was highly regarded defensively (2 Gold Gloves, and probably would have had more if not for Vizquel). In terms of longevity, Cal posted fifteen straight seasons of 3.5+ WAR. In terms of an elite prime, he had a stretch of nine years in which his WAR was 5+ in eight of them.
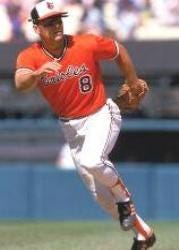
As far as greatness goes, this is a rare time when “Hall of Famer” doesn’t do a player justice. (Photo credit)
When you tell your children of Cal Ripken, lead with the numbers that show his greatness…then tell them he didn’t miss a game for more than sixteen full seasons.
Cal Ripken, SS: .317/.371/.517 (8.5 WAR) 27 HR/102 RBI, MVP
Billy Ripken, 2B: .239/.284/.305 (0.9 WAR) 2 HR/26 RBI/1 SB
Billy was a rightful big leaguer — which isn’t always the case when it comes to family members with famous last names — but mostly a light hitter who made himself valuable by being a very good defender.
Since Cal Ripken and Greg Maddux both had long, glorious careers with a period of dominance, let’s compare their families. Who would you take?
Gwynns, Uptons, Fielders, and Cruzes
As for the honorable mentions, there are some impressive duos, and I’m sure I inevitably missed some.
Tony Gwynn, RF: .329/.381/.467 (6.2 WAR) 14 HR/59 RBI/37 SB
Tony Gwynn Jr., CF: .256/.308/.353 (1.6 WAR) 2 HR/22 RBI/22 SB
Gwynn Sr. might have been the purest hitter ever. His career average was an astonishing .338, and he walked (7.7%) far more than he struck out (4.2%). His final season in the league, at age 41, he went .324/.384/.461 and still walked more than he struck out. There’s no doubt that he could have contributed for longer, had he chosen to do so. Gwynn Jr. had a few solid seasons of his own, with great speed and plate discipline, but never hit for much average or power.
Justin Upton, OF: .300/.366/.532 (4.9 WAR) 26 HR/86 RBI/20 SB
Melvin Upton, OF: .237/.322/.424 (3.8 WAR) 18 HR/62 RBI/42 SB
The book on Justin hasn’t really changed since he was drafted #1 overall in 2005: great hitter, good speed. His brother Melvin (formerly B.J.) was drafted #2 overall as a shortstop in 2002. While Justin Upton still has plenty of years ahead of him at just 30 years old, older brother Melvin looks to be nearing the end of an intriguing career. After holding his own offensively as a 20 year old, but with some difficulties defensively at SS, Melvin was moved to CF where he thrived. At age 23, he broke out with a .300/.386/.508 slash line — with 24 HR and 22 SB. He followed that up with a less impressive .273/.383/.401 season, but added 44 SB. The power, speed, plate discipline, and defensive abilities were all there; though he never quite became a superstar he did have a productive career. It’s worth mentioning Dmitri and Delmon Young, who did not reach the minimum third-WAR threshold, but were drafted #4 and #1 overall respectively, and were the first brothers to be taken in the top 5.
Prince Fielder, 1B: .299/.415/.566 (4.7 WAR) 38 HR/120 RBI, 15.5% BB%
Cecil Fielder, 1B: .244/.325/.458 (2.5 WAR) 35 HR/124 RBI, 10.8% BB%
It’s safe to say that Prince made his dad proud with his career, even if it ended a few years too soon due to injury. While the notoriously chubby Prince stole more bases (18) than his hulking father (2) these guys were paid to mash. Prince was the better overall hitter, but his dad still holds the family home run record with 51 (Prince topped out at 50). By some wild coincidence, both father and son finished their careers with the same number of home runs — 319. While Prince only ever played first base, Cecil was wedged into the lineup at third and even second base, giving us this great box score:
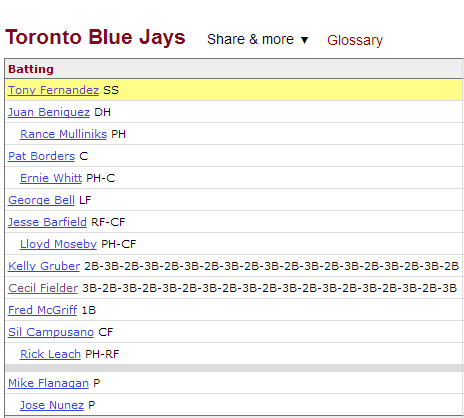
Dammit I love baseball: Cecil Fielder and Kelly Gruber swapping positions 18 times, even mid at-bat. (Source)
Jose Cruz, OF: .315/.376/.460 (4.8 WAR) 10 HR/83 RBI/37 SB
Jose Cruz Jr., OF: .241/.358/.433 (2.5 WAR) 14 HR/45 RBI/14 SB, 15.5% BB%
In this case, junior didn’t quite live up to the legacy of his dad — but it was a high bar to reach. Cruz Sr. had seven seasons of 4+ WAR, and twelve consecutive seasons of 2+ WAR. Cruz Jr. had a 30/30 year and a few other productive seasons, but it was a tough era to stand out as a bat-first outfielder. Which leads us to…
The forgotten family of baseball
In putting together this list, I almost neglected to include the Gileses, and that’s a major oversight. It’s a mistake I don’t want saavy baseball fans who value knowledge about random baseball history to make. Most of the other articles I found on the topic don’t even mention the Giles family at all — it seems the “underrated” moniker has stuck with them long into retirement. Check out these third-war seasons:
Brian Giles, OF: .315/.432/.594 (6.3 WAR) 35 HR/123 RBI 16.6% BB%
Marcus Giles, 2B: .311/.378/.433 (3.0 WAR) 8 HR/48 RBI/17 SB
Unlike Marcus who had a few great seasons and was gone, perhaps a beneficiary of the “third-WAR” metric, Brian was a truly elite outfielder for about a decade.
Brian’s career began in the unenviable position of being an unheralded prospect — drafted in the 17th round — stuck in the minor leagues behind an outfield consisting of Ramirez, Lofton, Belle. On top of that, the acquisition of veterans (and future Hall of Famers) Dave Winfield and Eddie Murray to fill the Indians’ DH vacancy effectively blocked Giles from any chance at-bats. Once Murray was traded in mid-1996, Giles played in 51 games, posting an impressive .355/.434/.612. He showed enough to earn a full-time outfield job when Belle left in free agency the following year. Despite posting a great .269/.396/.460 line, the Indians traded him to the Pirates for usable reliever Ricardo Rincon, straight up.
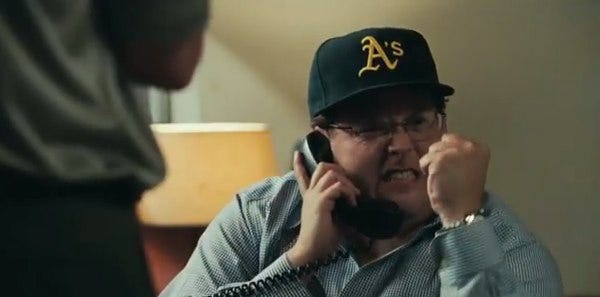
A few years later, the A’s would trade someone named Marshall McDougall to the Indians for Rincon. The Indians did not do well in Rincon trades. (Photo: Moneyball)
The Indians’ loss was the Pirates’ gain. Giles went on to post five straight seasons with an on-base percentage of .400+ including a historic .298/.450/.622 in 2002.
The extent to which Brian was unappreciated despite such elite production is best elucidated by the fact that he only made two All-Star games in his entire career, despite eight consecutive seasons of 4+ WAR, and a shiny career line of .291/.400/.502.
Brian posted double-digit walk rates every year he played, and the only year he struck out more than he walked (his 14th season) was the year he called it quits. For perspective, only five players had more walks than strikeouts in 2017: Votto, Turner, Trout, Rendon, and Rizzo — an impressive list, for sure; none of those players accomplished that feat the previous year. Among his contemporaries, the only other players to post double-digit walk rates with fewer strikeouts than walks with a .500+ slugging percentage in consecutive seasons were: Bonds, Sheffield, Pujols, Chipper, Giambi, Helton, Palmeiro, Thomas. I thought about excluding first basemen from the list, but this helps make the point of just how great Brian was, and for a long period of time.
As mentioned above, younger brother Marcus did not enjoy the long career Brian did, but was extremely valuable in his own right. While Brian was unheralded as a youngster, Marcus was mostly disregarded; Marcus was drafted way down in the 53rd round in 1996. He cracked the big leagues for the first time in 2001 at age 22, and put up a terrific .262/.338/.430 in about half a season of work, and he posted similar numbers in 2002. Even if that were the whole story, that’s still a remarkable achievement for a 53rd round draft pick — but of course, there’s more. For his stretch from 2003–2005,Marcus was by far the best second baseman in the game. In fact, among all middle infielders, only the nearly immortal Alex Rodriguez rated higher than the diminutive Giles during that span (that includes guys like Tejada, Jeter,Rollins, and teammate Furcal).

From 2003–2005, Marcus Giles was basically a better defensive version of Derek Jeter (Source: Fangraphs)
This is not to say that Marcus had a better career than any of the aforementioned stars, as this dramatically understates the significance of longevity (these were actually Marcus’ only three noteworthy seasons). But as far as 53rd round picks go, a run of three elite years like this is pretty wild. This puts the Giles family rightfully in discussion of top 5 baseball families.
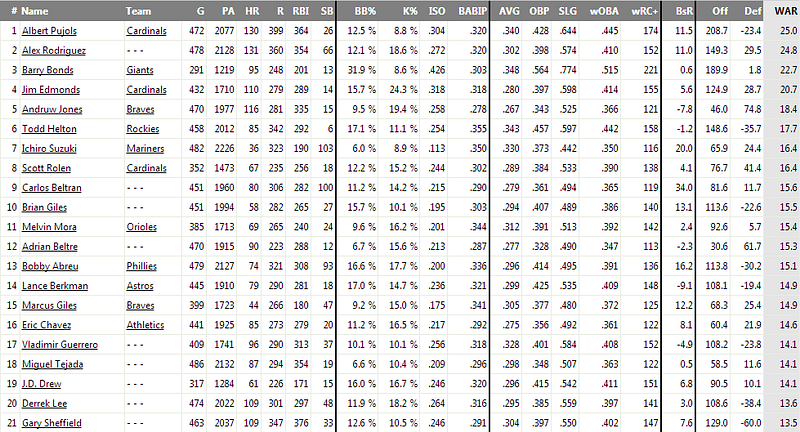
Across three full seasons, the Giles brothers were among the top players in all of baseball (Source: Fangraphs)
Of these five-honorable mention families (Gwynns, Uptons, Fielders, Cruzes, Gileses) who would you take? Vote here.
The ultimate question:
Who do you think is the best non-Bonds baseball family? Go here to take the poll.