Archive for Indians

Finding the Indians a Hand for the Pen

It’s no secret that the American League has been incredibly top heavy this year, with the playoff race having essentially been decided by the All-Star break (insert crying emoji for Angels’ fans). The Astros, Yankees, and Red Sox have been incredible, ranking first, second, and third respectively in total team WAR. The Mariners have been a pleasant surprise, parlaying a breakout season from Mitch Haniger and dominant pitching from Edwin Diaz and James Paxton with a ludicrous record in one run games (that almost certainly won’t be sustained over the course of a full season). Lurking just outside of the playoff picture are the exciting, young Oakland A’s, who have an interesting mix of young blossoming stars and seasoned vets, all who seem to be clicking at the right time.

Forgotten in all of the competitiveness that defines the AL West and AL East is the mediocrity of the AL Central. Much has been written about how historically bad the division is this year, which houses three rebuilding teams—the Tigers, White Sox, and Royals—and a vastly underperforming/fringy pre-season playoff contender in the Twins. As it currently stands, those four teams all project to finish below .500, with the White Sox and Royals both on pace to lose over 100 games. There is one bright spot, though; this team won 102 games in 2017, lost in extra innings of game 7 of the World Series in 2016, and is home to a two-time Cy Young award winner and the best SS/3B combo in the MLB. That team is the Cleveland Indians.

(Note: All statistics are current as of 07/02/18)

The Tribe have flown under the radar this year in terms of AL World Series contenders, partly because the Astros/Yankee/Red Sox have been so great, and partly because the Indians… well, haven’t been. Early on in the season, the lineup struggled mightily to score runs, couldn’t get reliable starts out of their 5th rotation spot (re: Josh Tomlin), and had a revolving door in the bullpen. As many expected, the offense snapped out of its funk, and now rank 6th in the MLB in total team batter WAR with 14.8, thanks to monster first halves from Francisco Lindor (.936 OPS, 153 wRC+, 21 HRs), and Jose Ramirez (1.007 OPS, 169 wRC+, 24 HRs). The rotation is now as formidable as ever, ranking 2nd in total SP WAR with 11.0, and replacing Tomlin with a combination of a serviceable Adam Plutko and top prospect Shane Bieber. Not to mention, Trevor Bauer and Mike Clevinger have taken massive steps forward, Corey Kluber has maintained his ace status, and 2017 4th place Cy Young finisher Carlos Carrasco hasn’t even found his stride yet. The team is positioned as well as anyone to make a deep postseason run… if their bullpen wasn’t still an atrocity. Take a look at this chart from Sunday’s game against Oakland.

View post on imgur.com

Going down the list, everything looks pretty good until… WOW. A bullpen ERA over 5, up almost 2.5 runs from a season ago. The bullpen might not be quite as bad as they appear on the surface, as they are running an abnormally low LOB%, as well as an unsually high HR/FB rate—which explains why their xFIP is 4.11 compared to their 5.17 ERA/4.64 FIP. The Tribe’s relief corp ranks nearly dead last in total team RP WAR, and their futility—combined with the excellence of the starting pitching—has led Terry Francona to only use his pen for 222.2 innings this year, good for dead last in the MLB. From 2016-2017, the Indians had the 4th best bullpen in baseball by WAR, including the best bullpen ERA and FIP, and the second best xFIP. What happened to this once formidable group? For one, the team lost bullpen stalwart Bryan Shaw via free agency, as well as mid-season acquisiton, Joe Smith. From 2013-2017, no relief pitcher threw more innings than Shaw, who carried a solid 3.11 ERA over those 5 seasons. In addition, superstar Andrew Miller has thrown just 14.1 innings, having been on the shelf for 52 days this season across two separate DL stints. Because of this, Francona has had to rely on closer Cody Allen much more than he would like to, with the results being slighly underwhelming. Allen’s ERA has jumped from 2.94 in 2017, to 3.62 in 2018, all while running an abnormally low BABIP of .233. This seems to suggest that there’s more regression on the way, which doesn’t bode well for a guy who’s K% has fallen almost three percent, and who’s out of zone swing rate has decreased while his out of zone contact rate (and overall contact rate) have increased.

Take a look at the motley crew the Tribe has run out this year (no bullpen carts yet in Cleveland, unfortunately).

View post on imgur.com

When two of the top three guys in innings pitched have combined for -0.5 WAR, you know things aren’t good. Oliver Perez and Neil Ramirez have actually been pretty solid over the last month or so, but those aren’t the guys you want coming in to face Aaron Judge, JD Martinez, or Carlos Correa in October. With both Cody Allen and Andrew Miller likely to be in different uniforms next season, it would greatly benefit the Tribe to capitalize on the team they have now by fortifying their biggest weak spot with pitchers controllable past this season alone. MLB Trade Rumors confirmed this idea, writing, “The Indians hope to acquire at least one quality reliever who’s under control past this season, per [Buster] Olney.”

So, who fits that mold? Obviously, we can rule out a few teams right off the bat:

  • Astros, Red Sox, Yankees, Mariners, Nationals, Braves, Phillies, Cubs, Cardinals, Brewers, Dodgers, Giants, Diamondbacks, Rockies, A’s, Twins, Tigers, Royals, White Sox

All of those teams in that list are firmly entrenched in playoff races, or have invested enough in their team that it would be tough to justify tearing it down right now. The A’s are interesting, given their penchant for selling off productive players at peak value. I think their recent success and competitive timeline will lead them to hold onto their stud closer Blake Trienen, though. I also added the other AL Central teams in there, given that it is unlikely they would like to trade within the division (which for the record, is stupid).

That leaves the following teams as potential trade partners:

  • Rays, Blue Jays, Rangers, Angels, Orioles, Padres, Pirates, Reds, Marlins, Mets

I find it highly unlikely that the Rays move another controllable bullpen piece, given their recent success with the “opener” and the fact that they already traded their former All-Star closer, Alex Colome. The Angels came into the year expecting to compete for a playoff spot, but injuries have derailed them this year. They will be looking to bounce back next year, and probably will only sell off short-term assets. The Mets don’t have anyone worth trading for, while teams like the Pirates and Blue Jays with ace closers (Vazquez and Osuna, respectively) probably will cost too much in prospect currency. The Orioles have relief pitchers with solid track records, but Britton/Brach are both free agents at the end of the year, and Darren O’Day is out for the year after hamstring surgery. Mychal Givens—who is a good reliever in his own right—is controlled through 2021, but probably isn’t the type of arm you can count on as the main guy in a bullpen.

That leaves four teams to choose from: Rangers, Marlins, Reds, and Padres. While each of the first three organizations possess quality, controllable arms, I think the Indians should be aggressive in obtaining Padres’ relievers Brad Hand (LHP) and Kirby Yates (RHP).

While Hand has been an above average reliever for a few years now, Yates really has broken onto the scene this year. Check out some numbers and rankings and see for yourself:

View post on imgur.com

Both rank in the upper echelon in K%-BB%, which shows an ability to miss bats while still maintaining command of the zone. Hand’s ERA and FIP look better, mostly because he had more success in previous years than Yates—although this season Yates is actually vastly outperforming Hand in this area. For those that don’t know what SwStr% means, it is calculated by dividing swings and misses by total pitches thrown by the pitcher, with league average being around 9.5%. Both Hand and Yates are well above average in this category, with Yates’ numbers bordering on elite. These two excellent relievers would fit in nicely in 2018 with a healthy Andrew Miller and a less overworked Cody Allen, and also would provide a sturdy base for the 2019 relief corps that are almost certainly going to lose the two aforementioned Indians.

Check out these two surplus value graphs that I calculated for both Padres relievers:

View post on imgur.com

View post on imgur.com

Let me briefly explain my methodology. When calculating surplus value on a contract, the goal is to figure out how much “extra” value the player is giving to his team by subtracting the market value for his production by the dollars he is actually owed via his contract. The $/WAR calculation for 2018-2020 were taken directly from an article written here on Fangraphs by Matt Swartz, and the expected WAR totals were generated by the generally accepted decline rates laid out by former Fangraphs’ editor and chief, Dave Cameron. Players on average perform at 90% of their previous year’s WAR output through age 30, 85% from 31-35, and 80% from 36 and up. For 2018 dollars owed, I divided each players’ contract by 3 to account for the fact that each would only be in Cleveland for about a third of the current season. Similarly, the 2018 final WAR calculation shown at the bottom of my charts uses 2016 and 2017 WAR totals added to each player’s current WAR, plus an average of what Zips and Steamer—which are Fangraph’s projection systems—think they will produce the rest of the season. Finally, that total is then divided by three to get the average of the three seasons, and then divided by three again, to account for the third of the season Hand and Yates would pitch for the Tribe. Using the previous two seasons WAR in addition to the current season will enable us to have a number that is less influenced by one particular season’s performance, thus giving us a sturdier baseline for which to calculate the next season’s WAR totals.

These charts aren’t perfect, and are meant to be used as simply a rough estimate to see how valuable each player would be over the course of their contracts. For example, Yates will head to arbitration in 2019 and 2020. It is tough to say how much of a raise he will get each season, so I kept the raises equal, and simply doubled his previous year’s salary. Arbitration pays for saves, as well as other counting statistics like strikeouts and holds. Since Yates probably will never do much closing, and really hasn’t become dominant until this season, I feel comfortable saying his salary won’t escalate too much the next few years—which is great for a small market team like the Indians.

Clearly, if we can ascertain how valuable Hand and Yates are, the Padres certainly know their value as well. What would it take to get both of these guys? Would it take a massive overpay? Is there a point where it becomes too expensive? The answer, in short, is “it depends.” The Padres have an absolutely loaded farm system, so they might have more specific desires when it comes to prospect returns. Of course, prized Tribe prospect Francisco Mejia’s name will most definitely be talked about first. I’ve seen him ranked anywhere from a 55FV to a 60FV on the 20-80 scouting scale, meaning some see him as an above average MLB contributor, while others see him as a potential All-Star. Using Kevin Creagh and Steve DiMiceli’s prospect valuation model, which according to Dave Cameron “looks at the level of expected performance and the expected cost of a player during the years before he reaches free agency, and then estimates a player’s value to his organization during that time,” here is how top prospects can be valued:

View post on imgur.com

As you can see, pitchers are valued less due to the fact that pitcher’s get injured much more than hitters, and thus are riskier over the course of their control years. Depending on how you value Mejia, there’s a 22-million-dollar difference in his estimated prospect value. To elaborate, if Hand/Yates combined are around 40 million dollars in surplus value by my model, Mejia’s value outweighs theirs by 20 million if he is a 60FV, while it actually is about 2 million less if he ends up a 55FV. Is there a lot more that goes into trades than simply surplus value? Absolutely. Teams all have their own ways of valuing MLB/MiLB players, and the value of a championship sometimes is the necessary boost to make a move that might be otherwise unadvisable (see: 2015 Kansas City Royals).

Based on what I’ve seen/read, it’s tough for me to value Mejia at a 60FV, mostly due to the uncertainty surrounding his long-term projectability behind the dish. Everyone knows he has an absolute hose, but it appears as if his footwork, blocking, and game-calling need work. Not to mention, he doesn’t have a traditional “sturdy” catcher’s frame, and there is legitimate concern that his body will not hold up after catching 110+ games a season. If he isn’t able to develop into an average to slightly above average catcher, it’s not as if his advanced barrel control from both sides combined with some sneaky raw power won’t play at a corner outfield spot or 3B. That profile will just will make him less valuable, because it is extremely difficult to find a catcher that can hit as well as Mejia is projected to.

Let’s construct two trade scenarios based on Mejia being a 55FV prospect. Because of the scarcity of dominant relievers on the trade market with team friendly contracts, and the fact that the demand for Hand/Yates will be high among contenders, the Tribe will probably have to overpay for their services.

Here’s two mock trades I think could work:

View post on imgur.com

View post on imgur.com

We’ve already talked in length about Mejia, but here’s some quick information on the other guys I included in this deal (note: all FV ratings are via Fangraphs). Talking about deal number one first, Willi Castro (45FV) is a slick fielding SS with solid contact ability, and would fill in nicely at SS if top Padres’ prospect, Fernando Tatis Jr., moves off of short like many are expecting. Quentin Holmes (40FV) is a plus runner with immense athleticism that will help him play plus defense in CF someday. The hit tool isn’t there yet, but if he develops the way the Tribe are hoping, he will be a key cog at the top of a lineup down the road. Julian Merryweather (NR) is a big, right-handed reliever that Fangraph’s prospect analysts Eric Longenhagen and Kiley McDaniel have up to 98MPH, with a plus curveball and changeup. He’s coming off Tommy John surgery, but is an interesting high-upside bullpen piece that could break camp with the team as early as 2019. In the second deal—not including aforementioned Mejia and Merryweather—there is Yu Chang (50FV), who probably has just enough athleticism/twitchiness to stick at short, but also could fill in nicely at 3B down the road. He has some swing and miss issues, but there’s legitimate raw pop in his bat, and he should be able to get to that power in game enough to be a valuable everyday regular. Jordan Milbrath (NR) is a massive 6’6” 215lb reliever that has what Longenhagen and McDaniel describe as a plus sinker and slider.

Will either of these deals be satisfactory to the Padres? Who knows. Will the Indians think that Mejia headlining a deal is too expensive? Who knows. These mock trades were meant to put out a framework of what could potentially move the needle on two relievers with justifiably high price tags, all while staying within the parameters of what a fair deal would be in terms of surplus value.

With the recent departure of LeBron James, and the consistent futility of the Browns (save us, Baker Mayfield) the Indians are Cleveland’s best chance at fielding a championship team over the next five years. Although the price might be steep, it’s impossible to put a dollar amount on what a World Series would mean for the city of Cleveland, even if it requires trading an arm and a leg for a Hand (and a Yates).


Rafael Devers: Boston’s Rising Star

The Red Sox’s third-base problem was not solved by a veteran rental. No, it was solved by a sweet-hitting 20-year-old Dominican named Rafael Devers.

But before I explain Devers’ spectacular rise, I must set the stage for his entrance.

~~July 24th~~

It’s July 24th and the Red Sox have ground to a halt. Baseball’s non-waiver trade deadline is just eight days away and nearly the entire baseball community expects the Sox to trade for Todd Frazier.

Frazier, the third baseman for the White Sox, is in the midst of the worst season of his career. He’s hitting just .210 and his contract expires at the end of the year.

The Red Sox haven’t been able to gain traction since the All-Star break, going just 5-6. The Yankees, their ever-present rivals, are creeping up on them in the standings and have swooped in on a trade for Todd Frazier, even though many executives and analysts were sure the slugger would join the Red Sox.

Third base has been a huge issue for Boston, who has used eight (!) different players there. Collectively, Red Sox third basemen are slashing .227/.280/.320, marks that rank 27th, 29th, and 30th in the league, respectively. They have not only been terrible hitters, but they also lead the league in errors.

Dave Dombrowski decides to rectify the Red Sox’ third base issue by promoting top prospect Rafael Devers to the big leagues.

~~A Rafael Devers Profile~~

Rafael Devers was born on October 24th, 1996 in Sanchez, an aging port city in the Dominican Republic. He first started playing baseball at the age of five, inspired by his father, who played amateur ball. Devers grew up with baseball all around him and quickly showed immense talent.

In 2013, Devers signed with the Red Sox at just 17 years old. He was ranked as the number three international prospect in his class, and he signed with the Red Sox, his childhood favorite team, for $1.5 million. Devers entered the Red Sox organization as their 20th ranked prospect in a deep farm system.

Upon joining the Red Sox, Devers was placed in the Dominican Summer League (DSL), a place where new international signings go to work on their skills. Devers took the DSL by storm, batting .337/.445/.538 with three home runs in 28 games. He impressed everyone, by his ability to hit for both average and power, and also by his great batting eye — Devers walked more times than he struck out.

After tearing up the Dominican League, Devers was sent to the States, where he played in the Gulf Coast League. The Gulf Coast League, or GCL, is where first-year minor-league players are sent after being drafted or signed by their teams. Most of the players in the GCL have been drafted out of college or have just finished high school, meaning that at age 17, Devers was one of the youngest players in the league. Devers carved up the GCL, batting .312 with 11 doubles and four homers in 42 games.

After Devers’ wildly successful first year, he was rated as the Red Sox’ sixth-best prospect, and baseball’s 99th-best, all at just 18 years old. This was an incredible accomplishment, as Devers was the youngest player on Baseball America’s top-100 list that year.

In 2015, Devers was promoted to the Red Sox’ Low-A affiliate, the Greenville Drive, where he experienced full-season ball for the first time. There, he was matched up against much older opponents, being one of just seven position players under the age of 19 in the South Atlantic League. Devers played well in Greenville too, batting .288 with 38 doubles and 11 home runs in 115 games. During the 2015 season, Devers was selected to the Futures Game, an event during All-Star weekend that showcases baseball’s best young talent. After a season in Low-A, Devers was ranked as Boston’s second-best prospect, and baseball’s 18th-best. Devers jumped 81 spots on Baseball America’s top-100 in just one year, a remarkable achievement.

In 2016, Devers was promoted to the Red Sox’ High-A affiliate, the Salem Red Sox, at the age of 19. However, Devers hit a bump in the road in Salem. Among players much older than him, it appeared that Devers had finally met his match. In the first half of the season, he scuffled to a .233/.300/.305 line with just four home runs in 63 games.

However, Devers bounced back brilliantly after the All-Star break. He slashed an incredible .326/.367/.539, with seven home runs and 11 steals in 64 games. After this second-half breakout, Devers has not looked back in his meteoric rise to the majors.

In 2016, Devers’ defense finally started to catch up with his offense. Early on in his career, scouts considered moving him to first base, because of his heavy build. But Devers has worked hard on his defense, and has stayed at the hot corner. In High-A, Devers led all Carolina league third basemen in fielding percentage (.960), putouts (104), and assists (258).

After his outstanding second half in High-A, Devers earned a non-roster invitation to 2017 spring training with the Red Sox. This was a big step up for the 20-year-old Devers, but he wasn’t ready for it, batting 3 for 22 against big-league competition. Nevertheless, he earned a promotion to Double-A Portland, where he played for most of this year.

Devers was the Portland Red Sox’ standout player this year, socking 18 homers in addition to achieving an excellent .296/.366/.571 slash line. In 77 games, Devers jumped to number six in Baseball America’s most recent prospect rankings. He was also selected to participate in the MLB Futures Game for the second time.

Devers was promoted to Triple-A on July 14th, and continued to hit for both average and power while in Pawtucket. Devers became the third-youngest player ever to be promoted by the Red Sox to Triple-A, yet another reminder that he was playing extremely well for his age. The Dominican lefty hit an astounding .400 for the Pawtucket Red Sox, and he earned a promotion to the big leagues after just nine games in Triple-A.

When Devers debuted on July 25th, he was the youngest player in the major leagues, but you’d never know it. His first major-league hit was a home run (!), and during his 16 career major-league games, Devers has surprised everyone.

Scouting report

Devers has a very promising future, thanks to his ability to hit for both average and power. He has incredible raw power, and can spray the ball to all fields. His opposite-field power is unsurpassed among players his age. For example, when Devers hit two homers against the Indians on August 14th; one was a laser into the Green Monster seats in left field, and the other was a high drive into the Red Sox bullpen in right field.

Devers also has great bat speed, and he is able to hit pitches very far, and to any part of the field. On August 13th, Devers hit a 102.8 mph pitch into the Yankees bullpen, the fastest pitch ever hit for a home run in the pitch-tracking era.

Devers is not as polished as other recent Red Sox prospects like Andrew Benintendi, but he has a higher ceiling. I project that in his prime years he will hit around .285 with 30 home runs, 40 doubles, and five to ten stolen bases.

He has improved his defensive skills, but don’t expect him to be a Gold Glove-winning third baseman. I believe he will stay at the hot corner, as he is becoming more reliable and is improving his range. Overall, Devers projects to be an All-Star with a dependable glove and a reliable, middle-of-the-order bat.

Conclusion

As of August 15th, Devers is hitting .339 with six home runs, incredible statistics that show his ability is way beyond his years. I don’t mean to read too closely into Devers’ 62 career at-bats, but he has a very promising future.

Pairing Devers with other young Red Sox stars like Mookie Betts, Jackie Bradley jr. and Xander Bogaerts should help Boston stay at the top of the AL East for years. Devers gives Boston an entirely homegrown lineup, the dream of every major-league team.


Special thanks to Baseball Reference, Baseball America, and milb.com for the statistics I used in this post.

I would also like to thank NESN.com, the New Haven Register, and SB Nation’s Minor League Ball blog.

Prospect rankings are from Baseball America

Fenway Park Photo Credit: User: (WT-shared) Jtesla16 at wts wikivoyage [CC BY-SA 1.0 (http://creativecommons.org/licenses/by-sa/1.0)], via Wikimedia Commons


The Improvement of the Indians Starting Rotation

Remember at the end of last season and before this season when we all foresaw an Indians rotation that could possibly feature somewhere between 2 and 5 really good, and possibly great, starting pitchers?  Don’t get bogged down on the slight exaggeration of that 1st sentence – To recap what we were looking at coming into this season for the Indians’ rotation:  Corey Kluber won the 2014 AL Cy-Young; Carlos Carrasco had a string of starts to end 2014 in which he seemingly (finally) figured out how to harness all of his powers in a bid to ascend his name to an echelon where only Clayton Kershaw’s name resides; Danny Salazar has always had elite swing and miss stuff and was also excellent in the second half of 2014;  Trevor Bauer and his Costco-sized arsenal of pitches have made some of us incredulously, if not warily optimistic since he was taken 3rd overall in 2011; and even T.J. House made us pause and take notice with his strong second half of 2014.

Then, like hype men with a special blend of Cleveland Kool-Aid being intravenously administered, Eno Sarris and Daniel Schwartz posted one of my favorite FanGraphs articles ever, Pitch Arsenal Score Part Deux, and the anticipation over the Indians’ rotation pulsated like a vein in the neck of John Rambo in the midst of fleeing from man-hunters.

The supporting cast, the lineup, looked poised to support the staff with plenty of runs.  Returning would be: break out star Michael Brantley; bounce-back candidate Jason Kipnis; now-full-time-first-basemen, Carlos Santana; a supposedly healthy Michael Bourn; an offense-first but totally-respectable-defensively, Yan Gomes; and an actually-not-that-horrible-in-2014, Lonnie Chisenhall.  Slugger Brandon Moss, and contact-happy-supposedly-glove-first Jose Ramirez had secured full-time spots as well in RF and SS respectively.  So even though it wasn’t without flaws, it seemed like they would allow the pitchers to rack up plenty of fantasy-relevant wins.

Note: This post isn’t about the disappointment of the Indians, though they have been disappointing; it’s more about what factors beyond luck have contributed to the numbers of the Indians’ starting rotation at various points throughout the year, and the disparity (big or small) between the pitchers’ rates and predictors at those points.

The Indians’ starting pitchers, or at least the top 4 (Kluber, Carrasco, Salazar, and Bauer) have, for the most part, been putting up good, albeit, inconsistent numbers all year despite posting some elite peripheral rates and ERA indicators.  A number of reasons have caused these numbers to grow apart (bad), come together, and then grow apart again (good).  Luck can work like a bit of a pendulum, swinging from one extreme, through the middle, and to the other extreme before evening out and that is at the core of what the Indians’ starting pitchers have experienced this year — although they have yet to experience the final stabilization phase.

We will examine plenty of numbers (Beginning of season to August 18th) based on this time frame: (Spoiler alert – this article is long and dense, and this timeline serves as a sort of cliff notes as to how the staff’s numbers have improved throughout the year – so if you’re the type of person who feels like looking at a bunch of data is superfluous when the bullet points are in front of your eyes, just read the timeline and be done with it.)

timeline

April 6th – May 23rd/May 24th – June 15th

One week into the season, before it was evident that the team’s defense was very sub-par, Yan Gomes hurt his knee and hit the disabled list for over a month.  Roberto Perez filled in quite nicely, and looking at just a couple numbers, could be considered the more valuable catcher (1.4 WAR compared to 0.5 WAR for Gomes).  Brett Hayes (0.0 WAR) was called up and was the secondary catcher during this period.  Behold, a table from StatCorner:

statcorner


Perez has had the least amount of pitches in the zone called balls and the most amounts of pitches out of the zone called strikes.  Overall, despite receiving fewer pitches than Gomes, he has saved more runs (4 DRS to Gomes’ 1) and their caught stealing rates are basically identical with a slight edge going to Perez – 38% to Gomes’ 35%.  Gomes was much better in terms of framing in 2014, and it’s possible the knee injury has limited his skills all around this season.  Anyways, from April 6th – May 23rd, the combined stats of Kluber, Salazar, Carrasco, and Bauer look like this:

ERA FIP xFIP SIERA K-BB% GB%
Kluber 3.49 2.16 2.46 2.51 25.3 48.6
Salazar 3.50 3.27 2.46 2.30 28.7 43.8
Carrasco 4.74 2.60 2.67 2.82 22.3 48.9
Bauer 3.13 3.23 4.09 3.94 14.2 35.7
3.75 22.7 44.7

Gomes returned as the primary catcher on 05/24, and from that point through June 15th, the cumulative numbers aren’t too different, although there is a dip in both K-BB% and GB% that we’ll have to look into.

ERA FIP xFIP SIERA K-BB% GB%
Kluber 3.67 3.26 3.20 3.19 19.8 43.8
Salazar 3.60 3.72 3.36 3.43 17.3 47.7
Carrasco 3.65 2.83 3.29 3.17 20.2 44.1
Bauer 3.96 4.72 4.47 4.30 11.5 36.8
3.74 17.2 43.1

So despite lower K-BB and ground ball percentages (leading to higher ERA predictors), the group’s ERA in the segment of the season when Gomes was reinstated is essentially exactly the same as from the first block of time with Perez.  Now, I am not a big believer in CERA because there is a high level of variation and too many unknown variables pertaining to how much of the responsibility/credit goes to the catcher, the coaching staff, or the pitcher; but I do think that it’s possible Gomes’ extra service time has enabled him to be more in tune with his staff as well as understand hitter tendencies better than Perez and Hayes.  I realize we’re getting into a gray area of intangibles, so I’ll reel it in with some results based on pitch usage%.

% Difference in Pitch Usage with Yan Gomes compared to Roberto Perez

Pitcher FB% CT% SL% CB% CH% SF%
Corey Kluber -9.0 8.8 -17.3 5.0
Danny Salazar 9.8 -12.6 -4.4 17.1
Carlos Carrasco -6.5 9.4 49.2 13.3
Trevor Bauer -2.9 -15.0 -8.9 78.5 25.8

Using BrooksBaseball Pitch f/x data, let’s painstakingly find out how different each pitcher’s pitch usage was in regards to different counts, or better known as Pitch Sequencing.  We’ll look at first pitches, batter ahead counts, even counts, pitcher ahead counts, and 2 strike count situations.  As good as pitch f/x is, the data still isn’t perfect.  There may be discrepancies if you look at usage at Brooks compared to the usage at FanGraphs, so for each pitcher we’ll split the pitches up into three categories: Fastballs (four-seam, sinkers, cutters), Breaking Balls (sliders, curve balls), and Change Ups (straight change/split finger) – I’m aware that splitters are “split fingered fastballs”, but I liken them to change ups more because of the decreased spin rate and generally lower velocity.

*Having a table for each pitcher in regards to pitch sequencing made this article quite messy, so I’ve included a downloadable Excel file, and briefly touched on each pitcher below.

Pitch Sequencing Excel Doc.

Corey Kluber

Looking at the data, Gomes stays hard with Kluber more than Perez until they get ahead in the count.  Perez swaps some early count fastballs for curve balls, but they both see his curve ball as a put-away pitch.  Gomes tends to trust Kluber’s change-up more than Perez later in counts and Perez likes it more earlier in counts.

Danny Salazar

Much like with KIuber, when Gomes catches Salazar, they have a tendency to stay hard early.  Gomes pulls out Salazar’s wipe out change up after they’re ahead whereas Perez will utilize it in hitter’s counts as well.

Carlos Carrasco

Carrasco has 5 good pitches and he’s pretty adept at throwing them for strikes in various counts which is why there is some pretty even usage across the board, at least in comparison to Kluber and Salazar.  There is quite a bit more usage of Carrasco’s secondary pitches in all counts and there are pretty similar patterns when Gomes and Perez are behind the plate.  With Hayes, it doesn’t look like there is much that changes in sequencing until there are two strikes on a hitter.

Trevor Bauer

Bauer is probably a difficult pitcher to catch because of the number of pitches he has and the constant tinkering in his game.  Side note: Gomes is the only catcher to have caught a game in which Bauer threw cutters, and in their last game together, Bauer threw absolutely no change-ups or splits.  Bauer’s highest level of success has come with Hayes behind the plate and perhaps that’s from their willingness to expand his repertoire in more counts than Gomes and Perez do, but there is no way I can be certain of that.

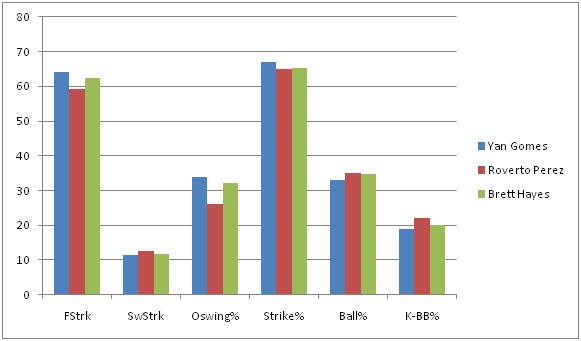
Pitch sequencing can effect the perceived quality of each pitch and therefore, can produce more favorable counts as well as induce higher O-Swing and SwStrk percentages (or less favorable and lower).  So despite the framing metrics favoring Perez, the group throws more strikes with Gomes and also induces more swings at pitches outside the zone – although, as previously noted, there is some regression with Gomes behind the dish in terms of SwStrk% and K-BB%.

swing tendencies


aaa0ide


**These graphs represent numbers through the entire season to garner a bigger sample size.

With lower line drive rates and more medium + soft contact, and (in the case of the Indian’s defense), more fly balls, a conclusion could be jumped to that the staff’s BABIP has trended downward since Gomes regained his role.  A look at BABIP throughout the course of the season:

babip


Woah!  It was well above league average in April and then plateaued at just above league average through mid June, but has been plummeting ever since.  Obviously a catcher is not responsible for this dramatic of a swing in BABIP, so the Indians’ defense must have improved.

June 16th – August 18th

The rotations’ traditional stats look even better if you use June 16th as the starting point:

Pitcher IP H K BB W ERA WHIP
Corey Kluber 84 61 82 16 5 3.11 0.92
Danny Salazar 71 46 69 23 5 2.79 0.97
Carlos Carrasco 77.1 56 77 13 3 2.91 0.89
Trevor Bauer 68.1 69 63 24 4 5.80 1.37
300.2 232 291 76 17 3.59 1.03


So let’s take a look at the Indians’ defensive alignment by month (Player listed is the player who received the most innings played at the position).


POS April May June 1 – 8 June 9 – 15 June 16 – 30 July August
C Perez Perez Gomes Gomes Gomes Gomes Gomes
1B Santana Santana Santana Santana Santana Santana Santana
2B Kipnis Kipnis Kipnis Kipnis Kipnis Kipnis Ramirez
3B Chisenhall Chisenhall Chisenhall Urshela Urshela Urshela Urshela
SS Ramirez Ramirez Aviles Aviles Lindor Lindor Lindor
LF Brantley Brantley Brantley Brantley Brantley Brantley Brantley
CF Bourn Bourn Bourn Bourn Bourn Bourn Almonte
RF Moss Moss Moss Moss Moss Moss Chisenhall

If you’ve paid attention to the Indians at all, you know they’ve made some trades and called up a couple prospects.  But just how different is the new defense?  Well, we only have a small sample with the current configuration, but it appears to be A LOT better. If BABIP wasn’t enough of an indicator, and it’s not, because there has to be some regression to the mean – it can’t stay that low – here are some numbers from the players who were playing the most in May compared to the players who are playing the most in August (again, numbers represent full-season stats):


MAY PLAYER FLD% rSB CS% DRS RngR Arm UZR UZR/150
C Perez .994 2.0 38.5 4
1B Santana .997 -6 0.0 0.7 1.2
2B Kipnis .988 4 4.5 3.6 7.0
3B Chisenhall .963 7 3.1 3.3 10.5
SS Ramirez .948 -2 -2.4 -5.2 -21.9
LF Brantley .992 1 0.3 -2.1 -1.4 -3.3
CF Bourn 1.000 4 -7.2 1.1 -5.8 -11.4
RF Moss .975 -4 1.7 -2.5 -1.1 -1.8
AUG PLAYER FLD% rSB CS% DRS RngR Arm UZR UZR/150
C Gomes .996 0.0 35.0 1
1B Santana .997 -6 0.0 0.7 1.2
2B Ramirez 1.000 1 1.1 2.8 23.2
3B Ursehla .973 2 4.5 6.0 15.7
SS Lindor .967 6 6.0 4.9 14.9
LF Brantley .992 1 0.3 -2.1 -1.4 -3.3
CF Almonte 1.000 2 0.4 -0.2 0.9 10.0
RF Chisenhall 1.000 4 1.6 0.5 2.3 27.3

What’s interesting is that the biggest difference in the infield is Francisco Lindor (Giovanny Urshela has been very solid, but Chisenhall was pretty similar this season at 3B).  I’m sure someone at FanGraphs could churn out a really cool article (if someone hasn’t already) that shows us a quantifiable difference an above average to well above average shortstop makes for a team even if you just keep the rest of the infield the same, as the control.  The 2015 Tigers come to mind – a healthy Jose Iglesias has made a difference for a team that still features Nick Castellanos at 3B and Miguel Cabrera at 1B.  Teams are willing to sacrifice offensive contributions if a SS has elite defensive skills (Pete Kozma, Andrelton Simmons, Zack Cozart to name a couple off the top of my head).  Lindor, to this point, has been an above average offensive player, too, so this could be special.

At this point the Indians are in last place and are out of contention.  Abraham Almonte is their starting center fielder and with Kipnis back from the DL, Jose Ramirez is not playing 2B, but is instead getting reps in left field while Michael Brantley DHs due to his ailing shoulder.  Perhaps all this means is that they don’t have better replacements; OR PERHAPS they’re planning to establish a more defense-oriented squad next year…

Now there’s no doubt that this research has led to some frustrating conclusions.  With Gomes behind the plate, the K rate and GB rate of the staff has trended in the wrong direction in regards to ERA indicators; so is the difference in the batted ball profile plus an improved defense enough to make up for these facts?  This small sample size thinks so, but it could 100% just be noise.  However, there are clubs that are succeeding by using similar tactics right now:

Team ERA FIP ERA-FIP GB% (rank) SOFT% (rank) OSWING% K-BB% (rank)
Royals 3.57 3.93 -0.36 42.1 (29th) 18.1 (16th) 30.9 (19th) 10.5 (26th)
Rays 3.63 3.79 -0.16 42.4 (28th) 18.7 (13th) 31.2 (17th) 14.8 (7th)
Indians (as a reference) 3.85 3.65 0.20 44.7 (17th) 18.2 (15th) 33.3 (2nd) 16.9 (1st)

Granted, the Royals and Rays have the 1st and 2nd best defenses in baseball, and their home parks play differently than the Indians, but they also don’t boast the arms the Indians do.

The Indians have their noses deep in advanced metrics and having rid themselves of Swisher, Bourn, and Moss during 2015’s trading period has allowed them to deploy a better defensive unit which has amplified their biggest strength – their starting pitching.  Furthermore, their unwillingness to move any of their top 4 starting pitchers also leads me to believe they see next year as a time for them to compete.  I’m not going to speculate what moves the Indians will make in the offseason, but I hope they stick with this defense-oriented situation they have gone with recently because it’s been working (and because I own a lot of shares of Kluber, Carrasco, and Salazar in fantasy).


The Cleveland Indians as a Fringe Playoff Contender

It’s been a disappointing year thus far for the Cleveland Indians. They are currently 42-46 heading into the All-Star Game, and are in 4th place in the competitive American League Central division. They are underperforming their BaseRuns projection by 4 wins, meaning the computers view this team as much more of a playoff threat than they actually have been thus far. Although they have the third-highest remaining projected winning percentage in the AL at .532, their rough first half has them only finishing with about 81 wins. As wide open as the wild card race is, a .500 finish would clearly not be enough. What has happened to everyone’s preseason sleeper team? Besides Sports Illustrated jinxing them of course.

Well as expected, they have had stellar starting pitching from the likes of Corey Kluber, Carlos Carrasco, Trevor Bauer, and Danny Salazar, and even have gotten good outings recently from under the radar prospect Cody Anderson. Everyone knew they had a bad defense, but many thought that the Indians’ offense could support the great starting pitching enough to propel them into the postseason. Thus far, however, that has not been the case. They are at league average or below in almost all offensive categories. They are not a power hitting team by any means, and have the 10th lowest FB% in the MLB, which makes sense seeing as to hit for power you need to get the ball in the air. However, they still run the 7th lowest BABIP in baseball, which insinuates that they have a lot of hitters who tend to roll over a lot. Lo and behold, they are 3rd in Pull %, and have a lefty heavy—heavy being an understatement—lineup.

Essentially, the Indians have amassed a lineup with a bunch of pull-happy hitters who don’t hit for much power, which doesn’t work in a league that nowadays uses the shift religiously. I think all Cleveland fans know where I’m going with this, because the phrase has been overused by Tribe fans for almost a decade now. Yes, Cleveland is lacking an impact right-handed bat. Brewer’s prized prospect Matt LaPorta was supposed to be that guy when the Indians traded C.C. Sabathia for him and others—including player to be named later Michael Brantley. However, his MLB career was as successful as Kim Kardashian’s first marriage. Ironically or not, Milwaukee has another player that I believe can push the Tribe over the hump; his name is Carlos Gomez.

The 29 year old native of the Dominican Republic, known for his fiery personality, has been extremely productive for the Brew Crew since 2011, racking up 18.4 WAR in that 4 year span. With Milwaukee sitting at the halfway point with the second worst record in all of baseball, they will most definitely be sellers at the trade deadline. I recently tweeted FanGraphs’ Jeff Sullivan asking him if Gomez would be dealt, to which he responded, “Gomez is probably moving. Lucroy not.” That doesn’t mean it is set in stone, but that shows that there is a decent chance he gets traded. Let’s just assume for arguments sake that the Indians and Brewers have mutual interest in being trade partners. Why should the Indians’ make the move?

One plus is that Gomez wouldn’t be a rental. He is under contract through 2016, and is only set to make 9 million dollars next year. If you consider 1 WAR to be worth roughly 7 million dollars, Gomez’s average of 6.6 WAR per year the last two seasons would be a huge bargain for the Tribe. With the contracts of David Murphy and Ryan Raburn likely to be coming off the books next year, an extra 9 million dollars on the payroll will be inconsequential for the notoriously conservative Dolan family. Gomez also would provide a major upgrade from primary Tribe center fielder, Michael Bourn. I have included a chart that compares their averages from the last two seasons. Why two seasons? Because that’s when Bourn signed with Cleveland, where he has not been the same player he once was.

Name Avg. WAR Avg. wRC Avg. RISP Avg. DEF Avg. ISO Avg. SLG Total PA
Bourn 1.3 53 0.298 -3.3 0.101 0.360 1,062
Gomez 6.6 93 0.298 17.2 0.208 0.492 1,234


It is easy to see who has been the more valuable player. The reason I included ISO and SLG was to demonstrate Gomez’s excellent power, not necessarily to compare it to Bourn’s (because that is not the type of hitter he is). Gomez would provide a major upgrade defensively – where the Indians struggle – and at the plate, where he is a key catalyst in manufacturing runs. Gomez has created almost 40 more runs per season than Bourn the last two years. If you take into account how every 10 runs scored or given up equates to a win or a loss, those extra 40 runs would essentially add on about 4 more wins to the Indians win total (assuming those averages hold up throughout the 2015 season). So that would take the roughly 81 win Indians and make them an 85 win team; better yes, but still not a playoff contender.

Although Bourn and Gomez have been equally as good with RISP, this season has been a different story; Bourn is hitting .216 in 68 PA and Gomez is hitting .381 in 65 PA with RISP. The Indians have the 7th worst average with RISP this season at .230, with the MLB average being .255. For a team that struggles to score runs, this would be a huge difference. Slotting Gomez in the lineup everyday behind a guy like Michael Brantley would also take a ton of pressure off of him to carry the team day in and day out.

So what does this all mean? Could Carlos Gomez really propel the Tribe into October baseball this season? Probably not. Here are their season splits against teams above and below .500.

               Wins Losses Winning Percentage
Teams ≥ .500 24 32 0.429
Teams < .500 18 14 0.563


They struggle against good teams, and beat bad ones. That is not the mark of a playoff team. In the last 74 games of the season, the average winning percentage for teams they play is .515. While I fully believe the team could make a strong second half push – I actually believe they will make the playoffs – it is not likely. Still, a trade for Carlos Gomez would not only aid them in the second half of this season, but for next season as well. Clevelanders are sick of hearing “we’re building for the future.” The Indians have an extremely strong core, one that is young and locked into team-friendly contracts. It is time to win now, because they would hate to look back years from now like a reminiscent ex-lover and say, “That was the team that got away.”