Archive for hit by pitch

First Blood, Retaliation, and Piling On

Pirates pitchers hit more batters than any team in the majors this year, 75. They also led in 2014. And 2013. That’s unusual. The only teams to have lead the majors in hit batters for three or more seasons since 1901 are the 1921-23 Phillies, 1930-32 Cardinals, 1938-40 Senators, 2002-04 Rays, and the 2013-15 Pirates.

The Pirates also got hit more than any team in the majors this year, with 89 hit batters. On one hand, that makes sense, given baseball’s Book of Exodus stance: A hit batter for a hit batter. On the other hand, and more significantly, it’s been a rare occurrence. Since 1931, only 14 teams have led their league in both pitcher and batter hit by pitches (1943 Giants, 1947 Dodgers, 1955 Dodgers, 1963 Reds, 1966 White Sox, 1968 Astros, 1980 White Sox, 1982 Angels, 1983 Expos, 1996 Astros, 2009 Phillies, 2012 White Sox, and 2013 and 2015 Pirates). Only 8% of teams in that time span have led their league in both hitting batters and getting hit. Pure random chance would put that figure above 9%. It just doesn’t happen very frequently.

I should interject that I fall in the anti-hit batters camp. I don’t like seeing anybody getting hit by pitches. Sometimes they shake it off. Sometimes they miss time. Sometimes it’s horrifying. But when you consider that there were 1,602 batters hit last year, 844 on fastballs, and the average fastball velocity is 92.1 mph—well, they’ve all got to hurt. As I’ve discussed in previous posts, some hit batters are clearly accidents, often occurring when a pitcher, ahead in the count, comes inside on a pitch and misses. But some undoubtedly are a form of message-sending, with the message coming as a hard object thrown at a speed that would constitute assault were it not on a baseball diamond. (A notable case occurred when Cole Hamels hit Bryce Harper in 2012, then justified it on the grounds of “that old-school prestigious way of baseball.”) Intentionally throwing at hitters to exact some sort of vengeance, sorry, is dumb. But how often does it happen?

The Pirates provide a good test case, since by leading the league in hit batters on both offense and defense, they provide a decently large sample size. Here’s how large: Pirates batters were hit 89 times, tying them for 11th among the 1,926 team-seasons since 1931. Their pitchers hit 75 batters, tying them for 43rd. If you saw a lot of Pirates games, you saw a lot of batters getting hit.

And you heard a lot of excuses. The Pirates encourage pitching inside, drawing the ire of other clubs. But Pirates backers also point to the large number of Pirates batters who get hit, and the need for the pitchers to “protect” Pirates batters. You hit my Andrew McCutchen, I hit your Joey Votto. That sort of thing.

How often does that happen? Is protection–really, retaliation–a significant factor in batters getting hit? To try to answer, I classified every hit batter in Pirates games last season—164 in total—into three different categories:

  • First Blood: Named in honor of the great American thespian Sylvester Stallone, the standard by which actors have been judged. (The New York Times memorably described Arnold Scharzenegger as “the thinking kid’s Sylvestor Stallone.”) First Blood (the initial work in Stallone’s Rambo oeuvre) occurs when a batter is the first one hit in a game or series.
  • Retaliation: As a follow-up to First Blood, Retaliation occurs when a batter is hit by the pitcher whose teammate was last hit.
  • Piling On: This occurs when a team, having already had a batter hit, suffers another, with no intervening Retaliation.

(I realize that I’m ignoring hit batters as retaliation for things like inside pitches, hard slides, and being Bryce Harper. Those don’t show up in game summaries, and besides, that’s more two-eyes-for-an-eye and therefore less acceptable.)

The timeframe is important here. Hit batters occur in the context of a game, but the casus belli can stretch out longer. Al Nipper hit Darry Strawberry with a pitch in spring training of 1987, allegedly in retaliation for Strawberry taking a slow trot around the bases after hitting a home run off Nipper in the prior year’s World Series. So I looked at hit batters in three settings:

  • The game being played
  • The series between the teams, to see whether retaliation carries over from one day to the next
  • The season series, to capture longstanding grudges.

For example, on July 12, the day before the All-Star break, the Pirates’ Arquimedes Caminero hit the Cardinals’ Mark Reynolds with a pitch in the tenth inning. The next time the two teams played was on August 11. The Cardinals’ Carlos Martinez hit Pirate Aramis Ramirez in the first inning. That’s First Blood for the game and series, but Retaliation for the season series, since the prior hit batter, albeit a month earlier, was a Cardinal. Two days later, Pirates catcher Francisco Cervelli was hit by a pitch from Lance Lynn in the first inning. That was First Blood for the game, but Piling On for both the series and season series, as it followed his teammate getting hit. The next time the teams played, on September 4, Pirates reliever Jared Hughes hit Reynolds with a pitch in the ninth inning. That counts as First Blood for the game and the series, Retaliation with respect to the season series. The following day, the Pirates’ Starling Marte was hit by Jaime Garcia in the second inning. That was First Blood for the day, Retaliation for both the series and the season series. In the bottom of the second, Charlie Morton hit Jon Jay. That’s Retaliation in the context of game, series, and season series.

(Another aside: I am opposed to the use of plunked as a synonym for hit by pitch. Plunk is what happens when you’re rearranging books on your bookshelf and a paperback falls from a high shelf and hits you in the shoulder, or when you’re walking in the woods and an acorn hits your head. A 92.1 mph fastball is not a plunk.)

You may be thinking: This is pretty stupid, categorizing hit batters, what’s the point? The point is that if the Pirates pitchers are hitting opposing batters for some sort of tribal/protection/vengeance thing, we should see a lot of Retaliation. If that’s nonsense, it’s not the case.

Say a team plays 19 opponents, as the Pirates did (every National League team, plus the American League Central). Let’s also assume that the team’s pitchers hit 75 batters, as the Pirates did, and the team’s batters were hit 89 times, again as the Pirates were. If hit batters are random, we’d expect the team to be throw 19 x 75 / (75 + 89) = 8.7 First Blood pitches and get hit by 19 – 8.7 = 10.3 such pitches in season series. Thereafter, the odds of a hit batter being Retaliation or Piling On would be 50/50, subject to the distributional difference between 75 and 89. So the team would log 33.2 Retaliation and Piling on hit batters, and get hit by 39.3 of each type of pitch. Again, this assumes that hit batters occur completely randomly.

Here are the actual totals:

This kind of refutes the self-defense argument, doesn’t it? A Pirates batter was hit by a pitch before an opponent was in 61 games, accounting for nearly 70% of the team’s hit batters. But Pirates pitchers drew first blood in 56% of their games as well. Overall, retaliation accounted for only 20% of batters hit by Pirates pitchers in games. Over the course of a series, when my hit batter today can result in your hit batter tomorrow, retaliation explains only 32% of Pirates opponents hit. Even with the most liberal definition of retaliation, when it can be spread over the weeks or months of a season series, it still accounts for just 43%, less than half of batters hit by Pirates pitchers. Not that it was different on the other side: Pirates hit in retaliation accounted for only 15% of hit batters in games, 33% in series, and 39% in season series. The majority of hit batters occurred without seeming provocation.

Let’s compare the results of the Pirates games to those of the random distribution presented above. For Pirates pitchers, a random distribution would be 9 First Blood, 33 Retaliation, and 33 Piling On. Actual figures: 9, 32, 34. For Pirates batters, a random distribution would be 10 First Blood, 39 Retaliation, and 39 Piling On. Actual figures: 11, 35, 43. Those distributions (1) are pretty close to random and (2) feature less retaliation than a random distribution would suggest.

So what does it mean? Well, retaliation definitely does occur. We saw it the National League wild card game, when Pittsburgh reliever Tony Watson pretty clearly hit Cubs pitcher Jake Arrieta on purpose, in response to Cervelli and Josh Harrison getting hit by Arrieta, resulting in the silly spectacle of the benches clearing. But the example of the Pirates’ regular season, when there were a lot of hit batters, shows that retaliation isn’t as common as either code-of-honor defenders like Hamels nor hand-wringers like I might think. The numbers instead suggest that hit batters are, in fact, pretty random. Which would seem to make intentionally hitting batters a really uninformed idea as well as a bad one.

Collateral Damage of the Strikeout Scourge

In my first article for FanGraphs Community, I noted, in the summer of 2014, that batters were being hit by pitches at a near-record pace. Here is a graph showing the number of plate appearances per hit batter, from 1901 to present. I’ve reversed the scale—fewer plate appearances between HBP mean that batters are getting hit more frequently—in order to illustrate the steady climb from the World War II years to today. While the hit batter rate has flattened out since 2001 (the high point on the chart), the rate in 2015, a hit batter in every 115 plate appearances, is the 14th highest in major league history.

After I cast about for an explanation for the rise, a commenter came up with what I believe is the best explanation: strikeouts (or, as the Cistulli-designated viscount of the internet, Rob Neyer, has dubbed it, the strikeout scourge). Or, more specifically, the increase in pitchers’ counts vs. hitters’ counts during at bats. When the pitcher is ahead in the count, he is more likely to target the margins of the strike zone, either to try to get the batter to chase or to set up the batter for the next pitch. When the batter’s ahead, the pitcher doesn’t have that luxury, and must focus more on pitching in the zone for fear of losing the batter to a walk. When a pitcher’s aiming for the inside edge of the zone and misses inside, the batter can get hit.

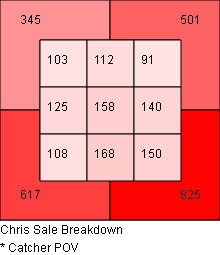
For example, here are career zone breakdowns for Chris Sale (who was a co-leader in hit batters in 2015) against right-handed hitters. At left is his location on 0-1, 0-2, and 1-2 counts. The chart at right shows 1-0, 2-0, 3-0, 2-1, 3-1, and 3-2 counts. The charts are from the catcher’s point of view, so the left side represents inside pitches. When Sale’s ahead in the count, 38% of his pitches are in the five leftmost zones. When he’s behind, that proportion drops to 31%. That’s typical. (What’s not typical is that Sale is ahead in the count a lot more than he’s behind, but you probably already knew that. Images from Baseball Savant.)

              Ahead in the count                          Behind in the count

This dynamic was clearly evident in the past season. When looking at plate appearances that ended when the pitcher was ahead in the count, batters were hit once in every 90 plate appearances. In plate appearances that ended with the batter ahead in the count, batters were hit once in every 254 plate appearances. Batters were nearly three times as likely to be hit by the pitch when they were behind in the count.

This raises a question: what other outcomes are affected by the count? We know that batters don’t do as well in general when the pitcher’s ahead. Are there outcomes other than batting average and slugging percentage that are affected by pitcher’s count?

Before answering that, I wanted to verify that pitchers are, in fact, increasingly ahead in the count. With rising strikeout rates and falling walk rates, this would seem to be tautological, but I checked anyway. I looked at the counts on which plate appearances ended for every year from 2001 to 2015. For example, in 2015, there were 183,628 plate appearances in the majors. 60,513 ended with the batter ahead (1-0, 2-0, 3-0, 2-1, 3-1, 3-2), 62,0553 ended with the count even (0-0, 1-1, 2-2), and 61,062 ended with the pitcher ahead (0-1, 0-2, 1-2). Here’s how they’ve tracked:

I didn’t go back further than 2001, but that’s not because I was being selective; it’s because the data from 2001 forward tells the story. Prior to 2001 the trends simply continued. In 2000, batters were ahead in 38% of plate appearances and pitchers in 28%, compared to 35% and 30% in 2001. The advantage to pitchers has fairly steadily expanded. I think we can say with some confidence that the past two seasons are the first two in modern baseball history in which more plate appearances ended with the batter behind than with the batter ahead.

So, having established that there are indeed more pitchers’ counts, what events are most affected by this change? To find out, I calculated the frequency of outcomes in 2015 on plate appearances with the batter ahead compared to plate appearances with the pitcher ahead. For example, in the 60,513 plate appearances that ended with the batter ahead, there were 13,501 hits. That works out to 4.5 plate appearances per hit. In the 61,062 plate appearances that ended with the pitcher ahead, there were 12,311 hits, or 5.0 plate appearances per hit. The p value for those two proportions, given the sample sizes, is 0. In other words, the difference is statistically significant, and we can safely say there is a difference in hit frequency when ahead in the count compared to behind in the count.

Here’s the full list:

According to this analysis, when the pitcher’s ahead in the count, it results in a decrease in hits, doubles, triples, home runs, and sacrifice flies. When the pitcher’s ahead, it results in an increase in stolen-base success rate, hit batters, sacrifices, and wild pitches. Those mostly make intuitive sense: when the pitcher’s ahead, the batter’s more cautious with his swings, resulting in fewer hits and less power. Similarly, when the pitcher’s ahead, he’ll work away from the heart of the plate, and misses become wild pitches and hit batters. By contrast, when the pitcher’s behind, he works closer in to the strike zone, resulting in pitches that are easier for the catcher to handle, lowering his pop time and increasing the chance of catching the runner on a steal attempt. (Max Weinstein illustrated last year that caught stealings are more likely on pitches in the strike zone.) The increase in sacrifices seems non-intuitive, since 0-2 and 1-2 counts usually shoo away the bunt due to the risk of a strikeout on a foul ball, but 0-1 counts make up for it. Batters were more likely to successfully sacrifice on 0-1 counts (1.4% of 0-1 plate appearances) than any count other than 0-0 (2.7%) in 2015.

Given that pitchers’ counts have increased and hitters’ counts have decreased, this model would predict changes in outcomes for which the differences are statistically significant. I looked at the frequency of hit batters, sacrifice flies, and wild pitches, along with the stolen base success rate, for 1979-1981 (the recent low-water mark for strikeout rate) and 2013-15. I excluded sacrifices because they’re both down sharply due to strategic reasons (managers are calling for fewer bunts) more than anything else. They results are consistent with the model.

  • Strikeouts per plate appearance: up 61%
  • Hit batters per plate appearance: up 98%
  • Sacrifice flies per plate appearance: Down 16%
  • Wild pitches per plate appearance: up 39%
  • Stolen-base success rate: up 7% (though that increase, from 66% to 73%, is probably largely strategic, since there are were 54% fewer stolen base attempts per plate appearance in 2013-15 than 1979-81, even though that may not make sense)

The graphs below, while admittedly busy, track the offensive events for which the analysis of 2015 count-related data indicated statistical significance (again, excluding sacrifices). I’ve selected the past 30 seasons. First, the affected base hits (total hits, doubles, triples and homers):

Offense rose through the 1990s despite rising strikeouts but has fallen since.

Now, the less intuitive outcomes of hit batters, wild pitches, sacrifice flies, and stolen-base success:

As the 2015 count data suggest, increased strikeouts, and therefore increased pitchers’ counts, has yielded more wild pitches, fewer sacrifice flies, a higher stolen-base success rate (though, again, that’s probably a reflection more of strategy), and, most significantly, way more hit batters (73% higher than in 1986; I truncated the scale in order to make the rest of the graph more readable).

This isn’t to suggest that these changes are solely a result of pitchers getting ahead in the count more frequently, but it does seem to be a contributing factor. Admittedly, much of the fallout from the rise in strikeouts is pretty unremarkable. There are more strikeouts and fewer walks now than in the past, so the pitcher’s ahead in the count more and the batter’s ahead in the count less; that’s unremarkable. That’s resulted in less offense — specifically, fewer hits overall and fewer extra-base hits; that’s also unremarkable. What I find more interesting are the other trends trends unrelated to strategy: the increase in hit batters and wild pitches and the decrease in sacrifice flies. It’s easy to get upset about batters getting hit by pitches, pitches rolling to the backstop, and difficulties in driving in runners from third with fewer than two outs. What’s less apparent is the degree to which those events can be linked, like lower scoring, to the rise in strikeouts.


Hit Batters as Collateral Damage of Rising Strikeout Rates

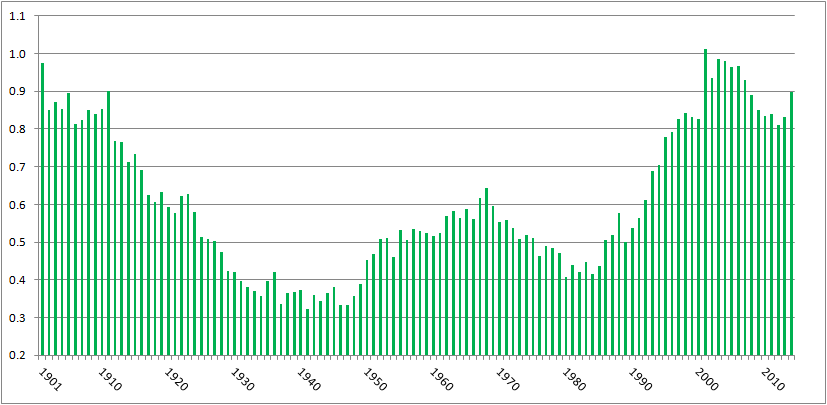
In the past, I’ve written about batters being hit by pitches–specifically, how the rate of hit batters is near all-time highs yet it hasn’t generated much, if any, outcry. Here’s a chart of hit batters per game, from 1901 (the start of the two-league era) to 2014:

HBP per game, 2001-2014

There were 0.68 hit batters per game in 2014, the eleventh-highest total over 115 years of two-league play. The top ten years, in order, have a 21st century slant: 2001, 2004, 2003, 2006, 1901, 2005, 2007, 2002, 2008, 1911.

Or, pretty much the same chart, here’s hit batters per 100 plate appearances:

HBP per 100 PA

There were 0.898 batters hit per 100 plate appearances in 2014, the tenth highest amount in the two-league era. The ten top years are, in order, 2001, 2003, 2004, 1901, 2006, 2005, 2002, 2007, 1911, and 2014.

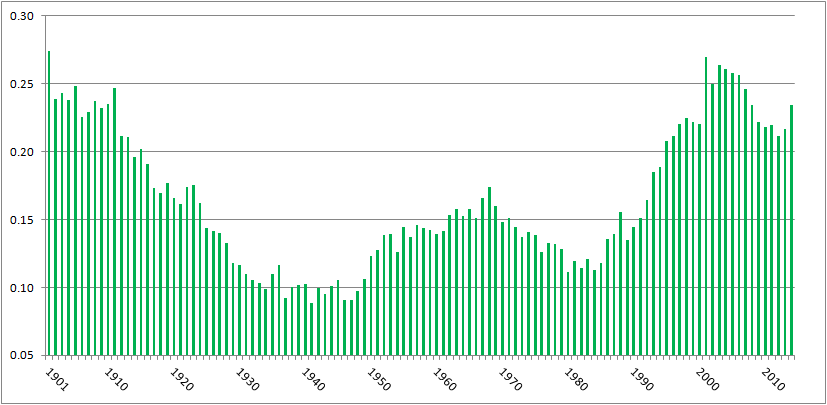
Commenter jaysfan suggested that the modern emphasis on going deep into counts has changed the number of pitches thrown per game, so perhaps hit batters per pitch haven’t changed much. It turns out the pattern still holds. Here’s a graph of hit by pitch per 100 pitches, using actual pitch counts from FanGraphs for 2002 to present, and Tom Tango’s formula of Pitches = 3.3 x plate appearances + 1.5 x strikeouts + 2.2 x walks for the preceding years:

HBP per 100 pitches

With 0.234 hit batters per 100 pitches, 2014 ranks 16th all time, behind 1901-1905, 1908, 1910, 1911, and every year from 2001 to 2007. Again, a pronounced millennial bias. (Source for all the above graphs: Baseball Reference and FanGraphs)

It’s clear, then, that we’re seeing batters getting hit at the highest rate in a century. I tried to figure out why, and came up dry. Left-handed batters, who face a wider strike zone than righties, aren’t leaning across the plate and thereby getting hit at a proportionately higher rate. HBPs are not inversely correlated to power, with pitchers more willing to pitch inside now to hitters who less frequently pull inside pitches down the line and over the fence. College graduates are slightly more likely to get hit by pitches than other hitters, but not enough to explain the change. Batters setting up deeper in the batter’s box, as measured by catcher’s interference calls, isn’t correlated to HBPs.

However, commenter Peter Jensen noted, “I don’t think there is any question that pitchers throw more to the edges of the strike zone when they are ahead in the count. This could be confirmed with a pretty simple Pitch Fx study. And if they pitch to the edge more they are also going to miss inside more (and outside more) so this could partially or even wholly account for why there are more HBPs in pitcher counts.”

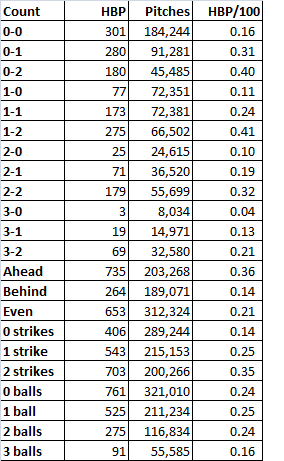
I did the PITCHf/x study Peter suggested. Using Baseball Savant data, I looked at hit by pitch by count, and as Peter found when he studied the data from 1997 and 2013, HBPs occur more when pitchers are ahead on the count. Here are the data from 2014:

2014 HBP

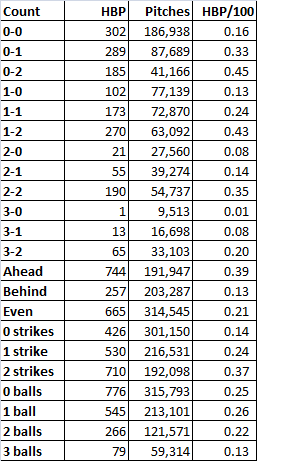
When the pitcher was ahead on the count, the batter was nearly three times as likely to get hit as when the batter was ahead. The most common counts for hit batters: 1-2, 0-2, and 2-2, and 0-1, all counts that encouraged pitchers to try to get batters to chase pitches on the border of the strike zone. Is this trend consistent? Baseball Savant’s data go back only to 2008, but using that season’s data, yes, the trend’s unchanged:

2008 HBP

Same thing. Batters are three times more likely to get hit when the pitcher’s ahead on the count, and the three most common HBP counts are two strikes with zero, one, or two balls, followed by 0-1.

So why the increase in hit batters? It appears that, as Peter implied, it’s because of the increase in strikeouts. Every three strike count requires a two strike count, obviously. In 2008, 22% of at bats went to 0-2 counts, 34% went to 1-2, and 29% went to 2-2. In 2014, those percentages had risen to 25%, 36%, and 30%, respectively, in line with the increase in strikeouts from 17.5% of plate appearances to 20.4%. The route to three strikes, which is being traveled more frequently, includes the four counts most likely to result in a hit batter. That’s why we’re seeing batters hit by pitches at rates not seen since before the first World War.

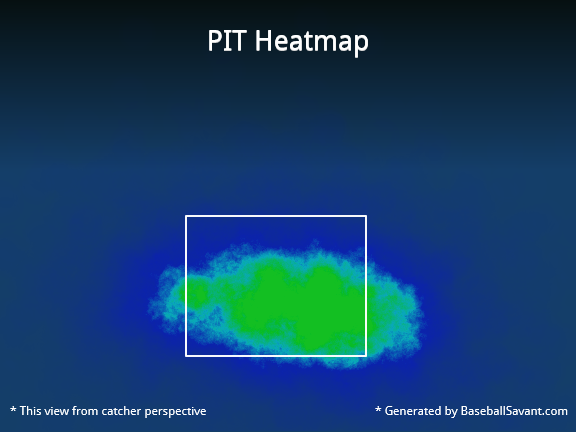
Here’s a graphical representation. In 2014, the Pirates led the majors in hit batters, handily, with 88. Here’s where Pirates pitchers threw on the hitters’ counts of 1-0. 2-0, 3-0, and 3-1:

Those greenish-yellow areas in the middle of the zone indicate that when the pitchers fell behind, they tended to locate their pitches in the strike zone. By contrast, check out the location for pitches thrown on 0-1, 0-2, 1-2, and 2-2 counts, when the pitcher could waste a pitch trying to get the batter to chase it:

That’s a much less concentrated blob, with a higher percentage of pitches outside the strike zone, where the batter can get hit.

As a final check, I ran a correlation between strikeouts per plate appearance and hit batters per plate appearance post-World War II. The correlation coefficient’s 0.82. That’s pretty high, suggesting a link between strikeouts and batters getting hit. Granted, correlation is not causation. But given that there’s an empirical link–to get to three strikes, you have to get to two, and batters with two strikes are at the highest risk of getting hit by a pitch–it’s enough to make me believe that while there are a lot of reasons more batters are getting hit by pitches, a major explanation is that hit batters are a consequence of rising strikeout rates.

CODA: If there were a day last season that I thought might’ve turned to tide on batters getting hit by pitch, it was Thursday, September 11. That day, there were 15 HBPs in 11 games. That doesn’t include the horrific fastball to the face that ended Giancarlo Stanton’s season; that pitch was a strike. A lot of stars got hit: Stanton, Mike Trout (twice), Yoenis Cespedes, Carlos Gomez, Jayson Werth. Tampa Bay’s Brad Boxberger hit Derek Jeter in the elbow. Had that pitch ended Jeter’s farewell tour, I really think it would’ve created an issue of rising HBP rates. Fortunately for Jeter and purveyors of Jeter memorabilia, it didn’t. But taking the 15 hit batters together, plus Stanton, and excluding two obvious retaliation jobs (Anthony DeSclafani hitting Gomez after Stanton got hit, Joe Smith hitting Tomas Telis after Trout got hit a second time), the fourteen hit batsmen occurred on six 0-1 counts (including Stanton and Jeter), three 1-2 counts, two 1-1 counts, and one count each of 0-0, 2-1, and 2-2. There was only one HBP with the batter ahead on the count, and ten occurred on the four counts identified here as the most dangerous for batters.


Rising HBP Rates: Seeing the Symptom, Seeking the Cause

As I noted here on August 15, major league batters are being hit by pitches at rates not seen in over a century (measured by HBP/game). I offered data illustrating this but was at a loss explaining it. Fortunately, I spent the following weekend at the Saber Seminar in Boston, surrounded by a bunch of really smart people, so I posed the question to them.

To be clear, everyone was surprised by the conclusion. Through Sunday’s games, there were 67.4 hit batters per 100 games in 2014. That’s the highest rate since 2001-2008 which, in turn, is the highest since the two leagues were formed in 1901. (Note that these numbers are different from the ones in my original post. When I downloaded league totals from FanGraphs, I hadn’t realized that Games referred to player games, not team games. So I was using a denominator that was too large. The conclusions still hold. I’ve updated the figures in a comment to the August 15 post.) If you didn’t notice this spike in hit batters, join the club. This appears to be an entirely under-the-radar trend.

Asking around, I got several possible explanations. Dave Cameron, FanGraphs managing editor, suggested that since PITCHf/x has clearly demonstrated that left-handed hitters suffer from an elongated strike zone on the outside part of the plate, lefties might be setting up closer to home in order to reach those outside “strikes.” That would make them more likely to be hit by inside pitches.

To test this, I looked at data from 2010-13, when there were 63.8 hit batters per 100 games, and compared them to 1980-83, when there were just 32.6. Switching from HBP/100 games to HBP/1000 plate appearances (since games contain a combination of left- and right-handed batters), the hit batter rate went from 4.3 in 1980-83 to 8.3 in 2010-2013. Right handed hitters got hit at a rate of 4.6 per 1000 plate appearances in 1980-83 and 9.0 in 2010-13, an increase of 95%. For lefties, the HBP rate went from 3.8 to 7.3, and increase of…95%. Exactly the same. Handedness hasn’t been an issue.

Former major league pitcher Brian Bannister suggested that I correlate HBP rates to measures of power. He noted that he didn’t like to come inside on sluggers, for fear that they’d pull the pitch down the line and into the bleachers. I thought this was a sharp, counter-intuitive insight: A rash of longballs makes pitchers work away rather than come inside. With offense in retreat in recent years, pitchers are more willing to pitch inside, and when they miss, the batter gets hit.

I looked at three measures of power: home runs per plate appearance, slugging percentage, and isolated power. I correlated these metrics to hit batters per game for the period 1980-2013. If Brian’s hypothesis is correct, there should be a negative correlation–as power increases, hit batters decrease. However, the opposite was true: 0.84 correlation coefficient between hit batters per game and homers per plate appearance, 0.55 for slugging percentage, 0.65 for isolated power. Maybe my endpoints were wrong? I checked 1970-2013 and got pretty much the same results: Correlation coefficients of 0.84 for HR/PA, 0.66 for SLG, 0.73 for ISO. I was ready to think that maybe hit batters are a result of more power, not less, but then I picked 1990-2013. At least during those 14 years the correlations were weaker, coming in at 0.82 for HR/PA but 0.25 for SLG and 0.43 for ISO. That’s still consistent with the observation that hit batters have remained high in the post-PED era. I don’t see a strong case for fingering the long ball as a cause for hit batsmen, one way or the other.

SiriusXM radio host Mike Ferrin thought we may be seeing a cultural shift of sorts. In college ball, he pointed out, batters view getting hit as an on-base weapon. Might an influx of college players be driving up HBP rates?

Unfortunately, neither the FanGraphs Leaders board nor the Baseball Reference Play Index have college vs. non-college splits, so I looked at the most-plunked batters in 2013 and 1983. In 1983, players with four or more HBP represented the top 53 overall and collectively comprised 274 of 717 HBP that year, or 38%. Of those 53, 30 (56%) attended a secondary school in the US. (I am going to use “attended college” instead of “attended secondary school” going forward, but I mean players who went on for any schooling, including junior college, following high school in the US.) They were hit 10.2 times per 1,000 plate appearances. Players who didn’t go to college were hit 10.4 times per 1,000 plate appearances. That’s our baseline: No evidence of college kids leaning into pitches the year “Every Breath You Take” and “Billie Jean” were top hits.

Now, 2013. There were 15% more teams than in 1983. As it happens, there were 61 hitters with seven or more HBPs in 2013, and 61/53 = 1.15, so 61 is the appropriate sample size for consistency. Those 61 batters were hit 587 times, 38% of all HBP, just like our sample for 1983. Here are the relevant metrics:

  • Percentage of most-hit players who attended college: 57% (30 of 53) in 1983, 49% (30 of 61) in 2013
  • Percentage of HBPs by most-hit players that were players who attended college: 56% (167 of 298) in 1983, 47% (275 of 587) in 2013
  • HBP per 1,000 plate appearances, all most-hit players: 10.4 in 1983, 18.2 in 2013
  • HBP per 1,000 plate appearances, most-hit players who attended college: 10.2 in 1983, 18.5 in 2013
  • HBP per 1,000 plate appearances, most-hit players who didn’t attend college: 10.8 in 1983, 17.9 in 2013

Mike has a point. College players appear to be getting hit more, relative to other hitters, than they were in the past. The rate of HBP per 1,000 plate appearances increased 82% over 30 years for batters who went to college. However, the HBP rate for batters who didn’t go to college was up 65%, which is also pretty dramatic. And the list of HBP leaders has more players who didn’t go to college than in 1983. So while college kids may be bringing a lean-into-the-pitch ethic to the plate, there is still strong evidence that players who didn’t attend college are getting hit more, and the limited data I used don’t indicate that college kids are comprising a growing percentage of plate appearances.

Some of the commenters on my post from the 15th suggested that maybe HBPs are up because pitchers are throwing harder, giving batters less of an opportunity to get out of the way of an errant delivery. Per FanGraph’s PITCHf/x data, average fastball velocity has climbed from around 91 mph in 2007-9 to 92 mph in 2013-14. That’s a pretty tiny difference from a hitter’s perspective (about five milliseconds, or 0.005 seconds, over 60.5 feet), but it’s something. I’m not ruling it out.

Last Wednesday on the Effectively Wild podcast, Baseball Prospectus’s Sam Miller noted that the rate of batters reaching base via catcher’s interference is near all-time highs. (And you thought hit batsmen per 1000 plate appearances was obscure…) He hypothesized that one of the reasons is that batters are standing further back in the batter’s box in order to get extra time — maybe like five milliseconds? — to identify and swing at an incoming pitch. By setting up deeper in the box, batters increase the possibility that their bat may hit the catcher’s glove at the end of their swing, drawing the catcher’s interference call. If that’s correct, wouldn’t moving back also give pitches that break horizontally — two-seam fastballs, sliders, cut fastballs, some changeups — more time to drift into the hitter? It makes sense!

Unfortunately, the numbers don’t back this up. The correlation coefficient between catcher’s interference and hit by pitches is 0.00 since 1962 (expansion in both leagues), -0.10 since 1969 (divisional play), and 0.07 since 1994 (three divisions per league). That doesn’t necessarily mean that the increase in hit batsmen isn’t caused by batters positioning themselves toward the back of the batter’s box, but it does say that whatever’s driving catcher’s interference isn’t the same thing that’s driving hit batters.

So basically I’m back to where I was going into the Saber Seminar. We’re seeing batters hit by pitches at rates not seen in a century. This change has not been widely reported, and I haven’t identified an obvious underlying cause. After talking to people at the Seminar, I still don’t have a great explanation. It could have a little bit to do with fastball velocity, or batter positioning, or players who went to college being willing to get plunked. But I haven’t identified a clear reason thus far. Even with smart guys helping me.


Living in Dangerous Times

Let’s start with the surprising conclusion: Batters are getting hit by pitches at near-historic rates. For all that you hear about pitchers who won’t pitch inside, and umpires issuing warnings that make it impossible to throw at hitters, and batters being unwilling to take one for the team, we’re seeing batters get hit by pitches at the highest rate since the turn of the last century.

I looked at each decade since 1901, the first year there were two leagues. Using FanGraphs’ Leaders page, I calculated the number of hit batsmen per 100 games played:

   1901-1910  6.5

   1911-1920  4.9

   1921-1930  3.6

   1931-1940  2.6

   1941-1950  2.4

   1951-1960  3.1

   1961-1970  3.4

   1971-1980  3.1

   1981-1990  3.0

   1991-2000  4.7

   2001-2010  5.8

   2011-2014  5.3

Baseball was kind of a wild game in the early days, with all sorts of shenanigans on the ball field, including throwing at batters. Hit batsmen were already in decline when, on August 16, 1920, Carl Mays hit Ray Chapman in the head with a pitch, killing him. Hit batters declined through the next three decades, bottoming out at 2.14 per 100 games in 1946. They stayed around 3 or so per 100 games through the 1980s, and then they took off. Here are the 30 years with the most batters hit by a pitch per 100 games:

    1. 1901  8.0       11. 1907  6.1       21. 2008  5.5

    2. 1903  6.9       12. 2004  6.1       22. 2011  5.3

    3. 1905  6.9       13. 1909  6.0       23. 2009  5.3

    4. 1902  6.8       14. 2003  6.0       24. 2013  5.2

    5. 1904  6.6       15. 2006  6.0       25. 1913  5.2

    6. 1911  6.5       16. 2005  6.0       26. 2010  5.2

    7. 2001  6.2       17. 2007  5.8       27. 1999  5.1

    8. 1908  6.1       18. 2014  5.7       28. 1998  5.1

    9. 1910  6.1       19. 2001  5.7       29. 2000  5.1

   10. 1906  6.1       20. 1912  5.5       30. 2012  5.1

Isn’t that strange? Every year from 1901 to 1913 and every year since 1998. Nothing from the intervening 84 seasons. It raises two questions:

  1. What’s going on? Why have hit batsmen increased despite efforts to cut down on beanball wars? It really has turned on a dime. There were 3.8 hit batsmen per 100 games in 1992, the 68th straight year below 4.0. It hasn’t been below that level since.
  2. When will it change? Andrew McCutchen’s plunking was a big story but didn’t lead to any calls for change. Amid laudable efforts to improve player safety, from batting helmets to neighborhood plays to home plate collision rules, hit batters are returning to levels not seen since the year before Babe Ruth’s rookie season. There have been some pretty terrible beanings, like Jason Heyward’s last year. Let’s hope it doesn’t take something worse than that to reverse the trend.