Archive for FIP

Introducing XRA: The New Results-Independent Pitching Stat

There are a multitude of ways that we can judge pitchers. Most people look at earned run average to gauge whether a pitcher has been successful, while many old school announcers will still cite a pitcher’s win-loss record. ERA is a nice, easy way of looking at how a pitcher has performed at limiting runs, but it doesn’t come close to telling the whole story. In the early 2000s, Voros McCracken created the idea of Defense Independent Pitching Stats or DIPS, which credited the pitcher only with what he could actually control. Fielding Independent Pitching was born from this theory and only took into account a pitcher’s strikeouts, walks and home runs allowed. It turns out that a pitcher’s home run rate is not terribly consistent, thus xFIP was created by Dave Studeman to normalize the home run aspect of the FIP equation by using the league home run per fly ball rate and the pitcher’s fly ball rate.

In 2015, a new metric was developed by Jonathan Judge, Harry Pavlidis and Dan Turkenkopf called Deserved Run Average or DRA. This new stat attempts to take into account every aspect that the pitcher has control over and control for everything that he does not, thus crediting the pitcher only for the runs that he actually deserves. DRA, however, is still dependent on the result of each batted ball. If the batter hits a ball deep in the gap and it rolls to the wall, the pitcher is charged with a double, but if the center fielder lays out and makes a remarkable catch, the pitcher is credited with an out. When evaluating pitchers, why should it matter whether they have a Gold Glove caliber defender behind them or not? It shouldn’t, and that’s where Expected Run Average comes in.

Expected Run Average or XRA gives pitchers credit for what they actually can control. FIP attempts to do this as well but assumes that pitchers have no control over batted balls. While the pitcher does not control how the fielders interact with the live ball, he does have an impact on the type of contact that he allows. XRA is based on a modified DIPS theory that the pitcher controls three things: whether he strikes the batter out, whether he walks the batter and the exit velocity, launch angle combination off the bat. After the ball leaves the batter’s bat, the play is out of the pitcher’s hands and should no longer have any effect on his statistics. The goal is to figure out a way to measure, independently of the defense and park, how each pitcher performs on balls in play. Since 2015, StatCast has tracked the exit velocity and launch angle of every batted ball in the majors. Each batted ball has a hit probability based on the velocity off of the bat and its trajectory. The probability for extra bases can also be determined. These batted ball probabilities have been linearly weighted for each event including strikeouts and walks to give each player’s xwOBA, which can be found on Baseball Savant. This is the perfect way to look specifically at how well a pitcher has performed on a per plate appearance basis.

Once xwOBA is found, then XRA can be calculated. The first objective is to find the pitcher’s weighted runs below average. To do this, I used the weighted runs above average formula from FanGraphs except I made it negative since fewer runs are better for pitchers.

wRBA = – ((xwOBA – League wOBA) / wOBA Scale) * TBF

For example, Max Scherzer has had a .228 xwOBA so far this season and has faced 487 batters. After finding the league wOBA and wOBA scale numbers at FanGraphs I can plug these numbers into the formula.

– ((.228 – .321) / 1.185) * 487 = 38.22

Max Scherzer has been 38.22 runs better than average so far this season, but now I need to figure out what the average pitcher would do while facing the same number of batters. To find this I need the league runs per plate appearance rate and multiply that number by the number of batters that Scherzer has faced.

League R/PA * TBF = Average Pitcher Runs
.122 * 487 = 59.41

So a league average pitcher would have been expected to surrender 59.41 runs facing the number of batters that Scherzer has so far this season. Now that we know how the average pitcher should have performed we can find the expected number of runs that Scherzer should have surrendered so far this season by subtracting his wRBA of 38.22 from the average pitcher’s runs.

Average Pitcher Runs – Weighted Runs Below Average = Expected Runs
59.41 – 38.22 = 21.19

Based on Scherzer’s xwOBA, he should have only given up 21.19 to this point in the season. If this sounds incredible it’s because this is the lowest mark of any starting pitcher though the first half of the season. Finally, XRA is found by using the RA/9 formula by multiplying the expected number of runs allowed by 9 and then dividing by innings pitched.

(9 * Expected Runs) / Innings Pitched = XRA
(9 * 21.19) / 128.33 = 1.49

Max Scherzer’s XRA of 1.49 is easily the lowest of any starter through the first half. The second best starter has been Chris Sale who has a 2.15 XRA. Of course these names are not surprising as they each started the All Star Game and are both currently the front runners for their leagues’ respective cy young award.

Here is a list of the top ten qualified pitchers:

Pitcher XRA
Max Scherzer 1.49
Chris Sale 2.15
Zack Greinke 2.26
Corey Kluber 2.33
Clayton Kershaw 2.34
Dan Straily 2.87
Lance McCullers 2.89
Chase Anderson 3.11
Luis Severino 3.17
Jeff Samardzija 3.23

And the bottom ten:

Pitcher XRA
Matt Moore 6.58
Kevin Gausman 6.47
Derek Holland 6.32
Matt Cain 6.26
Ricky Nolasco 6.26
Wade Miley 6.17
Johnny Cueto 6.10
Martin Perez 5.97
Jason Hammel 5.95
Jesse Chavez 5.84

Full First Half XRA List

It is interesting to see that three members of the Giants rotation rank in the bottom seven in all of baseball. In fact, AT&T Park is such a pitcher-friendly park that once you park adjust these numbers, Moore, Cain and Cueto become the three worst pitchers in baseball. It’s not surprising then why the Giants are having such a disappointing season.

One measure of a good stat is whether or not it matches your perception. Therefore, while it is interesting to see Dan Straily as one of the best pitchers in baseball and Johnny Cueto as one of the worst, it is much more assuring to see Max Scherzer, Chris Sale and Clayton Kershaw as some of the very best in the sport. The numbers for relievers also reveal how dominant Kenley Jansen and Craig Kimbrel have been. This is all good evidence that XRA is doing what it is supposed to do, accurately displaying how good pitchers have actually been, independent of all other factors.

Another important characteristic of a good stat is how well it correlates from year to year. While ERA is the most simple and popular way to look at pitchers, it is not very consistent. XRA is much more consistent than ERA and FIP and also compares favorably with xFIP. However, it is not as consistent as DRA. DRA controls for so many aspects of the game that it should be expected to be the most consistent. However, being the most predictive or most consistent stat is not necessarily the goal of XRA. The real goal is to show how well the pitcher actually did, and XRA seems to do this remarkably. While not being as consistent as a stat like DRA, the level of consistency is extremely encouraging and puts it right in line with the other run estimators.

XRA is a stat that takes luck, defense, and ballpark dimensions out of the equation. When evaluating a pitcher, he shouldn’t be penalized for giving up a 350-foot pop fly for a home run in Cincinnati while being rewarded for that same pop fly being caught for an easy out in Miami. With XRA, no longer will people have to quibble about BABIP, since it is results-independent and removes all luck from consideration. A ground ball with eyes will now be treated the same whether it squirts through for a single or is tracked down for an out. Pitching ability will no longer need to be measured with an eye on the level of the defense. It takes a good offense, a good pitching staff and a good defense to make a great team, and with XRA we can finally separate all of these important factions.


Atlanta’s Shocking Triple-A Soft-Tossing Pitcher

If you take a look at the leaderboards on FanGraphs for all triple-A pitchers this year, you’ll find a surprising pitcher in the lead in FIP who is above two Rays pitchers, MVP of the Futures Game Brett Honeywell and Yonny Chirinos, along with surprising pitcher Buck Farmer. It’s Andrew Albers, with a 2.58 FIP in triple-A in 77.1 IP, 20 appearances, and 11 starts, with a less impressive 3.61 ERA, along with a sterling 2.77 xFIP.

What’s driving this 2.58 FIP? A strikeout rate of 9.54 per 9, with a measly 1.40 walks per 9 and .58 homers per 9, which is shockingly low, even for him. The home runs will likely increase as he isn’t getting too many ground balls; 46.2% is all right, but not elite. He is also getting a ton of infield pop-ups, with a shockingly high 21.9%. He has had very high infield pop-up numbers in the minors before, which make it easier to do as well as he had, although some negative regression should be expected.

Why his ERA is too high: He generally runs a high BABIP as it has usually been above .330 in the minors since 2015. This year his BABIP is a ridiculous .372 which is inflating his numbers above where can can truly perform at. It should regress to normal levels, maybe even a .320 BABIP perhaps, since minor-league defenses are worse than big-league defenses are (even the A’s pitiful defense).

His strikeout and walk rates are exceeding previous levels; last year in triple-A his walk rate was a good but not great 2.17 per 9, while his strikeout rate was a disappointing 6.08 per 9. I think he’ll likely negatively regress in his K/9 to around 7.5 per 9, walks to around 1.9/9.

But, there’s a chance that Albers could just be a second coming of Jamie Moyer, which could be useful for a big-league team looking for a cheap player to be their fifth starter, since he wouldn’t cost much on a minimum MLB contract or in prospects, and for all intents and purposes is a poor man’s Jason Vargas, who has been surprisingly good this year and is a Comeback Player of the Year candidate. It seems like Albers has made a serious adjustment in performance. Quite an interesting buy-low opportunity for a playoff hopeful that is tight on prospects (Angels, Royals), or tight on cash (Brewers, Rays, Twins, Royals). The Braves should have an extra selling chip that they didn’t know about before. Granted, they might get a lottery-ticket prospect for him, but the Braves are rebuilding, so they need prospects to try out at the big-league level eventually since a lot will flame out. Another pitcher who is similar to Albers is Wade LeBlanc, who I feel should be a starting pitcher for the Pirates, especially considering their rotation issues. But it seems like the thought of him starting is scarier to them than being in a saw trap.

It’s an idea that teams like the ones above should use to get underrated players cheap, while teams that have players like that should sell them for more value than they invested in the player. His best comp is of a right-handed pitcher who is with the Blue Jays: Marco Estrada. They have similar velocities, similar lack of performance till they got older, and get lots of pop-ups. Essentially, he is a left-handed version of Marco Estrada, and Marco Estrada received $26 million over two years after the 2015 season — quite an interesting thought. Especially considering his unimpressive stats in the majors so far. Let’s see if anyone will be willing to give him a chance as a swingman, as he could be an amazing fit on the Nationals; way better than Jacob Turner, and he could start in place of Joe Ross if he performs the way he has so far.

All stats from FanGraphs as of 7-13-2017. I do not own any stats or pages used to help me write this article.


dSCORE: Pitcher Evaluation by Stuff

Confession: fantasy baseball is life.

Second confession: the chance that I actually turn out to be a sabermetrician is <1%.

That being said, driven purely by competition and a need to have a leg up on the established vets in a 20-team, hyper-deep fantasy league, I had an idea to see if I could build a set of formulas that attempted to quantify a pitcher’s “true-talent level” by the performance of each pitch in his arsenal. Along with one of my buddies in the league who happens to be (much) better at numbers than yours truly, dSCORE was born.

dSCORE (“Dominance Score”) is designed as a luck-independent analysis (similar to FIP) — showing a pitcher might be overperforming/underperforming based on the quality of the pitches he throws. It analyzes each pitch at a pitcher’s disposal using outcome metrics (K-BB%, Hard/Soft%, contact metrics, swinging strikes, weighted pitch values), with each metric weighted by importance to success. For relievers, missing bats, limiting hard contact, and one to two premium pitches are better indicators of success; starting pitchers with a better overall arsenal plus contact and baserunner management tend to have more success. We designed dSCORE as a way to make early identification of possible high-leverage relievers or closers, as well as stripping out as much luck as possible to view a pitcher from as pure a talent point of view as possible.

We’ve finalized our evaluations of MLB relievers, so I’ll be going over those below. I’ll post our findings on starting pitchers as soon as we finish up that part — but you’ll be able to see the work in process in this Google Sheets link that also shows the finalized rankings for relievers.

Top Performing RP by Arsenal, 2016
Rank Name Team dSCORE
1 Aroldis Chapman Yankees 87
2 Andrew Miller Indians 86
3 Edwin Diaz Mariners 82
4 Carl Edwards Jr. Cubs 78
5 Dellin Betances Yankees 63
6 Ken Giles Astros 63
7 Zach Britton Orioles 61
8 Danny Duffy Royals 61
9 Kenley Jansen Dodgers 61
10 Seung Hwan Oh Cardinals 58
11 Luis Avilan Dodgers 57
12 Kelvin Herrera Royals 57
13 Pedro Strop Cubs 57
14 Grant Dayton Dodgers 52
15 Kyle Barraclough Marlins 50
16 Hector Neris Phillies 49
17 Christopher Devenski Astros 48
18 Boone Logan White Sox 46
19 Matt Bush Rangers 46
20 Luke Gregerson Astros 45
21 Roberto Osuna Blue Jays 44
22 Shawn Kelley Mariners 44
22 Alex Colome Rays 44
24 Bruce Rondon Tigers 43
25 Nate Jones White Sox 43

Any reliever list that’s headed up by Chapman and Miller should be on the right track. Danny Duffy shows up, even though he spent most of the summer in the starting rotation. I guess that shows just how good he was even in a starting role!

We had built the alpha version of this algorithm right as guys like Edwin Diaz and Carl Edwards Jr. were starting to get national helium as breakout talents. Even in our alpha version, they made the top 10, which was about as much of a proof-of-concept as could be asked for. Other possible impact guys identified include Grant Dayton (#14), Matt Bush (#19), Josh Smoker (#26), Dario Alvarez (#28), Michael Feliz (#29) and Pedro Baez (#30).

Since I led with the results, here’s how we got them. For relievers, we took these stats:

Set 1: K-BB%

Set 2: Hard%, Soft%

Set 3: Contact%, O-Contact%, Z-Contact%, SwStk%

Set 4: vPitch,

Set 5: wPitch Set 6: Pitch-X and Pitch-Z (where “Pitch” includes FA, FT, SL, CU, CH, FS for all of the above)

…and threw them in a weighting blender. I’ve already touched on the fact that relievers operate on a different set of ideal success indicators than starters, so for relievers we resolved on weights of 25% for Set 1, 10% for Set 2, 25% for Set 3, 10% for Set 4, 20% for set 5 and 10% for Set 6. Sum up the final weighted values, and you get each pitcher’s dSCORE. Before we weighted each arsenal, though, we compared each metric to the league mean, and gave it a numerical value based on how it stacked up to that mean. The higher the value, the better that pitch performed.

What the algorithm rolls out is an interesting, somewhat top-heavy curve that would be nice to paste in here if I could get media to upload, but I seem to be rather poor at life, so that didn’t happen — BUT it’s on the Sum tab in the link above. Adjusting the weightings obviously skews the results and therefore introduces a touch of bias, but it also has some interesting side effects when searching for players that are heavily affected by certain outcomes (e.g. someone that misses bats but the rest of the package is iffy). One last oddity/weakness we noticed was that pitchers with multiple plus-to-elite pitches got a boost in our rating system. The reason that could be an issue is guys like Kenley Jansen, who rely on a single dominant pitch, can get buried more than they deserve.


Rick Porcello’s Shot at the Cy Young Award

You’ve probably read countless treatises on the reasons that Chris Sale, Corey Kluber, or Justin Verlander would be more deserving of the Cy Young Award this year.

Well, I’m sorry to disappoint, but Rick Porcello is probably going to win the award. It’s going to upset a lot of quantitative purists that adjust for everything. Pick your favourite value-added statistic, and Rick probably doesn’t quite win it, or there is an inherent flaw where you can take something away from him on the stats that he did lead (WHIP and BB allowed). The truth is that this year’s winner will reflect quantitative and qualitative considerations.

Consistency, volume, and increasing difficulty  

He, of the never-meltdown. Rick allowed five runs once, and never failed to give his team 5.0 IP in any start this year. Not to suggest that innings-eating alone should be rewarded — Wade Miley, take a bow — but Porcello has provided a quality start in every start since June 28 (with the exception of one 4 ER, 6.2IP appearance on July 24). Tim Britton captures it well in a recent article for the Providence Journal, noting that every other candidate has been shelled a few times, and Hamels not once, not twice, but fifce! I’m sure it was nice for the boys in the dugout to know that if they played reasonably well offensively, that there was a very good chance to win every time Porcello was on the mound, and with it, a good chance that losing streaks would be rare for the team. A casual observation, much as any season-ticket holder in Boston might note, is that Porcello made one of the worst pitchers’ parks into a graveyard. 13-1, with a 2.88 ERA in Fenway, is no easy task.

With a decent start Friday night, Porcello finished with 223 IP. Both Sale and Verlander just clipped that, but Porcello finished near the highest inning total of the candidates, so workload could also be a consideration.

It also got no easier as the game wore on as he was better each time through the order: .264, .230, .195, and .121. Yes, Kluber has managed to pitch to some of the best soft contact this season, but that alone is not going to win the award, and is a fringy measure that does not have full traction from the press.

Image

Porcello puts in the work, keeps his head down, and would appear to be pretty humble about it. Most people didn’t even notice him over there in Boston. Porcello perhaps did not need to contend with throwback jerseys, but making confetti of your uniform isn’t the spirit of the game, and may well have left a Windy City starter as another man out this year.

Punishing wins & The Contender Effect

While it may be in vogue to punish pitchers for having good teammates, making allowance for consistency, Porcello has still won 22 games. Say what you will, but most people want a winner. A winner in a big market, with big stories, and a big slugger, are good things all-around for the league. Too often pitchers are victimized for the fielders behind them, but what is rarely addressed is that a pitcher can sometimes deploy this to his advantage, and Porcello has certainly made the best use of his team in this regard.

Frequency bias in the awarding of the AL Cy Young

Major League Baseball’s penchant for sharing has been well documented. This is well covered by a certain Managing Editor with a man who hits and walks, and who has been oft-written as being the ‘best-hitting guy’ every year, but who will likely finish second because, gosh, he’d much rather share with a friend from Boston with a winning smile. The writers association hasn’t allowed a repeat AL Cy Young winner since Pedro in the 99 & 00 seasons, and what I will call a ‘gap’ winner since 04 & 06 with Johan Santana. In both those cases, first-place votes were unanimous, and that certainly won’t be the case with this year’s crop. Kluber is ‘too soon’ (2014) and Verlander is too, well, I don’t know what, but he won it in 2011. Since Detroit failed to make the playoffs, I suppose you could pull in the Contender Effect that leaks into the psyche of proletariat, and certainly to some extent, with the voters.

Conclusion

It’s not that Porcello is so much more deserving of the award, but rather, that nobody else has distanced themselves from the pack so as to make themselves most deserving. In addition, he’s made a timely run for it against other guys who have ‘been here before’ or have given other reasons to not vote for them. He’s had some luck, but he has also shone in two of the leading controllable areas — by limiting walks (first among starters) and hits (first among starters in WHIP). There are qualitative factors that will affect the outcome and for these reasons, I think we’ll be crowning someone that has not won the award yet and that’s good for the game.


The Flame-Throwing Myth

Is pitch velocity an indicator of a good pitcher?

Over this past summer, the Twins struck a deal with the Boston Red Sox to send specialist Fernando Abad to Boston for prospect Pat Light. Light, 25, first pitched in the majors in 2016, where in two innings with the Red Sox, he had allowed 8 runs (7 earned). After the deal, he has spent the rest of the season with the Twinkies. His numbers do not look much better, with an ERA of 10.22 in 12.1 innings pitched. Over his minor-league career, he has posted a 4.35 ERA in five seasons. Why did the Twins want this guy? He was 25, fully established as a reliever, and has only dominated the minors in 2016.

One of my theories is that the Twins saw that Light is a flame-thrower. Recently, he hit 101 miles per hour on a pitch. Are the Twins fixated on his high velocity? Looking at the Twins’ bullpen, another below-average pitcher, Ryan Pressly, is also touted for his high velocity.

I am not saying definitively that the Twins are focusing on pitchers’ velocities to value prospects and players; previously I wrote about how teams have focused on batters’ exit velocities, so perhaps the Twins have tried to apply this mentality toward pitchers.

Either way, I decided to delve into this topic, seeing if a pitcher’s velocity indicates a lower ERA, FIP, and BABIP, or a higher strikeout rate and walk rate. Using MLB’s Statcast, I was able to parse their data to record a pitcher’s average velocity. Using these data, I tried to establish the skill set of a flame-thrower.

To do this, I performed linear regressions between these different factors, seeing if any of these values are highly related to or influenced by faster pitching.

First, I looked at FIP and velocity. Below are the results:

fipandvelocity

Not a strong relationship, yielding an R-squared of 0.09. This relationship does show that as velocity increases, FIP tends to decrease, but again, not a very convincing relationship.

Next, I looked at ERA and velocity:

velocitytoera

It yielded a similar result, a weak negative relationship, if any.

While the results for ERA and FIP were disappointing, I figured BABIP might look better. If a pitcher can throw faster, it would make sense that the batter would have a tougher time making contact, leading to weaker contact and a lower BABIP. Did the results agree? Have a look:

babiptovel

Disappointing. No relationship at all.

On to strikeout rate and walk rate.

I immediately thought of Aroldis Chapman. He has the fastest heater in the league, and his strikeout rate is above 40%, nearing the top of the league. I was much more optimistic for these metrics.

Here is velocity to strikeout rate:

velocitytok

Not a great relationship, yielding an r-squared of .13. It is a little stronger than anything else we have seen, but that is not saying much at all.

Finally, here is velocity and walk rate:

veloctytowalk

Not much going on here as well.

What does this all mean? Well, for starters, it shows that there are other factors that determine how effective a pitcher is. These data show that these metrics are not the end-all-be-all of a pitcher’s skill. Velocity is not a key indicator of an effective pitcher. Sure, the fastball probably needs to be upward of 85 miles an hour, but speed is not the most important factor. Rather, other skills, such as control, deception, and quality of breaking pitches might be just as important, if not more important, than velocity.

I don’t know if the Twins specifically targeted Light because of his velocity, but in his stint with the Twins, he’s averaged 10.9 walks per 9 innings. What good does his speedy fastball do if he cannot get it over the plate?

After my analysis, I’ll admit I’m a little surprised. I would think a higher velocity would mean a higher strikeout rate. But I am wrong. I guess for every flame-throwing Aroldis Chapman, there is an equally effective Andrew Miller, who does not posses the 105 mile-an-hour heater, but has a higher strikeout rate.


The Twins Gave Up on Pitching to Contact Before We Did

For many Minnesota Twins fans, the recently vintage dominance of the AL Central that spanned seemingly the entirety of the first decade of the 2000s had been taken for granted. I, for one, am guilty of this, and like many fans, am starting realize that winning is not easy, although the Twins made it seem as easy as Torii Hunter made robbing home runs look effortless. Nostalgia aside, the Twins, and their fall toward mediocrity, are an interesting topic to look into. To some, they seemed a similar team to the Oakland Athletics (perhaps aiding in the creation of a post-season rivalry). The Twins, who were not quite as much of a small-market team as Oakland, seemed to develop from within. They had a deep minor system, so deep that when Johan Santana or Torii Hunter deemed it time to cash in, the Twins were able to find a quick replacement and continue their success. Santana, and Hunter, as well as Joe Mauer and Justin Morneau (who have both had their careers altered due to more recent concussions) and many other corner pieces, all made their debut in a Twins uniform and became cornerstones, yet they could never win the big playoff series.

They did not have the ability to flex the financial muscle that the Red Sox, Yankees, and even division rivals Detroit Tigers were capable of; however, they still managed to win the AL Central six out of the 10 years in the previous decade, including a loss in a playoff game to decide the division winner in 2008. The success carried into the Target Field era, represented by a beautiful ballpark that fans spent what seems like an eternity waiting for. After another disappointing playoff loss to the hated Yankees, the Twins entered 2011 looking to improve, with a similar roster and the intrigue of Japanese second baseman, Tsuyoshi Nishioka. That year was filled with injuries, and despite a post-All-Star Game push, the Twins ended the year with the worst record in the American League. Since then, the Twins have failed to reach the playoffs, and are currently battling with the Atlanta Braves for the worst record in baseball. Not to mention, long-time general manager Terry Ryan, the one credited with building the farm system leading to the team’s prior success, was fired on July 18th. Time to find out where the Twins went wrong.

Those successful Twins teams were always credited for their small-ball and defensive skills. With Joe Mauer behind the plate, Torii Hunter (replaced by Carlos Gomez, who could also flash some leather) and many other solid defenders manning the diamond, a lot of the Twins’ success was credited to this defense.

Yet the Twins were far from a one-dimensional team. The Twins had a solid pitching staff, including, most famously, Johan Santana, who was a two-time Cy Young winner with the club, before being sent off to New York. The Twins also produced one of the most exciting pitching prospects at the time in Francisco Liriano. Liriano’s career was marred by injuries, which led to his inconsistency. Despite Johan’s departure and Liriano’s ineffectiveness, the Twins’ pitching was still an effective unit. The Twins raised their pitchers not on the attractive strikeouts, but on “pitching to contact.” The premise behind this was that pitchers would attack the lower half of the strike zone, induce weak contact, and show excellent control to give up few walks. It seemed to work, as pitchers with low to average strikeout rates were able to be effective pitchers, such as Scott Baker, Nick Blackburn, Kevin Slowey, and Brian Duensing.

Before I delve into my research, I should point to Voros McCracken’s ideas about Defense Independent Pitching for those less sabermetrically inclined (if you are sabermetrically inclined, feel free to skip the next few paragraphs). If I were to give a brief summary of his work, I would say McCracken’s main point is that if a pitcher does not give up a home run or strike out or walk a batter, then he has little control of what happens to the batted ball in play. A lot of what happens can be credited to luck, sequencing, and how good his defense is. For those unaware of sequencing, it is the idea that if a pitcher gave up three singles and a home run in an inning, there are many different possibilities of what could happen. The three singles could come in a row, followed by the dinger, for a total of four runs, or, two singles could come early, the pitcher gets a double play or some other way to get out of the jam, then gives up a home run with the bases empty, followed by another single and an out. In that scenario, only one run was surrendered, despite an equal amount of hits. McCracken suggests there is randomness in this effect, which combined with the quality of defense behind the pitcher and a good deal of luck, can make ERA a poor indicator of a pitchers true skill.

McCracken looked at defense-independent pitching stats (HR, BB, K) and defense-dependent stats (ERA), and noticed that the defense-independent stats correlate much better from year to year, and are a better indicator of how a pitcher will perform, since a pitcher does not have control of what happens to balls in play.

While McCracken did not actually create FIP, his work was a building block for modern pitching analysis. FIP (Fielding Independent Pitching) tracks what a pitcher’s stats would look like if he played behind a league-average defense and experienced league-average luck. It is a much better indicator of future performance than ERA. All the data I used was from 2007-2014. Over that span, for pitchers who pitched more than 100 innings in at least a two-year span, a pitcher’s ERA from one year to the next (tracking how consistent the stat is in tracking performance) had a correlation coefficient of 0.338. FIP, conversely, had a correlation coefficient of 0.476. Clearly, FIP performs better when predicting future performance, as McCracken suggested.

To end my digression on McCracken’s importance, if I had to sum up its importance to this article, it is that pitchers have little or no control over what happens to a ball in play.

When I was talking Twins recently with some recent, justifiably uneasy Twins fans, they attributed the Twins’ recent troubles to injuries and inconsistent pitching. This was when I was reminded of the “pitch to contact” philosophy heralded by the Twins. Since the days of recently past successes, the Twins have changed management, and hopefully have let go of this ideology. Anyways, I thought to myself that McCracken’s work and subsequent furthering of the topic do not go along with the pitch-to-contact philosophy. Sure, if a pitcher can prevent walks and home runs, then it does go along with part of McCracken’s ideas. But, if the goal is to induce weak contact, yet the pitcher does not have control of what happens to a ball when it is contacted, then there is a bit of a discrepancy.

So, like any other statistically-oriented college mind looking for how to spend the rainy days of my summer break, I decided to run some regressions to test if “pitch to contact” actually succeeded and the Twins were able to induce weak contact, or if the relative success of the pitching staff is related to luck and a good defense.

To reiterate, the data I looked at came from the seasons of 2007-2014. To sum up the Twins’ pitching through the period, the period starts with solid pitching from guys who lack the ability to post high strikeout rates, excluding the one season Santana pitched in the study. Guys like Scott Baker and Nick Blackburn had solid seasons early on, but Blackburn and many others faded once things went downhill for the team. From the outside looking in, it may seem like a chicken-or-the-egg scenario, whether it was pitching that caused the downfall or some other factor that caused the pitching to fail.

I gathered data for Twins pitching over this span, and compared it to the rest of the league. The pitch-to-contact philosophy was easily visible, as over this eight-year span, only five Twins pitchers had higher strikeouts per nine innings than league average (Johan Santana, Phil Hughes, Scott Baker, Francsico Liriano, Kevin Slowey). At the same time, only four pitchers had a walks per nine innings above league average (Nick Blackburn, Boof Bonser, Sam Deduno, and Liriano), and most of those seasons came in that pitcher’s last season with the team. The data shows that despite few strikeouts, Twins pitchers found some success in limiting numbers of walks. However, for those pitchers who struggled with control, their combined ERA in those seasons was 4.82, with a FIP of 4.60. Clearly, if a pitcher struggled with control, their success was hindered by the high walk rate.

Much of the Twins’ pitching was inconsistent over this time as well, as pitchers such like Blackburn or Brian Duensing seemingly went from quality starters to below-average pitchers. For the most part, I found this to be a team-wide theme. For pitchers with multiple years with the club, I correlated year-by-year ERA and FIP, to see if any consistent trends arose. Amazingly, there was no correlation from ERA from one year to the next, as the R-squared value was 0.002, stressing no relationship at all (graph). FIP, on the other hand, showed an R-squared value of 0.15; so while not a concrete relationship, a weak relationship exists (graph).

Why this lack of consistent ERA and FIP? This is where I think BABIP comes into play. Since FIP does not take into account BABIP, it did produce more reliable data. A few outliers threw off the data, and since it is not a large sample size, those outliers did affect correlation. By the nature of the relationship, this probably did more to affect the FIP correlation than the ERA, but nonetheless, the small sample size of pitchers from this period did affect the relationship. Interestingly, but perhaps not surprisingly, I performed a regression graphing FIP to ERA, and a solid relationship exists, with an R-squared of 0.36 (graph). This would be even better of a correlation if I took out seasons by Phil Hughes and Liriano, as in those two seasons their FIP was almost a full point lower than their ERA, respectively. This shows the validity of FIP as a metric, as it accurately predicts how a pitcher likely will perform based on independent factors.

Nonetheless, there is a clear difference here in the two pitching metrics. FIP implies a relationship, while ERA does not. How can this be? My theory is that it has to do with the pitch-to-contact philosophy. If pitchers are constantly relying on luck and defense to produce outs, rather than getting batters out themselves, then random variation will play much greater of a role in a pitcher’s effectiveness. Additionally, a team’s defense will play much greater of a role in pitching.

How much can a defense affect pitching? Well, I graphed the total WAR produced by the various Twins defenses against the team ERA from the 2007-2014 seasons. I additionally graphed BABIP against team defense. Amazingly, an ERA to defense regression produces an R-squared of 0.47 (graph), while a Defense to BABIP regression produces a 0.37 R-squared value (graph). Team defense clearly has a relationship with team ERA and team BABIP, as when the Twins defense was in its prime (2007, 2010), pitching performed well. Similarly, in the defense’s worst two seasons, the team also had its highest BABIP (2013, 2014). For those wondering, FIP to team defense produces no correlation (as we expect, since it does not account for a team’s defense) with an R-squared of 0.003.

What does this all mean?

Putting it all together, we notice a few trends. After 2010, the defense took significant steps back, along with pitching (ERA). As we expect, the team’s BABIP was affected by the defense’s regression. FIP, on the other hand, remained fairly constant through the span, showing how the defense must play a role in team ERA. For example, we will look at 2014. This was the defense’s worst year in the span, with a defensive WAR of -46.5. Team ERA was second-worst in this year, at 4.58. FIP, conversely, showed the team had its second-best year in pitching, with a value of 3.97. This shows that if the Twins would have had an average defense, their ERA would have been much lower.

As team ERA ballooned, the quality of the Twins’ defense fell. Since Twins pitchers were taught to rely on their defense through the pitch-to-contact ideology, this relationship was amplified. Pitching to contact, although relying on luck and defense, may have had some merit when the Twins’ defense was in its prime. If the team could get to more balls, produce a few more outs, then as long as the pitchers kept batters from getting on for free via the walk, the team would succeed. The pitcher would not need to strike out as many batters since the defense would make more outs than the normal team. This sounds nice on paper, but as the team defense decayed, the pitching regressed. This is most evident in 2014, as a solid pitching staff was marred by the defense behind them.

If the Twins were to truly focus on pitching to contact, then they should have looked at the defense, not the pitcher. At the same time, pitching to contact is flawed in a way. Why should a pitcher rely on a defense if he can just get the batter out himself? Teaching a pitcher not to use his natural talent to strike out a batter is counter-productive. I am not saying the Twins’ coaching staff directly did this, but when only four pitchers in an eight-year span have above-average strikeout rates, it raises the question. Perhaps the Twins looked for pitchers who were undervalued because of their low strikeout rates, and used these undervalued pitchers in their pitch-to-contact system. Yet, this does not seem to be the case, as the Twins pitchers with the lowest ERAs and FIPs were the pitchers with the highest strikeout rate, excluding Brian Duensing, whose downfall could have been predicted by his 3.82 FIP (to a degree), as it showed is 2.62 ERA would be much closer to 4.00 with an average defense. Even in a pitch-to-contact system, the pitchers with the best ability to get the batter out without putting the ball in play were the best pitchers.

If pitching to contact were to have a textbook year, it would be 2007, where a team with a 4.37 FIP had an ERA of 4.18. Yet, soon after, the defense plummeted, bringing the team pitching down with it. Clearly, through the team’s porous defense, the Twins gave up on pitching to contact, too. They just hadn’t realized it yet.

Hopefully, with the new management in place, pitching to contact is forgotten. While it is also important to keep a viable defense behind the pitcher, I still can’t trust the pitch-to-contact ideology. It had a good run, but seriously, when was the last time the Twins were able to produce a consistent pitcher out of a highly-praised prospect? Liriano wasn’t consistent, Kyle Gibson has yet to dominate, and Jose Berrios has looked shaky is his brief appearances. I think Scott Baker might be the answer to my question, but if not him, then maybe Johan Santana?

Clearly, the Twins need a new philosophy for grooming pitching. It’s a team riddled with questions, and this is not the lone answer, but it can be one step in the right direction for the team currently pegged at the bottom of the AL barrel.


David Price Is About to Go Off

View post on imgur.com

On June 25, this was David Price’s tweet to family, friends and fans.  It was a clear signal that he knew the patience of the Boston fans and media was wearing thin.

Fast forward to the All-Star break and his “Made for TV” stats (those that casual fans know best) are underwhelming: a 9-6 record with a 4.34 ERA, which is worse than the MLB average of 4.23.  It’s not so much his ERA that’s the problem to fans, but more his inability to be consistent from start to start.  Price has three starts of six-plus innings allowing two or fewer runs, but also has four starts of allowing six or more runs.  With the rest of the rotation producing an atrocious 4.86 ERA, the Sox desperately needed Price to be the one to stop the bleeding, something he hasn’t been able to do.  But that doesn’t mean his underlying skills have deteriorated and all of a sudden he’s become a league-average pitcher.  In fact, the advanced metrics say he’s been extremely unlucky and that he’s due for a big second half. 

View post on imgur.com

* Rank is solely being used to establish a baseline for Price as a top 10 pitcher.

In 2014 and 2015 combined, Price was ranked in the top 10 of all pitchers in four of the skill-based statistics: K%, BB%, xFIP and SIERA (the latter two being ERA estimators with a weighting towards more pitcher-controlled outcomes).  Through the 2016 All-Star break, Price has maintained or improved his top-10 rank in K%, xFIP and SIERA but dropped a few spots in walk rate.  Despite the move from 9th to 10th in K% rank, his K rate is actually up from 26.2% to 27.1%.  The reason for the drop in rank is that 2016 newcomers to the list Jose Fernandez, Noah Syndergaard and Drew Pomeranz did not meet the minimum innings qualifier for the 2014/2015 combined list.  On the flip side, Price’s xFIP and SIERA are higher than they were the past two years, but he has improved his ranking versus his peers.  This is because xFIPs and SIERAs are both up 10% league-wide versus last year (due to all the home runs being hit) while Price’s increases are smaller.

So what is happening?  If his base skills are fine, why is his ERA so high and his performance so inconsistent?

View post on imgur.com

So everyone is familiar with ERA and can easily infer that 4.34 is no bueno for a $217-million pitcher.  But there is a reason these stats are labeled “Non Skill-Based” — that’s because these stats are influenced by factors outside of the pitcher’s direct control (defense, luck, sequencing, variance, etc…) and therefore have wide variability over small samples.  Three of these stats (HR/FB%, BABIP and LOB%) explain why David Price is a great rebound candidate for the second half.

HR/FB%

Price’s current HR/FB (home runs per fly ball) rate is 15.2% — which is good for being ranked 76th out of 97 qualified starting pitchers.  The past two years combined he ranked 19th.  To put this in context, Price’s career average is 9.4% while the 2016 league average is 12.9%.  Price has never recorded a full season (>150 IP) HR/FB rate higher than 10.5%.  Also, on balls hit into play against Price this year, 31.3% of them are fly balls, the second-lowest rate of his career.  The only season in which he allowed a lower fly ball rate was in 2012 when he won the AL Cy Young award.  Price is giving up fewer fly balls this year, but of the fly balls he is allowing, they are going over the fence at the highest rate of his career.  Those that remember Price giving up a HR in 10 consecutive starts this year are nodding violently right now.  His HR/FB% will regress towards his career norm (9.4%) and this should be the main reason for a big second half.

BABIP

Price is also suffering from an unsustainable BABIP (batting average on balls in play).  His current mark of .321 is well above his career rate (.289) and even above his highest full-season rate (.306).  Once a ball is put into play it is out of the pitcher’s control what happens from there.  This is why defense and luck influence this stat more than skill.  And with that said, statistical outliers here tend to regress towards career norms.  Even though Price is allowing ground balls at a higher rate than the past two years, his 2016 GB% is still lower than his career average.  BABIP can be influenced by the number of ground balls a pitcher allows, but he’s not allowing vastly more than his career average.  His BABIP should have some positive regression in it, which is another predictor of improved second-half performance.

LOB%

Price’s Left-On-Base% (percentage of runners a pitcher strands over the course of a season) is currently 70.9%, which is also below his career rate (74.7%) and would be his second worst full-season rate (70.0%) if the season ended today.  Similar to HR/FB%, he is ranked 73rd out of 97 qualified starting pitchers.  The past two years he ranked 22nd.  A pitcher with a higher than average strikeout rate should be able to sustain a slightly higher than average LOB%, but it’s playing out the exact opposite way for Price.  This is partly due to his inflated BABIP and HR/FB%; as these statistics continue to regress towards his career norms, the LOB% will creep up to expected levels.


Much has been made of Price’s velocity being down this year compared to any point in his career.  At the start of the season, his velocity was over 2.0 MPH lower than his career average (94.1).  He has since closed this gap almost entirely.  Here is his average fastball velocity by month (with number of starts):

April: 92.0 (5)

May: 92.5 (6)

June: 92.9 (6)

July: 94.0 (2)

If this upward trend in velocity stabilizes somewhere at or above 93.5, then nearly all the performance metrics within his control — velocity, K%, BB%, xFIP and SIERA — will be at or near his career norms.

Let’s dive a little deeper into that early-season velocity issue.  Below are two charts.  The first shows combined performance of 2014 and 2015 for ERA-qualifying starters while the second chart is the same data for the 2016 season through the All-Star break.  The orange circle is David Price.  The red circle (if shown) represents Price’s career average.  The blue circles are a hand selected peer group of the top 10 pitchers in the game (Kershaw, Sale, Arrieta, Scherzer, Bumgarner, Greinke, Strasburg, Syndergaard, Salazar and Fernandez).  Remember those rankings where Price was right around the top 10 — these are the guys usually outperforming him.  The gray circles represent everyone else.  Note: For these first two charts the top-right quadrant is Good, and the bottom-left quadrant is Bad (unless you’re a knuckleballer).

2014-2015 K/9 vs FBv

View post on imgur.com


2016 K/9 vs FBv

View post on imgur.com

The first graph shows David Price clustered where you would expect him — right at the middle-to-bottom of his top-10 peer group, with a healthy average fastball velocity and K/9.  The second graph (2016) shows Price in a similar relationship to his peers, but with slightly lower velocity and a higher K/9.  Note the gap between the orange (Price’s 2016) and red (Price’s career average) dots depicting his improved strikeout numbers this year despite the slightly lower velocity.  This graph also shows what freaks Noah Syndergaard, Jose Fernandez and (to a lesser degree) Jered Weaver are.

The final two graphs show the relationship between ERA and xFIP where xFIP is the more predictive estimator of a pitcher’s skill.  The bottom-left quadrant is Good (think Kershaw) and the upper-right quadrant is Bad (think Buchholz).  Anyone in the upper-left quadrant (Price in 2016) is a candidate for positive regression.

2014-2015 ERA vs xFIP

View post on imgur.com


2016 ERA vs xFIP

View post on imgur.com

The first graph again shows Price in his usual place — at the tail end of the top 10.  In 2014 and 2015 combined he had a very similar ERA (2.88) and xFIP (2.98).  The second graph (2016) shows the disparity between his ERA (4.34) and xFIP (3.16).  Pitchers with this large of a gap between ERA and xFIP are great candidates for regression.  The important takeaway is that his xFIP, relative to his peers, has stayed in that top-10 range.  This supports the point that some bad luck is the main element depressing his ERA.

David Price can easily be the best pitcher in the American League over the next two and a half months.  He already owns the lowest xFIP in the AL at 3.16 — the next-closest is Corey Kluber, at 3.34.  The skills above show he can sustain the xFIP level, but with some change in luck and maintaining his improved velocity, he doesn’t need to “pitch better”; he just needs to keep pitching — and the results will follow.


The Improvement of the Indians Starting Rotation

Remember at the end of last season and before this season when we all foresaw an Indians rotation that could possibly feature somewhere between 2 and 5 really good, and possibly great, starting pitchers?  Don’t get bogged down on the slight exaggeration of that 1st sentence – To recap what we were looking at coming into this season for the Indians’ rotation:  Corey Kluber won the 2014 AL Cy-Young; Carlos Carrasco had a string of starts to end 2014 in which he seemingly (finally) figured out how to harness all of his powers in a bid to ascend his name to an echelon where only Clayton Kershaw’s name resides; Danny Salazar has always had elite swing and miss stuff and was also excellent in the second half of 2014;  Trevor Bauer and his Costco-sized arsenal of pitches have made some of us incredulously, if not warily optimistic since he was taken 3rd overall in 2011; and even T.J. House made us pause and take notice with his strong second half of 2014.

Then, like hype men with a special blend of Cleveland Kool-Aid being intravenously administered, Eno Sarris and Daniel Schwartz posted one of my favorite FanGraphs articles ever, Pitch Arsenal Score Part Deux, and the anticipation over the Indians’ rotation pulsated like a vein in the neck of John Rambo in the midst of fleeing from man-hunters.

The supporting cast, the lineup, looked poised to support the staff with plenty of runs.  Returning would be: break out star Michael Brantley; bounce-back candidate Jason Kipnis; now-full-time-first-basemen, Carlos Santana; a supposedly healthy Michael Bourn; an offense-first but totally-respectable-defensively, Yan Gomes; and an actually-not-that-horrible-in-2014, Lonnie Chisenhall.  Slugger Brandon Moss, and contact-happy-supposedly-glove-first Jose Ramirez had secured full-time spots as well in RF and SS respectively.  So even though it wasn’t without flaws, it seemed like they would allow the pitchers to rack up plenty of fantasy-relevant wins.

Note: This post isn’t about the disappointment of the Indians, though they have been disappointing; it’s more about what factors beyond luck have contributed to the numbers of the Indians’ starting rotation at various points throughout the year, and the disparity (big or small) between the pitchers’ rates and predictors at those points.

The Indians’ starting pitchers, or at least the top 4 (Kluber, Carrasco, Salazar, and Bauer) have, for the most part, been putting up good, albeit, inconsistent numbers all year despite posting some elite peripheral rates and ERA indicators.  A number of reasons have caused these numbers to grow apart (bad), come together, and then grow apart again (good).  Luck can work like a bit of a pendulum, swinging from one extreme, through the middle, and to the other extreme before evening out and that is at the core of what the Indians’ starting pitchers have experienced this year — although they have yet to experience the final stabilization phase.

We will examine plenty of numbers (Beginning of season to August 18th) based on this time frame: (Spoiler alert – this article is long and dense, and this timeline serves as a sort of cliff notes as to how the staff’s numbers have improved throughout the year – so if you’re the type of person who feels like looking at a bunch of data is superfluous when the bullet points are in front of your eyes, just read the timeline and be done with it.)

timeline

April 6th – May 23rd/May 24th – June 15th

One week into the season, before it was evident that the team’s defense was very sub-par, Yan Gomes hurt his knee and hit the disabled list for over a month.  Roberto Perez filled in quite nicely, and looking at just a couple numbers, could be considered the more valuable catcher (1.4 WAR compared to 0.5 WAR for Gomes).  Brett Hayes (0.0 WAR) was called up and was the secondary catcher during this period.  Behold, a table from StatCorner:

statcorner


Perez has had the least amount of pitches in the zone called balls and the most amounts of pitches out of the zone called strikes.  Overall, despite receiving fewer pitches than Gomes, he has saved more runs (4 DRS to Gomes’ 1) and their caught stealing rates are basically identical with a slight edge going to Perez – 38% to Gomes’ 35%.  Gomes was much better in terms of framing in 2014, and it’s possible the knee injury has limited his skills all around this season.  Anyways, from April 6th – May 23rd, the combined stats of Kluber, Salazar, Carrasco, and Bauer look like this:

ERA FIP xFIP SIERA K-BB% GB%
Kluber 3.49 2.16 2.46 2.51 25.3 48.6
Salazar 3.50 3.27 2.46 2.30 28.7 43.8
Carrasco 4.74 2.60 2.67 2.82 22.3 48.9
Bauer 3.13 3.23 4.09 3.94 14.2 35.7
3.75 22.7 44.7

Gomes returned as the primary catcher on 05/24, and from that point through June 15th, the cumulative numbers aren’t too different, although there is a dip in both K-BB% and GB% that we’ll have to look into.

ERA FIP xFIP SIERA K-BB% GB%
Kluber 3.67 3.26 3.20 3.19 19.8 43.8
Salazar 3.60 3.72 3.36 3.43 17.3 47.7
Carrasco 3.65 2.83 3.29 3.17 20.2 44.1
Bauer 3.96 4.72 4.47 4.30 11.5 36.8
3.74 17.2 43.1

So despite lower K-BB and ground ball percentages (leading to higher ERA predictors), the group’s ERA in the segment of the season when Gomes was reinstated is essentially exactly the same as from the first block of time with Perez.  Now, I am not a big believer in CERA because there is a high level of variation and too many unknown variables pertaining to how much of the responsibility/credit goes to the catcher, the coaching staff, or the pitcher; but I do think that it’s possible Gomes’ extra service time has enabled him to be more in tune with his staff as well as understand hitter tendencies better than Perez and Hayes.  I realize we’re getting into a gray area of intangibles, so I’ll reel it in with some results based on pitch usage%.

% Difference in Pitch Usage with Yan Gomes compared to Roberto Perez

Pitcher FB% CT% SL% CB% CH% SF%
Corey Kluber -9.0 8.8 -17.3 5.0
Danny Salazar 9.8 -12.6 -4.4 17.1
Carlos Carrasco -6.5 9.4 49.2 13.3
Trevor Bauer -2.9 -15.0 -8.9 78.5 25.8

Using BrooksBaseball Pitch f/x data, let’s painstakingly find out how different each pitcher’s pitch usage was in regards to different counts, or better known as Pitch Sequencing.  We’ll look at first pitches, batter ahead counts, even counts, pitcher ahead counts, and 2 strike count situations.  As good as pitch f/x is, the data still isn’t perfect.  There may be discrepancies if you look at usage at Brooks compared to the usage at FanGraphs, so for each pitcher we’ll split the pitches up into three categories: Fastballs (four-seam, sinkers, cutters), Breaking Balls (sliders, curve balls), and Change Ups (straight change/split finger) – I’m aware that splitters are “split fingered fastballs”, but I liken them to change ups more because of the decreased spin rate and generally lower velocity.

*Having a table for each pitcher in regards to pitch sequencing made this article quite messy, so I’ve included a downloadable Excel file, and briefly touched on each pitcher below.

Pitch Sequencing Excel Doc.

Corey Kluber

Looking at the data, Gomes stays hard with Kluber more than Perez until they get ahead in the count.  Perez swaps some early count fastballs for curve balls, but they both see his curve ball as a put-away pitch.  Gomes tends to trust Kluber’s change-up more than Perez later in counts and Perez likes it more earlier in counts.

Danny Salazar

Much like with KIuber, when Gomes catches Salazar, they have a tendency to stay hard early.  Gomes pulls out Salazar’s wipe out change up after they’re ahead whereas Perez will utilize it in hitter’s counts as well.

Carlos Carrasco

Carrasco has 5 good pitches and he’s pretty adept at throwing them for strikes in various counts which is why there is some pretty even usage across the board, at least in comparison to Kluber and Salazar.  There is quite a bit more usage of Carrasco’s secondary pitches in all counts and there are pretty similar patterns when Gomes and Perez are behind the plate.  With Hayes, it doesn’t look like there is much that changes in sequencing until there are two strikes on a hitter.

Trevor Bauer

Bauer is probably a difficult pitcher to catch because of the number of pitches he has and the constant tinkering in his game.  Side note: Gomes is the only catcher to have caught a game in which Bauer threw cutters, and in their last game together, Bauer threw absolutely no change-ups or splits.  Bauer’s highest level of success has come with Hayes behind the plate and perhaps that’s from their willingness to expand his repertoire in more counts than Gomes and Perez do, but there is no way I can be certain of that.

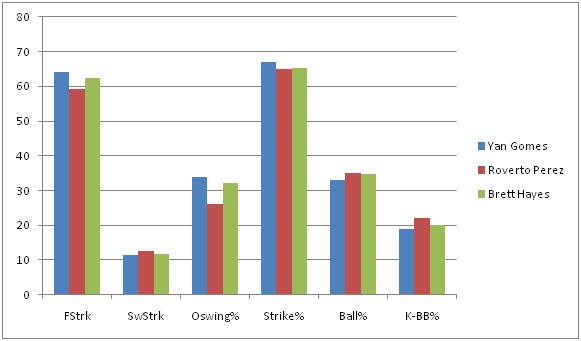
Pitch sequencing can effect the perceived quality of each pitch and therefore, can produce more favorable counts as well as induce higher O-Swing and SwStrk percentages (or less favorable and lower).  So despite the framing metrics favoring Perez, the group throws more strikes with Gomes and also induces more swings at pitches outside the zone – although, as previously noted, there is some regression with Gomes behind the dish in terms of SwStrk% and K-BB%.

swing tendencies


aaa0ide


**These graphs represent numbers through the entire season to garner a bigger sample size.

With lower line drive rates and more medium + soft contact, and (in the case of the Indian’s defense), more fly balls, a conclusion could be jumped to that the staff’s BABIP has trended downward since Gomes regained his role.  A look at BABIP throughout the course of the season:

babip


Woah!  It was well above league average in April and then plateaued at just above league average through mid June, but has been plummeting ever since.  Obviously a catcher is not responsible for this dramatic of a swing in BABIP, so the Indians’ defense must have improved.

June 16th – August 18th

The rotations’ traditional stats look even better if you use June 16th as the starting point:

Pitcher IP H K BB W ERA WHIP
Corey Kluber 84 61 82 16 5 3.11 0.92
Danny Salazar 71 46 69 23 5 2.79 0.97
Carlos Carrasco 77.1 56 77 13 3 2.91 0.89
Trevor Bauer 68.1 69 63 24 4 5.80 1.37
300.2 232 291 76 17 3.59 1.03


So let’s take a look at the Indians’ defensive alignment by month (Player listed is the player who received the most innings played at the position).


POS April May June 1 – 8 June 9 – 15 June 16 – 30 July August
C Perez Perez Gomes Gomes Gomes Gomes Gomes
1B Santana Santana Santana Santana Santana Santana Santana
2B Kipnis Kipnis Kipnis Kipnis Kipnis Kipnis Ramirez
3B Chisenhall Chisenhall Chisenhall Urshela Urshela Urshela Urshela
SS Ramirez Ramirez Aviles Aviles Lindor Lindor Lindor
LF Brantley Brantley Brantley Brantley Brantley Brantley Brantley
CF Bourn Bourn Bourn Bourn Bourn Bourn Almonte
RF Moss Moss Moss Moss Moss Moss Chisenhall

If you’ve paid attention to the Indians at all, you know they’ve made some trades and called up a couple prospects.  But just how different is the new defense?  Well, we only have a small sample with the current configuration, but it appears to be A LOT better. If BABIP wasn’t enough of an indicator, and it’s not, because there has to be some regression to the mean – it can’t stay that low – here are some numbers from the players who were playing the most in May compared to the players who are playing the most in August (again, numbers represent full-season stats):


MAY PLAYER FLD% rSB CS% DRS RngR Arm UZR UZR/150
C Perez .994 2.0 38.5 4
1B Santana .997 -6 0.0 0.7 1.2
2B Kipnis .988 4 4.5 3.6 7.0
3B Chisenhall .963 7 3.1 3.3 10.5
SS Ramirez .948 -2 -2.4 -5.2 -21.9
LF Brantley .992 1 0.3 -2.1 -1.4 -3.3
CF Bourn 1.000 4 -7.2 1.1 -5.8 -11.4
RF Moss .975 -4 1.7 -2.5 -1.1 -1.8
AUG PLAYER FLD% rSB CS% DRS RngR Arm UZR UZR/150
C Gomes .996 0.0 35.0 1
1B Santana .997 -6 0.0 0.7 1.2
2B Ramirez 1.000 1 1.1 2.8 23.2
3B Ursehla .973 2 4.5 6.0 15.7
SS Lindor .967 6 6.0 4.9 14.9
LF Brantley .992 1 0.3 -2.1 -1.4 -3.3
CF Almonte 1.000 2 0.4 -0.2 0.9 10.0
RF Chisenhall 1.000 4 1.6 0.5 2.3 27.3

What’s interesting is that the biggest difference in the infield is Francisco Lindor (Giovanny Urshela has been very solid, but Chisenhall was pretty similar this season at 3B).  I’m sure someone at FanGraphs could churn out a really cool article (if someone hasn’t already) that shows us a quantifiable difference an above average to well above average shortstop makes for a team even if you just keep the rest of the infield the same, as the control.  The 2015 Tigers come to mind – a healthy Jose Iglesias has made a difference for a team that still features Nick Castellanos at 3B and Miguel Cabrera at 1B.  Teams are willing to sacrifice offensive contributions if a SS has elite defensive skills (Pete Kozma, Andrelton Simmons, Zack Cozart to name a couple off the top of my head).  Lindor, to this point, has been an above average offensive player, too, so this could be special.

At this point the Indians are in last place and are out of contention.  Abraham Almonte is their starting center fielder and with Kipnis back from the DL, Jose Ramirez is not playing 2B, but is instead getting reps in left field while Michael Brantley DHs due to his ailing shoulder.  Perhaps all this means is that they don’t have better replacements; OR PERHAPS they’re planning to establish a more defense-oriented squad next year…

Now there’s no doubt that this research has led to some frustrating conclusions.  With Gomes behind the plate, the K rate and GB rate of the staff has trended in the wrong direction in regards to ERA indicators; so is the difference in the batted ball profile plus an improved defense enough to make up for these facts?  This small sample size thinks so, but it could 100% just be noise.  However, there are clubs that are succeeding by using similar tactics right now:

Team ERA FIP ERA-FIP GB% (rank) SOFT% (rank) OSWING% K-BB% (rank)
Royals 3.57 3.93 -0.36 42.1 (29th) 18.1 (16th) 30.9 (19th) 10.5 (26th)
Rays 3.63 3.79 -0.16 42.4 (28th) 18.7 (13th) 31.2 (17th) 14.8 (7th)
Indians (as a reference) 3.85 3.65 0.20 44.7 (17th) 18.2 (15th) 33.3 (2nd) 16.9 (1st)

Granted, the Royals and Rays have the 1st and 2nd best defenses in baseball, and their home parks play differently than the Indians, but they also don’t boast the arms the Indians do.

The Indians have their noses deep in advanced metrics and having rid themselves of Swisher, Bourn, and Moss during 2015’s trading period has allowed them to deploy a better defensive unit which has amplified their biggest strength – their starting pitching.  Furthermore, their unwillingness to move any of their top 4 starting pitchers also leads me to believe they see next year as a time for them to compete.  I’m not going to speculate what moves the Indians will make in the offseason, but I hope they stick with this defense-oriented situation they have gone with recently because it’s been working (and because I own a lot of shares of Kluber, Carrasco, and Salazar in fantasy).


A Case For Wei-Yin Chen Ownership

I’m not going to tell you anything you can’t find out for yourself.  This is just a little research on Mr. Chen.  Alternative title would’ve been Chen Music, but I couldn’t find proof of an increase in high and inside fastballs.  Anyways:

Wei-Yin Chen’s surface level numbers have been great this year:

18 GS,   2.86 ERA,   1.12 WHIP,   93 K/116.1 IP

The thing is, he’s been just as good dating back to Jul 1st of 2014:

33 GS,   2.88 ERA,   1.14 WHIP,   164 K/209.2 IP

His peripherals over that time have declared him lucky and say that this success in unsustainable.  His FIP, xFIP, and SIERA for each half have been quite different from the ERAs he’s put up.


FIP xFIP SIERA ERA
JUL – SEPT 2014 3.37 3.68 3.79 2.89
APR – JUL 2015 4.09 3.85 3.78 2.86


Look, I get it, he doesn’t strike out even 20% of the batters he faces and he can struggle with the long ball.  But the Orioles’ defense is ranked 3rd in the league by UZR, and 3rd by UZR/150.  Ahead of the Orioles are the Rays and the Royals.  Each of these teams are outperforming their ERA indicators by a decent amount.

FIP xFIP SIERA ERA
Royals 3.80 4.09 4.03 3.54
Rays 3.86 3.81 3.66 3.59
Orioles 4.01 3.91 3.76 3.73


This does not mean that every pitcher on each of these teams is outperforming their peripherals but it’s obvious (and not because of that table) that defense helps pitchers’ numbers.  I also understand that Camden Yards is a little bit more of a hitters’ park than Kauffman and Tropicana, but that shows up in Chen’s numbers as he has surrendered HR at the rate of 1.29/9 IP at home and 0.89/9 IP on the road (July 3rd 2014 – present).  To be fair, I don’t know if 112 IP and 97.2 IP (home and away, respectively) are large enough sample sizes compared to his full body of work to be worth anything, but let’s say they are, and let’s see what Chen has done differently over his last 209.2 IP compared to his first 422 big league innings.


K% BB% K-BB% GB FB LD PU HF/FB SOFT MED HARD
209.2 19.2 5.2 14.1 40.3 39.5 20.2 10.5 10.1 20.6 53.0 26.5
422 18.2 6.3 11.9 37.2 40.7 22.1 11.1 11.5 14.9 54.2 30.9
DIFF 1.0 -1.1 2.2 3.1 -1.2 -1.9 -0.6 -1.4 5.7 -1.2 -4.4

(209.2 denotes the last 209.2. IP by Chen, spanning from July 3rd, 2014 to his last start against the Yankees, and the 422 is the 422 IP prior to July 3rd of last season, which encompasses the rest of his career)

Even though his ground ball rate doesn’t lead to much confidence in terms of sustainability in that soft contact management, he still is inducing pop-ups at an above-average rate.  So whether it’s a change in sequencing or it’s just as easy as working ahead in more counts, there has been some variation in his pitch usage…another table.

FB SL CB CH
203.1 66.4 17.5 6.2 9.9
422 65.8 13.6 7.4 13.1
DIFF 0.6 3.9 -1.2 -3.2


Obviously he’s traded some curveballs and change-ups for sliders.  His fastball has become increasingly more valuable in 2015 at 8.9 runs above average, compared to 3.3 runs above average from 2014 which was his previous high.

The last thing he’s done better is pound the zone early in counts which has led to a slight decrease in batters’ plate discipline against him.

F-STRK SWING OSWING ZSWING CONTACT SWSTRK
203.1 65.1 50.8 33.3 69.4 82.2 8.9
422 59.0 49.1 30.3 68.8 82.9 8.3
DIFF 6.1 1.7 3.0 0.6 -0.7 0.6


(Almost) Everywhere you want to see improvement there is improvement even if you have to look through a magnifying glass.  Granted, this could be Chen adjusting to the league and now the league will adjust to him.  It would be perfect for him to just cleanly split from the success he’s been having after the all star break and after this piece.

In conclusion, it’s hard to know what to make of Chen as a fantasy option in the long term because he is experiencing a deflated BABIP and a higher LOB% than he has in the past.  Is it all about the luck??  I’m not too bullish on him; the tweaks he has made, while they have led to some slightly positive results, do not warrant picking him up in a dynasty league, but if you’re behind in starts or innings Chen seems to be a solid option for QS/ERA/WHIP this season if he can thwart off the regression monster.  After all that, I did not recommend him in his start against the Yankees and their .325 wOBA (results on that game were meh – it was a QS, but he gave up 10 H in 6.1 IP, 3 ER, and struck out 3) but he’s at Tampa (94 wRC+) after that.  Projecting ahead, he’d face the Tigers (113 wRC+ which is best in the majors, but they could be selling some pieces and they will still be without Miguel Cabrera), and the Athletics (99 wRC+)who are also sellers.  After that it’s likely the Mariners and their 92 wRC+; I’d take that 4 start stretch.  Something to scratch your Chen about.


Ottoneu Tools: Advanced Standings Part Two

In early May I introduced Ottoneu players to the Advanced Standings Dashboard, a tool that allows team owners to decipher the early season standings in an effort to better gauge where their team might be headed as the 2014 season comes together. You can download that tool here (http://goo.gl/pbXI5), but now that we’ve just entered July, the traditional halfway point of the baseball season, it’s time to take a deeper look at a few ways this tool can be used to effectively to manage your team into contention in the second half.

Since the tool can be updated easily with just a couple of copy/paste actions, I use this tool almost daily in my own FGPoints Ottoneu league.  But for fun, let’s walk through a few features as they apply to the FanGraphs Staff League, with a special focus on Eno Sarris’ team, “It’s A Perm“.

Eno enters July as a 3rd place team, nearly 400 points out of 1st place, and 150 out of 2nd.  In general, with at least seven teams over the 8,000 point mark, this league looks competitive at a glance.  But with the recent pickup of Ryan Braun, Eno clearly has his sights set on a title (https://twitter.com/enosarris/status/483016142831644672), so let’s break down the standings using the tool to see if Eno has the momentum to win it all in the 2nd half.

The first tab of the tool is simply the statistical breakdown of the Ottoneu standings into some common sabermetric calculations.  While we can easily see Eno leads the league offensively at 5.44 P/G, the underlying statistics also support it, showing he maintains an (slight) advantage in OPS, OPS+, wOBA, Runs Created, and Total Bases.  What may be more interesting is that Eno has more points scored from his offense than any other team in the league.  In fact, just over 58% of his points have come from his hitters (tab 3, ‘Projected Finish”). With roughly 55% of league scoring in Ottoneu coming from offense, Eno is clearly banking on this approach of shoring up the side of the ledger that carries the most weight.  The acquisition of Braun will only help.

So It’s A Perm is built on bats, but what about the pitching? Unfortunately, this is a weak spot, as Eno’s FIP, WHIP, and BB/9 are all higher than the two teams he’s chasing.  I’m sure he knows this instinctively as his 5.03 P/IP is below the league average of 5.13 P/IP (and further below the top 7 teams of 5.19 P/IP), but the dashboard makes it quicker and easier to point out these pitching deficiencies.  One possible area of improvement: the bullpen.  Without looking at his roster, I can tell you pretty quickly he’s probably pretty frustrated with his bullpen, which has been almost 42% less effective (“PEN” = Saves + Holds/IP) than the league leader, A Little Out of Context.  Shoring up a bullpen is often easier and cheaper than finding an ace SP mid season, so does Eno speculate on the eventual Sergio Romo replacement? Does he approach John Heyman’s Last Sirloin about shedding some of his bullpen pieces in a plea to “deal from strength”?

Once you’ve taken the time to digest some of the traditional sabermetric outputs in the Dashboard, your eyes will naturally gravitate toward the end of the first tab into the “League Projections” section, which is where the real power of the tool comes alive.  The key takeaways here are the “Otto” score and the “Pace” columns.  The Otto score can be better explained here by Chad Young (http://goo.gl/KK4Xy), while the “Pace” attempts to project the season-ending point totals for each team based up a range of factors, including current P/G and P/IP values, remaining IP and GP, and league averages in these areas.  In many leagues these are the columns that can better identify contenders from pretenders, but for the FanGraphs Staff league we see more evidence that the actual standings are, for the most part, very accurate, as Eno is also projected to end the season with the 3rd most points (18,042, or about 400 points out of 1st place).

There are a few interesting things to note here, however. First, John Heyman’s Last Sirloin actually has the third highest Otto score (13.66), but is still projected for 4th place, most likely due to his slower pace in IP (1,416 projected).  If this team can pick up the IP pace in the 2nd half with similar quality IP (5.54 P/IP), this team could make up ground quickly.  This team is clearly riding a league-best bullpen and trying to maximize its RP innings as much as possible.

Second, Ground Rule Double Helmet, despite sitting in 4th place with a strong 9,000 points, has had to overtax a very week pitching staff (4.74 P/IP) just to get there (1,577 IP projected).  The tool sees as much and projects this team to end the season in 5th place, but unless the pitching staff sees a significant improvement in the 2nd half, I’d expect this team to possibly fall even further as the season shakes out.

And that’s just the first tab…Once you get familiar with the tool, you’ll actually find the third tab, “Projected Finish” to be the most useful summary of some of these features described above, as it will give you a daily update of the projected champion for the league.  With Eno just 400 points out of both the actual and projected season-ending standings, this league is just too close to call on July 1st, but there are at least four clear contenders here, and It’s A Perm is one of them.  Will Ryan Braun help the cause? Just for fun, let’s say Braun increases Eno’s offense by just 2.00% (from 5.44 to 5.55).  Well, that could be all it takes, as that small increase moves the needle for It’s A Perm enough to overtake Johan Santa Claus by 100 points in the projected season-ending standings, and less than 200 points out from 1st place.  Of course, that’s if everything else stays the same, and, as in life, the only thing constant in baseball is change.  This will be a fun league to watch as the summer heats up, so enjoy the tool and use it where possible to get that 2% edge.