Archive for ERA

Introducing XRA: The New Results-Independent Pitching Stat

There are a multitude of ways that we can judge pitchers. Most people look at earned run average to gauge whether a pitcher has been successful, while many old school announcers will still cite a pitcher’s win-loss record. ERA is a nice, easy way of looking at how a pitcher has performed at limiting runs, but it doesn’t come close to telling the whole story. In the early 2000s, Voros McCracken created the idea of Defense Independent Pitching Stats or DIPS, which credited the pitcher only with what he could actually control. Fielding Independent Pitching was born from this theory and only took into account a pitcher’s strikeouts, walks and home runs allowed. It turns out that a pitcher’s home run rate is not terribly consistent, thus xFIP was created by Dave Studeman to normalize the home run aspect of the FIP equation by using the league home run per fly ball rate and the pitcher’s fly ball rate.

In 2015, a new metric was developed by Jonathan Judge, Harry Pavlidis and Dan Turkenkopf called Deserved Run Average or DRA. This new stat attempts to take into account every aspect that the pitcher has control over and control for everything that he does not, thus crediting the pitcher only for the runs that he actually deserves. DRA, however, is still dependent on the result of each batted ball. If the batter hits a ball deep in the gap and it rolls to the wall, the pitcher is charged with a double, but if the center fielder lays out and makes a remarkable catch, the pitcher is credited with an out. When evaluating pitchers, why should it matter whether they have a Gold Glove caliber defender behind them or not? It shouldn’t, and that’s where Expected Run Average comes in.

Expected Run Average or XRA gives pitchers credit for what they actually can control. FIP attempts to do this as well but assumes that pitchers have no control over batted balls. While the pitcher does not control how the fielders interact with the live ball, he does have an impact on the type of contact that he allows. XRA is based on a modified DIPS theory that the pitcher controls three things: whether he strikes the batter out, whether he walks the batter and the exit velocity, launch angle combination off the bat. After the ball leaves the batter’s bat, the play is out of the pitcher’s hands and should no longer have any effect on his statistics. The goal is to figure out a way to measure, independently of the defense and park, how each pitcher performs on balls in play. Since 2015, StatCast has tracked the exit velocity and launch angle of every batted ball in the majors. Each batted ball has a hit probability based on the velocity off of the bat and its trajectory. The probability for extra bases can also be determined. These batted ball probabilities have been linearly weighted for each event including strikeouts and walks to give each player’s xwOBA, which can be found on Baseball Savant. This is the perfect way to look specifically at how well a pitcher has performed on a per plate appearance basis.

Once xwOBA is found, then XRA can be calculated. The first objective is to find the pitcher’s weighted runs below average. To do this, I used the weighted runs above average formula from FanGraphs except I made it negative since fewer runs are better for pitchers.

wRBA = – ((xwOBA – League wOBA) / wOBA Scale) * TBF

For example, Max Scherzer has had a .228 xwOBA so far this season and has faced 487 batters. After finding the league wOBA and wOBA scale numbers at FanGraphs I can plug these numbers into the formula.

– ((.228 – .321) / 1.185) * 487 = 38.22

Max Scherzer has been 38.22 runs better than average so far this season, but now I need to figure out what the average pitcher would do while facing the same number of batters. To find this I need the league runs per plate appearance rate and multiply that number by the number of batters that Scherzer has faced.

League R/PA * TBF = Average Pitcher Runs
.122 * 487 = 59.41

So a league average pitcher would have been expected to surrender 59.41 runs facing the number of batters that Scherzer has so far this season. Now that we know how the average pitcher should have performed we can find the expected number of runs that Scherzer should have surrendered so far this season by subtracting his wRBA of 38.22 from the average pitcher’s runs.

Average Pitcher Runs – Weighted Runs Below Average = Expected Runs
59.41 – 38.22 = 21.19

Based on Scherzer’s xwOBA, he should have only given up 21.19 to this point in the season. If this sounds incredible it’s because this is the lowest mark of any starting pitcher though the first half of the season. Finally, XRA is found by using the RA/9 formula by multiplying the expected number of runs allowed by 9 and then dividing by innings pitched.

(9 * Expected Runs) / Innings Pitched = XRA
(9 * 21.19) / 128.33 = 1.49

Max Scherzer’s XRA of 1.49 is easily the lowest of any starter through the first half. The second best starter has been Chris Sale who has a 2.15 XRA. Of course these names are not surprising as they each started the All Star Game and are both currently the front runners for their leagues’ respective cy young award.

Here is a list of the top ten qualified pitchers:

Pitcher XRA
Max Scherzer 1.49
Chris Sale 2.15
Zack Greinke 2.26
Corey Kluber 2.33
Clayton Kershaw 2.34
Dan Straily 2.87
Lance McCullers 2.89
Chase Anderson 3.11
Luis Severino 3.17
Jeff Samardzija 3.23

And the bottom ten:

Pitcher XRA
Matt Moore 6.58
Kevin Gausman 6.47
Derek Holland 6.32
Matt Cain 6.26
Ricky Nolasco 6.26
Wade Miley 6.17
Johnny Cueto 6.10
Martin Perez 5.97
Jason Hammel 5.95
Jesse Chavez 5.84

Full First Half XRA List

It is interesting to see that three members of the Giants rotation rank in the bottom seven in all of baseball. In fact, AT&T Park is such a pitcher-friendly park that once you park adjust these numbers, Moore, Cain and Cueto become the three worst pitchers in baseball. It’s not surprising then why the Giants are having such a disappointing season.

One measure of a good stat is whether or not it matches your perception. Therefore, while it is interesting to see Dan Straily as one of the best pitchers in baseball and Johnny Cueto as one of the worst, it is much more assuring to see Max Scherzer, Chris Sale and Clayton Kershaw as some of the very best in the sport. The numbers for relievers also reveal how dominant Kenley Jansen and Craig Kimbrel have been. This is all good evidence that XRA is doing what it is supposed to do, accurately displaying how good pitchers have actually been, independent of all other factors.

Another important characteristic of a good stat is how well it correlates from year to year. While ERA is the most simple and popular way to look at pitchers, it is not very consistent. XRA is much more consistent than ERA and FIP and also compares favorably with xFIP. However, it is not as consistent as DRA. DRA controls for so many aspects of the game that it should be expected to be the most consistent. However, being the most predictive or most consistent stat is not necessarily the goal of XRA. The real goal is to show how well the pitcher actually did, and XRA seems to do this remarkably. While not being as consistent as a stat like DRA, the level of consistency is extremely encouraging and puts it right in line with the other run estimators.

XRA is a stat that takes luck, defense, and ballpark dimensions out of the equation. When evaluating a pitcher, he shouldn’t be penalized for giving up a 350-foot pop fly for a home run in Cincinnati while being rewarded for that same pop fly being caught for an easy out in Miami. With XRA, no longer will people have to quibble about BABIP, since it is results-independent and removes all luck from consideration. A ground ball with eyes will now be treated the same whether it squirts through for a single or is tracked down for an out. Pitching ability will no longer need to be measured with an eye on the level of the defense. It takes a good offense, a good pitching staff and a good defense to make a great team, and with XRA we can finally separate all of these important factions.


Are the Mets in Rebuilding Mode Once Again?

The Mets are the talk of the town…for all the wrong reasons. They currently sit at a 31-41 record and are 12 games behind the Washington Nationals in the NL East, which as of now seems to be theirs for the taking. The Mets boast one of the worst bullpens in the majors and have been plagued by injuries as well as underperformance from the bulk of their lineup. With the results of this season, many are beginning to wonder if it’s time to turn the page on this current pack of Mets players, many of whom were on the 2015 team that lost to the feisty Kansas City Royals in the World Series. I will attempt to go group by group in an effort to determine whether or not the Mets should begin a new rebuilding process, the most dreaded phrase in sports.

Starting with the outfield, Yoenis Cespedes is locked in for three more years in his current contract. It’s understandable why the Mets were looking to sign him in the offseason based on his performance in 2015 and 2016. However, injuries and poor performance have contributed to the current record that the Mets have. Cespedes still won’t lose his spot in left. Curtis Granderson, due to his age, will most likely not be re-signed, as well as Jay Bruce who, if he is not traded before the deadline, will most certainly test free agency. Juan Lagares has been injury-prone the last couple years but the one piece of good news is that Michael Conforto has seen a resurgence since coming back from Triple-A Las Vegas. Also, one of their top prospects, Brandon Nimmo, should receive regular playing time in the outfield, if not this season, then definitely in 2018.

Next, we have the infield, which has been decimated by injuries. Neil Walker and Asdrubal Cabrera have struggled through injuries (and who knows if/when David Wright will ever step on a baseball field again). Jose Reyes and Lucas Duda have mightily underperformed. The good news for the Mets is that Cabrera, Walker, and Reyes will be gone after the season, which means that the infield can get much younger. Top prospects Dominic Smith and Amed Rosario will be September call-ups and, if all goes well, can be regulars in the lineup next year. T.J. Rivera and Wilmer Flores have proven to be reliable pieces in the lineup. Despite some injuries from Flores, he has made up for it with his versatility in both the field and in the lineup, giving manager Terry Collins options to choose from. While Flores and Rivera may not be long-term solutions, they are the best options that the Mets have at the moment. As far as catching is concerned, Travis d’Arnaud is probably the Mets’ best option right now, although he has severely underperformed since being traded to them. The Mets should try to get another catcher in free agency.

Finally, the best pitching staff is a huge question mark, but also a big concern among scouts. Matt Harvey clearly no longer has any interest in remaining with the team and Noah Syndergaard, Zack Wheeler, and Steven Matz are just injuries waiting to happen. Even Jacob deGrom, who has been I believe the best starter this season, has a history of arm injuries that makes Mets front-office personnel nervous. Even Robert Gsellman and Seth Lugo are recovering from injuries sustained during this season. The bullpen has been just as bad. The bullpen so far has logged 257 innings to the tune of a 4.97 ERA. Not to mention they have not had a reliable closer since Jeurys Familia has been both suspended and injured this season, and the rest of the bullpen outside of Addison Reed and Jerry Blevins has been downright horrendous.

Overall, the Mets need to begin the next phase of the rebuilding process. With aging veterans and current players underperforming, it’s clear that the time for a championship has come and gone for this group. The Mets need to get younger and it starts with the old addition-by-subtraction technique. By dumping aging veterans with big contracts, the Mets will be able to allocate their resources and maybe pick up some pieces in free agency while simultaneously giving their top prospects playing time and allowing them to develop. As the great Cosmo Kramer once said on Seinfeld, “I think it’s time that we shut down and re-tool.”


Searching For Overvalued Pitchers

A little while ago, I created a post here about finding undervalued pitchers by looking at improvements between the first and second halves of the season. I had created a linear regression model for the predictions using data from 2002 to 2015, but when trying to use the same model to find overvalued pitchers, it didn’t exactly work as expected (I use the word “work” loosely here — in all likelihood, my predictions will fail as badly as the new Fantastic Four movie). It did find pitchers who suffered massive setbacks, but the majority of those were primarily due to increased — and probably unsustainable — home-run rates.

For example, Matt Andriese had an extremely successful first half of 2016. He put up a 2.77 ERA in 65 innings, backed up by a 2.85 FIP. But those numbers were much like my ex-girlfriend: pretty on the surface, but uglier once you get to what’s underneath. He struck out a lower percentage of batters than the average pitcher during that time while giving up more hard contact. The biggest sign, though, was his deflated home-run rate. He allowed just 0.28 home runs per nine innings, with only 3.2 percent of his fly balls going over the fence. This righted itself in the second half, where his HR/9 increased to 2.15 and his HR/FB to 17.4 percent. On the other hand, he improved his strikeout and walk rates, actually leading to a drop in his xFIP from 4.04 to 3.92 from the first half of the season to the second.

So then what should we expect from Andriese in 2017? The model I created predicts a 5.56 ERA from Andriese, leaning toward his 6.03 ERA from the second half of last season. While it’s unlikely he will allow fewer than 0.3 home runs per nine innings next year, it’s equally as unlikely that he’ll allow over 2 — after all, no qualified pitcher did so over the course of the 2016 season. Andriese’s full-season FIP of 3.78 actually closely aligned with his xFIP of 3.98, so it’s fair to guess that his home-run rates will level out and his ERA in the coming year will be in that range. That would signify an improvement from his 2016 season, rather than his decline predicted from the model.

So, instead of using the model, I took a simpler approach. Here are the players with at least 50 IP in each half of the 2016 season whose xFIP increased the most from the first half to the second:

xFIP Splits
Name First Half xFIP Second Half xFIP Increase
Tanner Roark 3.64 4.83 1.19
Drew Smyly 4.07 5.10 1.03
Hector Santiago 5.05 5.94 .89
Aaron Sanchez 3.41 4.29 .88
James Shields 4.82 5.70 .88
David Price 3.12 3.98 .86

For the purposes of this article, I’ll ignore Santiago and Shields since it’s unlikely that either of them will be relevant in 2017. That leaves four other pitchers whose skills declined dramatically over the course of the season and who you might want to avoid in your drafts.

Tanner Roark

Believe it or not, Roark’s already 30 years old. He’s actually had pretty decent success in his four years in the majors, with a 3.01 career ERA in over 573 innings. On the flip side, over that same time he has a 3.73 FIP, 3.96 xFIP and 4.06 SIERA. That’s not to say he’s a bad pitcher — just perhaps not as good as his ERA would have you believe. The same can’t be said for his second half of 2016. Despite actually bringing his ERA down from 3.01 to 2.60, his already-inflated FIP and xFIP numbers got even worse. His strikeout rate declined by 2.5 percent while his walk rate rose by about the same amount, leading to just a dismal 1.87 K/BB in the second half. His HR/9 nearly doubled as well, but not due to a substantial increase in his HR/FB rate — rather, his fly-ball rate rose from 26 to 37.6 percent, more in line with his pre-2016 career average of 33.9 percent. Why, then, was he able to continue to be successful? A .230 BABIP and a 86 percent strand rate offer an answer. Don’t expect another sub-3 ERA season from Roark — instead, look more toward his Steamer projection of 4.15.

Drew Smyly

For many last year, Smyly was a popular target. He was a high-strikeout guy who was able to limit walks and generate infield flies, prompting Mike Petriello to write this ringing endorsement for him. In his 114 1/3 innings for Tampa Bay before 2016, Smyly had maintained a 2.52 ERA and was among the best at generating strikeouts. But it all went wrong last year. As Tristan Cockcroft points out, Smyly’s season was marked by a first half of bad luck and a second half of deteriorated skills but better luck. His first-half 5.47 ERA was likely undeserved, as he continued getting strikeouts and limiting walks, but was plagued by a .313 BABIP, 63.2 percent strand rate and a 15.0 HR/FB rate, which corresponded to a 4.45 FIP and 4.07 xFIP. His ERA dropped to 4.08 in the second half, but nearly all of his peripheral stats worsened. A move to Seattle won’t fix all his problems, as Safeco Field was actually more hitter-friendly than Tropicana Field in 2016. The sky is the limit for Smyly, but there’s reason to be cautious. It’s possible he bounces back, but this could be who he is now.

Aaron Sanchez

This guy is good, don’t get me wrong. It took a while for some people to catch on, but I was always on his bandwag…all right, so I was one of the guys who didn’t buy in right away. That’s why I don’t do this for a living. Anyway, seeing his name on this list surprised me. After some digging though, it turns out that in my ignorance, I may have been onto something. In 2015, in Sanchez’s trial run as a starter, he was all right. A 3.55 ERA hid a 5.21 FIP and 4.64 xFIP before he got injured and was subsequently moved to the bullpen. When he returned on July 25, he was a completely different pitcher. This time, while he may not actually have deserved his 2.39 ERA, a 3.10 FIP and 3.33 xFIP showed he had made some kind of improvement. Or had he? After all, he only threw 26 innings in the second half of last season. And while there was undoubtedly a huge improvement for him in strikeout and walk rates, something else caught my attention. Take a look at Sanchez’s batted-ball type percentages from 2015:

Pretty clearly, Sanchez improved his batted-ball profile after becoming a reliever. His 2015 second-half ground-ball percentage of 67.6 percent would be the greatest of all of the 1281 qualified pitcher-seasons since 2002, when the statistic started being tracked. His fly-ball percentage of 18.3 percent, while not as extreme, would still rank as the ninth-lowest since 2002. That begs the question: would he be able to sustain those rates when he moved back to the rotation? The answer, as it always is with historically extreme rates, was no:

Both of his rates came crashing back to historically-accurate norms pretty much right away, and they continued to trend in the wrong direction as the season progressed. This, consequently, caused Sanchez’s xFIP to skyrocket. His strikeout and walk rates got worse from the first half of the 2016 season to the second, but only slightly. What really moved his xFIP was his fly-ball rate, which soared (pun intended — maybe I should do this for a living) from 21 percent to 31.8 percent. It’s difficult to say where Sanchez will go from here — after all, this was his first full season as a starter. If he can keep his fly-ball rate at last year’s 25.1 percent — which ranked fourth-lowest among qualified starters — he could still be a pretty decent starting pitcher, even with regression to a league-average HR/FB rate. What’d be even more impressive, though, is if he could keep his batted-ball rates at his numbers from the first half of 2016, which were among the league’s best. Perhaps with a full season under his belt, Sanchez may now have the stamina and endurance to achieve this feat. If he does, look out. If he doesn’t, you’re looking at an average guy.

David Price

Now that I’ve written nearly an entire article’s worth about one guy, let’s talk about another player from the AL East. Price, for much of his career, has been among the elite at the position. Before last season, the only time he had had an ERA above 3.50 was his first season as a starter back in 2009. Every year of his career, he’s been an above-average strikeout guy, but he topped even his own lofty standards when he struck out 27.1 percent of the batters he faced in the first half of 2016. He was unable to sustain that rate, and in the second half of the season he managed to strike out just 20.3 percent of batters, which would have been his lowest full-season rate since 2009. So what changed? Actually, it might have been the first half that was the fluke. Price allowed a 74.2 percent contact rate in the first half, contrasted with a 79.1 percent rate in the second. Those numbers don’t necessarily mean much on their own, but the difference is easy to spot when looking at his career rates:

Price’s whiff rate was higher than ever in the first half of 2016, but it’s tough to figure out why. Per Brooks Baseball, Price was generating swings and misses on his changeup at a career-best rate in the first half, but I couldn’t find any obvious changes to his velocity or movement on the pitch or any other. It’s fair to wonder, then, if his second-half numbers are what we should expect from Price at this point in his career, since his contact rates during that time were much more sustainable. He probably won’t be as bad as his 2016 3.99 ERA, but I wouldn’t be shocked to see it end up above 3.50 for the second year in a row.

Of course, this is not a comprehensive way to find overvalued pitchers. It’s a crude approach, but one that’s meant to highlight guys who fell off in the second half, as they’re the ones more likely to carry over those declined skills into 2017. That being said, xFIP obviously isn’t perfect, and these players all showed that they were capable of posting above-average results over half a season. Take a risk on them if you want, but be warned that they may not be worth the price.


Searching For Undervalued Pitchers

When looking to the future, there are countless ways to try and find undervalued pitchers.

One such way is to look at which pitchers’ FIPs outperformed their ERAs last year. This is a good approach, but it isn’t enough. For one, there will be players who consistently underachieve on their metrics, like the ever-teasing Michael Pineda. He sits second on the 2016 leaderboard in ERA-FIP, but his ERA is more than half a point greater than his FIP for his career and over a point greater each of the past two seasons.

The other problem with this approach is that FIP has become mainstream enough that everyone will be doing this same thing. Players who outperformed their FIP will be be common targets on draft day, driving up their prices and eliminating any sleeper potential that they had. This, too, is the downside of projections and other easily accessible data.

A different approach is then needed. In that spirit, I decided to create a linear regression model to predict a subsequent year’s ERA based on the difference in first- and second-half splits from the previous year, as well as that year’s ERA. This would help find the players who improved the most from the beginning of the year to the end, and perhaps players who are likely to carry over those improvements into the next season.

The model was generated using data from 2002 to 2015 obtained from FanGraphs’ splits leaderboard, with only pitchers with at least 50 IP in each half-season being considered so as to remove potential outliers. Non-significant variables were removed, and a final model was created. The resulting model was then used with 2016 data to predict ERA in 2017. The following graph shows those predictions, after being rescaled, plotted against 2016 ERA:

For the most part, the predictions line up with their 2016 counterparts. The labeled data points, though, are the ones I want to focus on. Based on this model, each of them are expected to see their ERA drop significantly from last season to this one and could help provide value in the latter rounds of drafts.

Jeff Samardzija
2016 ERA: 3.81
2017 Projected ERA: 3.40

The Shark has had a rough career. Since becoming a starter in 2012, he’s only had one season in which he’s beaten last year’s mark of a 3.81 ERA. He’s played for four different teams in those five years, he’s on the wrong side of 30 and his name is at the same spot on the pronunciation scale as Jedd Gyorko’s. But he does have a few things going for him. He’s struck out over 20 percent of the batters he’s faced in all but one year since 2011, and he’s pitching in a park where home runs go to die. His average fastball velocity is holding steady above 94mph and it was only two years ago where he had a sub-3 ERA with the estimators to back it up. He’s proven he can put up solid numbers, so the predicted improvement isn’t unreasonable. He had a 3.66 FIP in the second half of 2016 that exactly matched his ERA, a substantial drop from his first half numbers. The biggest contributors were his strikeout rate, which rose from 18.9 to 21.9 percent, and his HR/9, which dropped from 1.15 to 0.94. There’s no reason to think the rates are unsustainable either — his HR/FB dropped to a near-league average (in a normal year) 10.8 percent, and his strikeout rate improved almost directly with an increase in his O-Swing%:

Samardzija was able to get batters to swing at pitches out of the zone more frequently as the season went on, and consequently was able to produce more strikeouts. Steamer projects him for a 3.66 ERA, which isn’t all that far off this model’s prediction. If he can bring his strikeout rate back to what it used to be, and AT&T Park does its job, Samardzija could provide some sneaky value in 2017.

Ivan Nova
2016 ERA: 4.17
2017 Projected ERA: 3.72

Moving to the NL seemingly agreed with the former Yankees second-round pick. After posting an unsightly 4.90 ERA in 21 games (only 15 starts) in pinstripes, he turned his season around in Pittsburgh with a 3.06 ERA and 2.62 FIP in his final 11. Switching leagues undoubtedly helped, but there are more reasons behind his improvement. For one thing, he increased his strikeout rate while decreasing his walk rate — just doing those two would be reason to expect a lower ERA. Perhaps more significant, though, is that he halved his HR/9. Much of this is due to a change in scenery — his HR/FB dropped from 21.3 percent before his trade to just 7.8 percent afterward. Of course, he can’t be expected to repeat his performance. He walked just three batters in 64 2/3 innings, good for a 1.1 percent walk rate and a 17.33 K/BB. While Nova is probably better than Phil Hughes, it’s unlikely that even he can replicate that kind of walk rate. Look for Nova to improve on his ERA from last year, but don’t expect him to be as good as his second half. He’ll fall somewhere in the middle, but even that will be more than useful.

Wily Peralta
2016 ERA: 4.86
2017 Projected ERA: 4.35

Don’t look now (unless you promise to come back), but Peralta had a 2.92 ERA in the second half of 2016. Part of this was admittedly due to an inflated 81.7 percent strand rate, but even accounting for that, he managed a 3.75 FIP and 3.59 xFIP during that stretch. His success can be due largely in part to his increase in strikeout percentage, which jumped from 13.6 percent to 20.8 percent. It’s difficult to determine the exact reason behind this, but one explanation might be his increase in velocity. At the start of the year, his fastball was only averaging under 95 mph, a continuation of his 2015 trend and a disgrace to fireballers everywhere. By August, he was closing in on 97 mph, and presumably striking out batters as a consequence. Here’s his velocity by month since 2014, via BrooksBaseball:

Not only did Peralta see an increase in his strikeout rate, but his walk rate improved as well from 8.7 percent to 6.5 percent, which is the lowest to reasonably expect given his career numbers. His WHIP dropped from 1.88 to 1.15, his HR/9 from 1.64 to 1.02 and his wOBA against from .421 to .295 — seemingly everything improved except his age, but I’ll give him a pass on that account. The secret behind his success? His ability to limit hard-hit balls and induce soft contact. Take a look at the trends for each type of contact rate:

In case that doesn’t do it for you, here’s his Statcast exit velocity broken down by game date, via Baseball Savant (with a linear regression line added for those last few skeptics who aren’t convinced):


Peralta’s not an ace, but he has the potential to help out teams this season. Monitor his velocity during spring training, and buy him for a discount on draft day.

Clay Buchholz
2016 ERA: 4.78
2017 Projected ERA: 4.02

Of all pitchers who threw at least 50 innings in each half of the season, Buchholz improved his FIP the most — his first-half FIP was 6.02, so he gave himself quite an advantage, but he still brought it down to 3.74 following the Midsummer Classic. He’s already proven himself to be a capable pitcher, with four sub-3.50 ERA seasons in his past seven seasons, and now he goes to Philadelphia, where pitchers go to be reborn (see: Hellickson, Jeremy). Also, he moves from the AL East to its NL counterpart. Besides going up against a pitcher instead of a designated hitter, he will be facing the likes of the Braves and Marlins instead of the Blue Jays and Yankees.

Despite the difficulty of his former division, Buchholz still managed to improve as the 2016 season wore on. He marginally increased his strikeout and walk rates, doubling his K-BB% to a still-mediocre 9.3 percent in the second half of the season. While that’s not exactly comforting, it’s worth noting that his walk rate in the first half the season was higher than anything he’s put up since 2008, so it’s not likely to approach that number anytime soon. Furthermore, he was able to bring down his bloated HR/FB rate, despite the league’s general struggle to do so. In the first half of the season, 15.9 percent of Buchholz’s fly balls resulted in home runs, which would have been higher than any single season in his career. In the second half that number improved to 5.1 percent, which was much more reasonable given his average rate of 6.5 percent over the previous three seasons. Steamer projects him for a 4.07 ERA, but it’s not difficult to envision a scenario where he does better than even that.

With all that being said, not all of the pitchers on this list are going to live up to their projections. No model is perfect, and none of these guys have exactly had exemplary careers. But they all showed significant improvement over the course of last year, and that’s a strong indication for what to expect from them in 2017.


The Flame-Throwing Myth

Is pitch velocity an indicator of a good pitcher?

Over this past summer, the Twins struck a deal with the Boston Red Sox to send specialist Fernando Abad to Boston for prospect Pat Light. Light, 25, first pitched in the majors in 2016, where in two innings with the Red Sox, he had allowed 8 runs (7 earned). After the deal, he has spent the rest of the season with the Twinkies. His numbers do not look much better, with an ERA of 10.22 in 12.1 innings pitched. Over his minor-league career, he has posted a 4.35 ERA in five seasons. Why did the Twins want this guy? He was 25, fully established as a reliever, and has only dominated the minors in 2016.

One of my theories is that the Twins saw that Light is a flame-thrower. Recently, he hit 101 miles per hour on a pitch. Are the Twins fixated on his high velocity? Looking at the Twins’ bullpen, another below-average pitcher, Ryan Pressly, is also touted for his high velocity.

I am not saying definitively that the Twins are focusing on pitchers’ velocities to value prospects and players; previously I wrote about how teams have focused on batters’ exit velocities, so perhaps the Twins have tried to apply this mentality toward pitchers.

Either way, I decided to delve into this topic, seeing if a pitcher’s velocity indicates a lower ERA, FIP, and BABIP, or a higher strikeout rate and walk rate. Using MLB’s Statcast, I was able to parse their data to record a pitcher’s average velocity. Using these data, I tried to establish the skill set of a flame-thrower.

To do this, I performed linear regressions between these different factors, seeing if any of these values are highly related to or influenced by faster pitching.

First, I looked at FIP and velocity. Below are the results:

fipandvelocity

Not a strong relationship, yielding an R-squared of 0.09. This relationship does show that as velocity increases, FIP tends to decrease, but again, not a very convincing relationship.

Next, I looked at ERA and velocity:

velocitytoera

It yielded a similar result, a weak negative relationship, if any.

While the results for ERA and FIP were disappointing, I figured BABIP might look better. If a pitcher can throw faster, it would make sense that the batter would have a tougher time making contact, leading to weaker contact and a lower BABIP. Did the results agree? Have a look:

babiptovel

Disappointing. No relationship at all.

On to strikeout rate and walk rate.

I immediately thought of Aroldis Chapman. He has the fastest heater in the league, and his strikeout rate is above 40%, nearing the top of the league. I was much more optimistic for these metrics.

Here is velocity to strikeout rate:

velocitytok

Not a great relationship, yielding an r-squared of .13. It is a little stronger than anything else we have seen, but that is not saying much at all.

Finally, here is velocity and walk rate:

veloctytowalk

Not much going on here as well.

What does this all mean? Well, for starters, it shows that there are other factors that determine how effective a pitcher is. These data show that these metrics are not the end-all-be-all of a pitcher’s skill. Velocity is not a key indicator of an effective pitcher. Sure, the fastball probably needs to be upward of 85 miles an hour, but speed is not the most important factor. Rather, other skills, such as control, deception, and quality of breaking pitches might be just as important, if not more important, than velocity.

I don’t know if the Twins specifically targeted Light because of his velocity, but in his stint with the Twins, he’s averaged 10.9 walks per 9 innings. What good does his speedy fastball do if he cannot get it over the plate?

After my analysis, I’ll admit I’m a little surprised. I would think a higher velocity would mean a higher strikeout rate. But I am wrong. I guess for every flame-throwing Aroldis Chapman, there is an equally effective Andrew Miller, who does not posses the 105 mile-an-hour heater, but has a higher strikeout rate.


The Good and the Bad: David Price Isn’t Sinking

You know his story: David Price is a $217-million man with a 4.74 earned run average, and the people of Boston aren’t happy. It’s another Crawford-Sandoval-Ramirez waste of money. Things are headed downhill for the 31-year old veteran. Or are they?

First, the bad news: the 2016 version of David Price has been worse than the 2015 David Price, and way worse than the top-caliber pitcher Boston signed him to be. And the ERA shows it.

The suspect is pitch selection, and the culprit is a sinker that doesn’t sink. Price has a two-seam fastball that over his seven-year career he has thrown some 30% of the time. In his prime, it clocked in at 94-95 mph, but since then he’s dropped almost two mph.

Usually, that level of velocity leak wouldn’t be a big deal, because if there’s enough movement and deception, batters will be fooled either way. But Price’s sinker is different.

Brooks Baseball reports that “His sinker has well above-average velocity, but has little sinking action compared to a true sinker and results in more fly balls compared to other pitchers.” Uh-oh. “Little sinking action?” There needs to be at least some element of vertical movement for a sinker to be fully effective, or, in Price’s case, a little extra velocity. But now he has neither.

The results show it. Last month, he surrendered 10 home runs, more than the previous two months combined. Also in June: 31% of his pitches were sinkers, nearly 10% more than the month before. Coincidence? I think not. He’s also allowing a .241 Isolated Power on sinkers, only three points less than Mike Trout this season. And maybe the most convincing statistic: hitters are pulling the ball 10% more than they did last year, which means they are making more solid contact and not having to stay back on his fastball. Price’s pitches are slower, and it’s making a difference.

Why is he losing velocity? There’s two possibilities and they point in completely opposite directions. The first is age. Price is 31 and he’s nearing the point where most starting pitchers start to fall on the aging curve and eke velocity. If this is the case, it’s going to be a long seven years for the Red Sox. But there is another possibility. Price has played in Tampa Bay for most of his career, where the temperatures are never 40 degrees like Boston in April. It’s entirely possible that the cold ‘froze’ him up this spring and as the season continues, he’ll regain his speed. Most likely, it’s a combination of both. But either way, it’s never a good sign when pitchers slow down.

Price has always gotten away with leaving sinkers up in the zone because they showed 94-95 mph on the radar gun. But now hitters are seeing 92mph fastballs fly straight down the middle of the plate and stay there.  Why doesn’t he just put the ball on a tee? Nine out of 10 major-league hitters will knock that pitch into the stands every time. Just look at the stats: He’s surrendered just two fewer home runs than he did last season even though he’s pitched 112 fewer innings (2015: 17, 2016: 15), and he’s allowed an average of 1.25 home runs per nine innings, which is 32 percent worse than his career average (0.84). Sinkers are sending the man to his grave.

They’re also killing his ERA. 38% of his earned runs are from home runs, and if you set his home runs to eight instead of 17, his ERA would be 4.01 instead of 4.74, a 0.73 difference. (8 is the number he had allowed last year at this point in the season.) In fact, his strikeout and walk totals are even better than last season, but the home runs negate all of it.

But we can’t blame everything on the sinker, either. Price has definitely been unlucky this season. His home run to fly ball ratio is 15.5%, an unsustainable mark, his .323 BABIP .035 more than his career average, and his LOB% 10 percent less than the 2016 league average. These will balance out in time. But his sinker is the real problem.

The only way to truly limit home runs is to limit fly balls, and for Price, the only way to limit fly balls is to stop throwing sinkers that don’t sink. The solution is (1) throw harder, or (2) find another pitch to replace his sinker. Option one is still TBD. Option two could be filled with either a change or slider — two pitches that he has used to complement his fastball but never to the level that he uses his sinker. The outlook is grim either way.

Price is still a very experienced pitcher, and once his HR/FB, LOB%, and BABIP rates come down to earth, things will even out. But if he wants to be successful for the Red Sox for the entirety of his stay, there’s a longer-term issue at stake, and if his velocity continues to leak, I’m not sure what type of David Price we’ll be looking at a year from now.


The Case For Jake Arrieta as the Most Dominant Pitcher of All Time

C.R.A.P.  It’s a fairly modern affliction that affects a great deal of people like you and me — and by ‘you and me’ I mean internet users.  It’s clear that the internet, like all of mankind’s greatest achievements, is not without drawbacks.  Never before have we been so connected, and never before have we heard the terms: Athazagoraphobia (Fear of missing out), ‘Paradox of Choice’, and ‘Intellectual Technologies’ (just Google it — because I can’t remember what it means).  The level of connectedness is so intense that on a day-to-day basis, I feel like I meet people whose personalities are plagiarized patchworks of charismatic, yet ill-informed internet voices (myself included).  And then, of course, there’s C.R.A.P., which stands for Combative Responses to Antipodal Posts.  An amusing component of C.R.A.P. is the ferocity with which contrary opinions are met with online; I have experienced 30 years of life and not once have I heard strangers communicate with each other in the manner that they do in the comments section of baseball blog posts on the internet.

To be clear, I’m not completely condemning the common vernacular found in said comments sections, because debate and conversation simply happen differently when we’re responding to a pun that’s a screen name rather than a face with eyes.  On Thursday, the 21st of April, Jeff Sullivan wrote a piece titled, The Case for Noah Syndergaard as Baseball’s Best Pitcher, and the comments section is littered with people who suffer from C.R.A.P.  In my opinion, if you actually read the article, you’d be able to tell that Jeff isn’t declaring Syndergaard the best pitcher, but based on his stuff and recent results, there’s definitely a case for it, hence the title.  Essentially, I think Jeff is saying that it’s possible Syndergaard is taking that step, and he’s open to the idea.  Jeff did a great job (as always, thank you, Jeff) as evidenced by reactions to the article.  He got us thinking and he got us discussing — some of us liked what Jeff had to say and some of us clearly weren’t receptive to the idea.  At all.  To his credit, Jeff did exactly what he’s supposed to do.

Now before we nosedive into the reasoning behind the outlandish title of this article, I want to get a few things out of the way: First and foremost, I’m sorry for throwing gasoline on an already raging fire.  Second, I think Clayton Kershaw is the best pitcher in baseball because of his sustained dominance (1.98 ERA over his last 1066.1 IP).  Certainly that doesn’t mean that pitchers can’t be better than Kershaw for a period of time, however, it’s just that while others rise and fall to his level, Kershaw remains.  And finally, I think Pedro Martinez is the best pitcher of all time.  That’s partly because I was born in 1985, and partly because I read it on the internet.  Mentioning Pedro is a good time to tie back into Jeff’s article.  To quote:

…Right now, in 2016, Syndergaard has a 23 ERA- and a 22 FIP-, through three starts…

Believe it or not, Kershaw has 37 three-start stretches with an ERA- no higher than 23. He has just seven three-start stretches with an FIP- no higher than 22. What Syndergaard is doing, Kershaw has done several times. But it’s not like this is Kershaw’s resting level. And Syndergaard is just as much about the scouting as he is about the stats.

That 23 ERA- just happens to be the number I was looking for.  During his peak (97 – 03), Pedro was preposterously good, posting a K-BB% of 26.1%, a 47 ERA-, and a 52 FIP-.  The acme of his peak came in a 22-game stretch spanning the 1999-2000 seasons when he posted an ERA- of 23 and an FIP- of 33.  His K-BB% was an unruly 34%, and he allowed just 95 hits in 168.1 IP.  Marvel at the overall line: 

August 3, 1999 – June 14, 2000

GS IP TBF H R ER HR BB K ERA WHIP FIP GSv2 K-BB% ERA- FIP-
22 168.1 635 95 25 21 7 31 247 1.12 0.75 1.51 84 34.0% 23 33

Again, that 23 ERA- is what I’m focusing on because it’s the number we saw in Mr. Sullivan’s article.  I could not find a better or equal stretch of dominance, based on ERA-, over 22 games, than Pedro’s going back to 1969…until Jake Arrieta.  Looking at only regular-season games, dating back to July 2nd of 2015, Arrieta has produced that magic 23 ERA- number we’re looking for:

July 2, 2015 – April 21, 2016

GS IP TBF H R ER HR BB K ERA WHIP FIP GSv2 K-BB% ERA- FIP-
22 162 590 84 19 16 4 31 159 0.89 0.71 2.12 75 21.7% 23 55

For those of you who prefer FIP I say leave your C.R.A.P. in the comments section, because as we gain more data, we learn that pitchers have some modicum of control over the quality of contact they allow, and at this point it’s probably safe to say that Jake Arrieta is a proven FIP-beater, even if he’s earned this title in less time than it takes others.  But Arrieta’s streak is now actually at 24 starts in the regular season, and two of those have been no-hitters.  His line:

June 21, 2015 – April 21, 2016

GS IP TBF H R ER HR BB K ERA WHIP FIP GSv2 K-BB% ERA- FIP-
24 178 647 91 20 17 4 33 173 0.86 0.70 2.09 76 21.6% 22 54

Pop the confetti!  Blow your vuvuzelas! Or Tweet!  That 22 ERA- is something we’ve never seen over such a large quantity of starts (at least going back to 1969 — and at least with my hack-job research)!

What this means in the scope of baseball’s long history isn’t nothing.  It’s a marvelous line.  Of course, it is just one number I’m looking at, and ERA-, like the internet, is not without flaws.  It’s arguable and perhaps even likely that Pedro’s line, with that 34.0% K-BB%, is more impressive (that mark was 293% better than league average — lolz).  But Arrieta has two no-hitters.  However, if we look at quality of opponents, well, Pedro’s line becomes more impressive because the teams he squared off against combined for an average wRC+ of 102, whereas Arrieta’s opponents averaged 94 wRC+.

Dave Cameron wrote an article about Arrieta’s ability to control the quality of contact he allows, and as we learn more about this skill, perhaps we’ll revere it a little more — never as much as strikeouts, but definitely more than we do now.  One of Jeff’s points about Syndergaard is that he undoubtedly has the arsenal and command to become the game’s top arm.  Arrieta has legit weaponry as well, but I don’t think anything we’ve ever seen from a starter matches what Syndergaard is throwing.  We know Arrieta’s story up to this point, which makes his sudden-ish ascent to a level where he can put a streak together like the one he’s on more interesting, if not more impressive.  What he does from now until the end of his career will go a long way in determining the weight this current streak holds.  If he flames out, or loses his ability to induce weak contact, it will be seen as a lucky blip; but if he rallies off another few years of 5 – 8 WARs and 50 ERA-es, then we’ll feel better about objectively putting his streak into an historical perspective.  As of right now, even despite his current run, I’m nowhere near putting Arrieta’s name in with the all-time greats (yes, the title was click-bait, spare me the C.R.A.P.), but, like Jeff in regards to how he feels about Syndergaard, but to a lesser extent, I’m open to it.  And that’s about as far as it goes for me — but I’m so contented to sit here and watch the debate unfold, violently, online.


How Game Theory Is Applied to Pitch Optimization

The timeless struggle between pitcher and batter is one of dominance — who holds it and how. Both players use a repertoire of techniques to adapt to each other’s strategies in order to gain advantage, thereby winning the at-bat and, ultimately, the game.

These strategies can rely on everything from experience to data. In fact, baseball players rely heavily on data analytics in order to tell them how they’re swinging their bats, how well they’ll do in college, how they’ll perform at Wrigley versus Miller.

Big data has been used in baseball for decades — as early as the 60s. Bill James, however, was the first prominent sabermetrician, writing about the field in his Bill James Baseball Abstracts during the 80s. Sabermetrics are used to measure in-game performance and are often used by teams to prospect players.

Baseball fans familiar with sabermetrics, the A’s, and Brad Pitt have likely seen Moneyball, the Hollywood adaptation of Michael Lewis’ book. The book told the story of As manager Billy Beane’s use of sabermetrics to amass a winning team.

Sabermetrics is one way baseball teams use big data to leverage game theory in baseball — on a team-wide scale. However, by leveraging their data through the concepts of game theory on a smaller scale, baseball teams can help their men on mound out-duel those at the plate.

Game theory studies strategic decision making, not just in sports or games, but in any situation in which a decision must be made against another decision maker. In other words, it is the study of conflict.

Game theory uses mathematical models to analyze decisions. Most sports are zero-sum games, in which the decisions of one player (or team) will have a direct effect on the opposing player (or team). This creates an equilibrium which is known as the Nash equilibrium, named for the mathematician John Forbes Nash. What this means is that if a team scores a run, it is usually at the expense of the opposing team — likely based on an error by a fielder or a hit off a pitcher.

In the case of pitching, game theory — especially the use of the Nash equilibrium — can be used to predict pitch optimization for strategic purposes. Neil Paine of FiveThirtyEight advocates using big data and sabermetrics to analyze each pitch in a hurler’s armory, then cultivating the pitcher’s equilibrium — the perfect blend of pitches that will result in the highest number of strikeouts, etc.

Paine has gone so far as to create his own formula, the Nash Score, to predict which pitcher should throw which pitches in order to outwit batters.

In perfect game theory, the Nash equilibrium states that each game player uses a mix of strategies that is so effective, neither has incentive to change strategies. For pitchers, Paine’s Nash Score uses their data to find the optimal combination of pitches to combat batters, including frequency.

Paine does point out that creating this kind of equilibrium in baseball can be detrimental to a pitcher. He is, after all, playing against another human being who is just as capable of using game theory to adapt strategies to upset the equilibrium.

If a pitcher’s fastball is his best, and his Nash Score shows that he should be using it more often, savvy hitters are going to notice. “ . . . In time, the fastball will lose its effectiveness if it’s not balanced against, say, a change-up — even if the fastball is a far better pitch on paper,” writes Paine.

In this case, a mixed strategy is the best — in game theory, mixed strategies are best used when a player intends to keep his opponent guessing. Though pitch optimization using Paine’s Nash Score could lead to efficiency, allowing pitchers to throw fewer pitches for more innings, it could also lead to batters adapting much quicker to patterns, thus negating all the work.


The Improvement of the Indians Starting Rotation

Remember at the end of last season and before this season when we all foresaw an Indians rotation that could possibly feature somewhere between 2 and 5 really good, and possibly great, starting pitchers?  Don’t get bogged down on the slight exaggeration of that 1st sentence – To recap what we were looking at coming into this season for the Indians’ rotation:  Corey Kluber won the 2014 AL Cy-Young; Carlos Carrasco had a string of starts to end 2014 in which he seemingly (finally) figured out how to harness all of his powers in a bid to ascend his name to an echelon where only Clayton Kershaw’s name resides; Danny Salazar has always had elite swing and miss stuff and was also excellent in the second half of 2014;  Trevor Bauer and his Costco-sized arsenal of pitches have made some of us incredulously, if not warily optimistic since he was taken 3rd overall in 2011; and even T.J. House made us pause and take notice with his strong second half of 2014.

Then, like hype men with a special blend of Cleveland Kool-Aid being intravenously administered, Eno Sarris and Daniel Schwartz posted one of my favorite FanGraphs articles ever, Pitch Arsenal Score Part Deux, and the anticipation over the Indians’ rotation pulsated like a vein in the neck of John Rambo in the midst of fleeing from man-hunters.

The supporting cast, the lineup, looked poised to support the staff with plenty of runs.  Returning would be: break out star Michael Brantley; bounce-back candidate Jason Kipnis; now-full-time-first-basemen, Carlos Santana; a supposedly healthy Michael Bourn; an offense-first but totally-respectable-defensively, Yan Gomes; and an actually-not-that-horrible-in-2014, Lonnie Chisenhall.  Slugger Brandon Moss, and contact-happy-supposedly-glove-first Jose Ramirez had secured full-time spots as well in RF and SS respectively.  So even though it wasn’t without flaws, it seemed like they would allow the pitchers to rack up plenty of fantasy-relevant wins.

Note: This post isn’t about the disappointment of the Indians, though they have been disappointing; it’s more about what factors beyond luck have contributed to the numbers of the Indians’ starting rotation at various points throughout the year, and the disparity (big or small) between the pitchers’ rates and predictors at those points.

The Indians’ starting pitchers, or at least the top 4 (Kluber, Carrasco, Salazar, and Bauer) have, for the most part, been putting up good, albeit, inconsistent numbers all year despite posting some elite peripheral rates and ERA indicators.  A number of reasons have caused these numbers to grow apart (bad), come together, and then grow apart again (good).  Luck can work like a bit of a pendulum, swinging from one extreme, through the middle, and to the other extreme before evening out and that is at the core of what the Indians’ starting pitchers have experienced this year — although they have yet to experience the final stabilization phase.

We will examine plenty of numbers (Beginning of season to August 18th) based on this time frame: (Spoiler alert – this article is long and dense, and this timeline serves as a sort of cliff notes as to how the staff’s numbers have improved throughout the year – so if you’re the type of person who feels like looking at a bunch of data is superfluous when the bullet points are in front of your eyes, just read the timeline and be done with it.)

timeline

April 6th – May 23rd/May 24th – June 15th

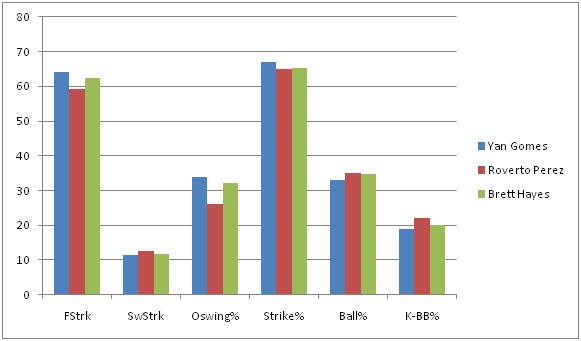
One week into the season, before it was evident that the team’s defense was very sub-par, Yan Gomes hurt his knee and hit the disabled list for over a month.  Roberto Perez filled in quite nicely, and looking at just a couple numbers, could be considered the more valuable catcher (1.4 WAR compared to 0.5 WAR for Gomes).  Brett Hayes (0.0 WAR) was called up and was the secondary catcher during this period.  Behold, a table from StatCorner:

statcorner


Perez has had the least amount of pitches in the zone called balls and the most amounts of pitches out of the zone called strikes.  Overall, despite receiving fewer pitches than Gomes, he has saved more runs (4 DRS to Gomes’ 1) and their caught stealing rates are basically identical with a slight edge going to Perez – 38% to Gomes’ 35%.  Gomes was much better in terms of framing in 2014, and it’s possible the knee injury has limited his skills all around this season.  Anyways, from April 6th – May 23rd, the combined stats of Kluber, Salazar, Carrasco, and Bauer look like this:

ERA FIP xFIP SIERA K-BB% GB%
Kluber 3.49 2.16 2.46 2.51 25.3 48.6
Salazar 3.50 3.27 2.46 2.30 28.7 43.8
Carrasco 4.74 2.60 2.67 2.82 22.3 48.9
Bauer 3.13 3.23 4.09 3.94 14.2 35.7
3.75 22.7 44.7

Gomes returned as the primary catcher on 05/24, and from that point through June 15th, the cumulative numbers aren’t too different, although there is a dip in both K-BB% and GB% that we’ll have to look into.

ERA FIP xFIP SIERA K-BB% GB%
Kluber 3.67 3.26 3.20 3.19 19.8 43.8
Salazar 3.60 3.72 3.36 3.43 17.3 47.7
Carrasco 3.65 2.83 3.29 3.17 20.2 44.1
Bauer 3.96 4.72 4.47 4.30 11.5 36.8
3.74 17.2 43.1

So despite lower K-BB and ground ball percentages (leading to higher ERA predictors), the group’s ERA in the segment of the season when Gomes was reinstated is essentially exactly the same as from the first block of time with Perez.  Now, I am not a big believer in CERA because there is a high level of variation and too many unknown variables pertaining to how much of the responsibility/credit goes to the catcher, the coaching staff, or the pitcher; but I do think that it’s possible Gomes’ extra service time has enabled him to be more in tune with his staff as well as understand hitter tendencies better than Perez and Hayes.  I realize we’re getting into a gray area of intangibles, so I’ll reel it in with some results based on pitch usage%.

% Difference in Pitch Usage with Yan Gomes compared to Roberto Perez

Pitcher FB% CT% SL% CB% CH% SF%
Corey Kluber -9.0 8.8 -17.3 5.0
Danny Salazar 9.8 -12.6 -4.4 17.1
Carlos Carrasco -6.5 9.4 49.2 13.3
Trevor Bauer -2.9 -15.0 -8.9 78.5 25.8

Using BrooksBaseball Pitch f/x data, let’s painstakingly find out how different each pitcher’s pitch usage was in regards to different counts, or better known as Pitch Sequencing.  We’ll look at first pitches, batter ahead counts, even counts, pitcher ahead counts, and 2 strike count situations.  As good as pitch f/x is, the data still isn’t perfect.  There may be discrepancies if you look at usage at Brooks compared to the usage at FanGraphs, so for each pitcher we’ll split the pitches up into three categories: Fastballs (four-seam, sinkers, cutters), Breaking Balls (sliders, curve balls), and Change Ups (straight change/split finger) – I’m aware that splitters are “split fingered fastballs”, but I liken them to change ups more because of the decreased spin rate and generally lower velocity.

*Having a table for each pitcher in regards to pitch sequencing made this article quite messy, so I’ve included a downloadable Excel file, and briefly touched on each pitcher below.

Pitch Sequencing Excel Doc.

Corey Kluber

Looking at the data, Gomes stays hard with Kluber more than Perez until they get ahead in the count.  Perez swaps some early count fastballs for curve balls, but they both see his curve ball as a put-away pitch.  Gomes tends to trust Kluber’s change-up more than Perez later in counts and Perez likes it more earlier in counts.

Danny Salazar

Much like with KIuber, when Gomes catches Salazar, they have a tendency to stay hard early.  Gomes pulls out Salazar’s wipe out change up after they’re ahead whereas Perez will utilize it in hitter’s counts as well.

Carlos Carrasco

Carrasco has 5 good pitches and he’s pretty adept at throwing them for strikes in various counts which is why there is some pretty even usage across the board, at least in comparison to Kluber and Salazar.  There is quite a bit more usage of Carrasco’s secondary pitches in all counts and there are pretty similar patterns when Gomes and Perez are behind the plate.  With Hayes, it doesn’t look like there is much that changes in sequencing until there are two strikes on a hitter.

Trevor Bauer

Bauer is probably a difficult pitcher to catch because of the number of pitches he has and the constant tinkering in his game.  Side note: Gomes is the only catcher to have caught a game in which Bauer threw cutters, and in their last game together, Bauer threw absolutely no change-ups or splits.  Bauer’s highest level of success has come with Hayes behind the plate and perhaps that’s from their willingness to expand his repertoire in more counts than Gomes and Perez do, but there is no way I can be certain of that.

Pitch sequencing can effect the perceived quality of each pitch and therefore, can produce more favorable counts as well as induce higher O-Swing and SwStrk percentages (or less favorable and lower).  So despite the framing metrics favoring Perez, the group throws more strikes with Gomes and also induces more swings at pitches outside the zone – although, as previously noted, there is some regression with Gomes behind the dish in terms of SwStrk% and K-BB%.

swing tendencies


aaa0ide


**These graphs represent numbers through the entire season to garner a bigger sample size.

With lower line drive rates and more medium + soft contact, and (in the case of the Indian’s defense), more fly balls, a conclusion could be jumped to that the staff’s BABIP has trended downward since Gomes regained his role.  A look at BABIP throughout the course of the season:

babip


Woah!  It was well above league average in April and then plateaued at just above league average through mid June, but has been plummeting ever since.  Obviously a catcher is not responsible for this dramatic of a swing in BABIP, so the Indians’ defense must have improved.

June 16th – August 18th

The rotations’ traditional stats look even better if you use June 16th as the starting point:

Pitcher IP H K BB W ERA WHIP
Corey Kluber 84 61 82 16 5 3.11 0.92
Danny Salazar 71 46 69 23 5 2.79 0.97
Carlos Carrasco 77.1 56 77 13 3 2.91 0.89
Trevor Bauer 68.1 69 63 24 4 5.80 1.37
300.2 232 291 76 17 3.59 1.03


So let’s take a look at the Indians’ defensive alignment by month (Player listed is the player who received the most innings played at the position).


POS April May June 1 – 8 June 9 – 15 June 16 – 30 July August
C Perez Perez Gomes Gomes Gomes Gomes Gomes
1B Santana Santana Santana Santana Santana Santana Santana
2B Kipnis Kipnis Kipnis Kipnis Kipnis Kipnis Ramirez
3B Chisenhall Chisenhall Chisenhall Urshela Urshela Urshela Urshela
SS Ramirez Ramirez Aviles Aviles Lindor Lindor Lindor
LF Brantley Brantley Brantley Brantley Brantley Brantley Brantley
CF Bourn Bourn Bourn Bourn Bourn Bourn Almonte
RF Moss Moss Moss Moss Moss Moss Chisenhall

If you’ve paid attention to the Indians at all, you know they’ve made some trades and called up a couple prospects.  But just how different is the new defense?  Well, we only have a small sample with the current configuration, but it appears to be A LOT better. If BABIP wasn’t enough of an indicator, and it’s not, because there has to be some regression to the mean – it can’t stay that low – here are some numbers from the players who were playing the most in May compared to the players who are playing the most in August (again, numbers represent full-season stats):


MAY PLAYER FLD% rSB CS% DRS RngR Arm UZR UZR/150
C Perez .994 2.0 38.5 4
1B Santana .997 -6 0.0 0.7 1.2
2B Kipnis .988 4 4.5 3.6 7.0
3B Chisenhall .963 7 3.1 3.3 10.5
SS Ramirez .948 -2 -2.4 -5.2 -21.9
LF Brantley .992 1 0.3 -2.1 -1.4 -3.3
CF Bourn 1.000 4 -7.2 1.1 -5.8 -11.4
RF Moss .975 -4 1.7 -2.5 -1.1 -1.8
AUG PLAYER FLD% rSB CS% DRS RngR Arm UZR UZR/150
C Gomes .996 0.0 35.0 1
1B Santana .997 -6 0.0 0.7 1.2
2B Ramirez 1.000 1 1.1 2.8 23.2
3B Ursehla .973 2 4.5 6.0 15.7
SS Lindor .967 6 6.0 4.9 14.9
LF Brantley .992 1 0.3 -2.1 -1.4 -3.3
CF Almonte 1.000 2 0.4 -0.2 0.9 10.0
RF Chisenhall 1.000 4 1.6 0.5 2.3 27.3

What’s interesting is that the biggest difference in the infield is Francisco Lindor (Giovanny Urshela has been very solid, but Chisenhall was pretty similar this season at 3B).  I’m sure someone at FanGraphs could churn out a really cool article (if someone hasn’t already) that shows us a quantifiable difference an above average to well above average shortstop makes for a team even if you just keep the rest of the infield the same, as the control.  The 2015 Tigers come to mind – a healthy Jose Iglesias has made a difference for a team that still features Nick Castellanos at 3B and Miguel Cabrera at 1B.  Teams are willing to sacrifice offensive contributions if a SS has elite defensive skills (Pete Kozma, Andrelton Simmons, Zack Cozart to name a couple off the top of my head).  Lindor, to this point, has been an above average offensive player, too, so this could be special.

At this point the Indians are in last place and are out of contention.  Abraham Almonte is their starting center fielder and with Kipnis back from the DL, Jose Ramirez is not playing 2B, but is instead getting reps in left field while Michael Brantley DHs due to his ailing shoulder.  Perhaps all this means is that they don’t have better replacements; OR PERHAPS they’re planning to establish a more defense-oriented squad next year…

Now there’s no doubt that this research has led to some frustrating conclusions.  With Gomes behind the plate, the K rate and GB rate of the staff has trended in the wrong direction in regards to ERA indicators; so is the difference in the batted ball profile plus an improved defense enough to make up for these facts?  This small sample size thinks so, but it could 100% just be noise.  However, there are clubs that are succeeding by using similar tactics right now:

Team ERA FIP ERA-FIP GB% (rank) SOFT% (rank) OSWING% K-BB% (rank)
Royals 3.57 3.93 -0.36 42.1 (29th) 18.1 (16th) 30.9 (19th) 10.5 (26th)
Rays 3.63 3.79 -0.16 42.4 (28th) 18.7 (13th) 31.2 (17th) 14.8 (7th)
Indians (as a reference) 3.85 3.65 0.20 44.7 (17th) 18.2 (15th) 33.3 (2nd) 16.9 (1st)

Granted, the Royals and Rays have the 1st and 2nd best defenses in baseball, and their home parks play differently than the Indians, but they also don’t boast the arms the Indians do.

The Indians have their noses deep in advanced metrics and having rid themselves of Swisher, Bourn, and Moss during 2015’s trading period has allowed them to deploy a better defensive unit which has amplified their biggest strength – their starting pitching.  Furthermore, their unwillingness to move any of their top 4 starting pitchers also leads me to believe they see next year as a time for them to compete.  I’m not going to speculate what moves the Indians will make in the offseason, but I hope they stick with this defense-oriented situation they have gone with recently because it’s been working (and because I own a lot of shares of Kluber, Carrasco, and Salazar in fantasy).


The Future is Bright, But Will the A’s Compete in 2015?

The Oakland Athletics may have finally completed their roster turnover on Wednesday with their most recent deal sending Yunel Escobar to Washington for RP Tyler Clippard. However, you can never know if Billy Beane is finished making moves. With that being said, I’d like to break down the roster from last year to this year and assess whether or not the team will actually regress in 2015. The fact is that the Athletics got quite a bit younger this offseason and acquired many players with a lot of team control remaining. The distant future appears brighter now than it did prior to this offseason, but the main question is, will the Athletics be able to compete in 2015 as well as they would have prior to the roster turnover? Lets take a look at the numbers:

STARTING LINEUP

I will start by comparing the most common nine players in the A’s lineup last year to their projected starting nine this year, using WAR and wRC+:

[All stats give on the chart will represent the 2014 season in the MLB only. In further commentary I may bring up career numbers or minor league numbers for some players.]

2014 WAR wRC+ 2015 WAR wRC+
C – Derek Norris 2.5 122 C – Stephen Vogt 1.3 114
1B – Brandon Moss 2.3 121 1B – Ike Davis 0.3 108
2B – Eric Sogard 0.3 67 2B – Ben Zobrist 5.7 119
3B – Josh Donaldson 6.4 129 3B – Brett Lawrie 1.7 101
SS – Jed Lowrie 1.8 93 SS – Marcus Semien 0.6 88
LF – Yoenis Cespedes 3.4 109 LF – Sam Fuld 2.8 90
CF – Coco Crisp 0.9 103 CF – Coco Crisp 0.9 103
RF – Josh Reddick 2.3 117 RF – Josh Reddick 2.3 117
DH – Alberto Callaspo -1.1 68 DH – Billy Butler -0.3 97

2014 AVG WAR = 2.1 / Total wRC+ = 929

2015 AVG WAR = 1.7 / Total wRC+ = 937

As shocking as it may seem, this displays that the A’s should in fact score more runs with their lineup in 2015 than they did with Donaldson, Moss and Cespedes in the heart of their lineup last season. Although, this chart only accounts for 2014 stats, in which Billy Butler (among others) had an off year. If the A’s can get him back to, or even near his 2012 form, in which his WAR was 2.9 and his wRC+ was 139, they could be in for a significant upgrade on offense as a whole. One of the reasons why this lineup has the potential to be more successful even after losing a guy like Donaldson is because of the acquisition of Ben Zobrist. While Brett Lawrie is -4.7 to Donaldson in WAR and -28 to Donaldson in wRC+, Zobrist is +5.4 to Sogard in WAR and +52 to Sogard in wRC+, more than making up for the loss of Donaldson. While the A’s did use a lot of other DH besides Callaspo in 2014, he totaled the greatest amount of plate appearances from that spot, which might lower the 2014 numbers a little.

The average WAR is down slightly from last season, but with Stephen Vogt behind the plate and Marcus Semien most likely getting the every day job at SS, the A’s feel they are upgrading defensively. Semien’s numbers represent his slim 255 plate appearances in the majors last season, but in TripleA his wRC+ was 142. You cannot expect that out of Semien at the major league level, but it shows that he has potential to improve in 2015. The A’s did use a lot of players at each position last season and they will again in 2015; that is why it is important to also take a look at the bench players from last year and the projected bench for this year.

BENCH

While the 25-man roster is not set in stone for 2015 just yet, here is last year’s most commonly used bench players versus next year’s projected bench.

2014 WAR wRC+ 2015 WAR wRC+
Nick Punto 0.2 73 Craig Gentry 1.4 77
Craig Gentry 1.4 77 Josh Phegley 0.2 92 – 132(AAA)
John Jaso 1.5 121 Eric Sogard 0.3 67
Sam Fuld 1.3 73 Mark Canha N/A 131(AAA)

2014 AVG WAR = 1.1 / TOTAL wRC+ = 344

2015 AVG WAR = .48 / TOTAL wRC+ = 367(407)

While these numbers are a bit skewed due to the fact that Canha has not yet reached the majors and also because Jaso was actually a starter while he was healthy, they do give a good idea of what to expect in 2015. Sogard takes over for Punto as the reserve infielder. Fuld and Gentry will most likely platoon in LF, same goes for Vogt and Phegley at C. Since Fuld and Vogt are LH, they will see more time in the starting lineup, leaving Gentry and Phegley on the list of bench players for 2015. Gentry and Phegley will see most their time against lefties, which will likely help their overall numbers. The A’s always do a great job shifting their lineup to create the match ups they want, expect more of the same with platoons and late pinch hitting in 2015.

STARTING ROTATION

The starting rotation is an area where a lot of people say they A’s have question marks. This may be due to the fact that they lost Jon Lester and Jason Hammel to free agency and traded away Jeff Samardzija to the White Sox earlier this off season. However, the A’s held the best record in baseball for months in 2014 with a rotation featuring Sonny Gray, Scott Kazmir, Jesse Chavez, Drew Pomeranz and Tommy Milone. Four of those guys will be returning in 2015, with a slew of other young arms fighting for a spot in the rotation. Anyone from Chris Bassitt, Jesse Hahn, Sean Nolin or Kendall Graveman would be an upgrade or at worst an equal replacement of Milone. Let’s take a look at the numbers for the five players who started the most games for the Athletics last season VS the A’s projected rotation for next season using ERA, WHIP and WAR from the 2014 season:

2014 ERA WHIP WAR 2015 ERA WHIP WAR
Sonny Gray 3.08 1.19 3.3 Sonny Gray 3.08 1.19 3.3
Scott Kazmir 3.55 1.16 3.3 Scott Kazmir 3.55 1.16 3.3
Jesse Chavez 3.44 1.30 1.7 Jesse Hahn 2.96 1.13 0.8
Jeff Samardzija 2.99 1.07 4.1 Jesse Chavez 3.44 1.30 1.7
Tommy Milone 4.23 1.40 0.4 Drew Pomeranz 2.58 1.13 0.7

2014 AVG: ERA = 3.46 / WHIP = 1.22 / Avg WAR = 2.56

2015 AVG: ERA = 3.12 / WHIP = 1.18 / WAR = 1.96

Keep in mind that ERA and WHIP are better when they are lower and WAR is better if it is higher. While this list does not consist of Jon Lester, the A’s were at their best when they still had Chavez and Milone in their rotation. Also, it was a small sample size for Pomeranz, so we cannot expect numbers quite that solid again in 2015. However, with all that being said, the A’s, despite losing All-Stars, should not take more than a tiny step back in 2015. This rotation is still very solid and is in fact younger this year than last. Not only that, the A’s now have a lot more depth with three other pitchers not on this list that could fill a rotation spot, Chris Bassit, Sean Nolin and Kendall Graveman. Also, we cannot forget about the Tommy John rehabbers Jarrod Parker and AJ Griffin, who could make their way back into this rotation before the All-Star break. Both Parker and Griffin were huge contributors to the A’s success in both 2012 and 2013.

BULLPEN

There are a lot of similar faces coming back to the Athletics’ bullpen in 2015. So, instead of continuing with the format I’ve used for position players and the starting rotation I’m quickly going to compare Luke Gregerson and Tyler Clippard, the one main difference in the bullpen for 2015.

Player ERA / WHIP / WAR

Luke Gregerson 2.12 / 1.01 / 0.9

Tyler Clippard 2.18 / 1.00 / 1.5

These numbers are very similar, making Clippard a perfect replacement for Gregerson, taking over the 8th inning duties in front of incumbent closer Sean Doolittle. I don’t think many people expected the A’s to make a move to acquire another back end of the bullpen piece. Even after losing Gregerson, they seemed to have a very solid bullpen, but now it is even more solidified with a proven set-up man in Tyler Clippard. Another important thing to note about Clippard is his ability to create fly balls. His FB% in 2014 was 49.4% also, his IFFB% was 19.3% and that will likely increase mightily with him now pitching in Oakland. He is the perfect pitcher for the o.Co Coliseum. The A’s will pay Clippard more than they would have paid Escobar in 2015, but they are saving money in the long run due to the fact the Escobar is owed 14 million over the next two seasons and Clippard becomes a free agent after this season (in which he will make around 9 million).

Now let’s take a look at 12 potential options for the Athletics bullpen in 2015. Some of them are locks, but the others will either gain a spot due to the fact that they did not make it into the rotation or if they have a solid showing in spring training.

Name Team (2014) IP ERA WHIP WAR
Sean Doolittle Athletics 62.2 2.73 0.73 2.4
Tyler Clippard Nationals 70.1 2.18 1 1.5
Dan Otero Athletics 86.2 2.28 1.1 0.7
Chris Bassitt White Sox 29.2 3.94 1.58 0.7
Fernando Abad Athletics 57.1 1.57 0.85 0.6
Ryan Cook Athletics 50 3.42 1.08 0.3
Eury De la Rosa Diamondbacks 36.2 2.95 1.39 0.2
R.J. Alvarez Padres 8 1.13 1 0
Kendall Graveman Blue Jays (AAA) 38.1 1.88 1.02 N/A
Sean Nolin Blue Jays (AAA) 87.1 3.5 1.25 N/A
Eric O’Flaherty Athletics 20 2.25 0.95 -0.1
Evan Scribner Athletics 11.2 4.63 0.94 -0.2

There are a lot of very solid options for the A’s bullpen in 2015. I’d expect to see, Doolittle, Clippard, O’Flaherty, Cook, Otero and Abad for sure, but I expect all of these guys to make an impact at some point, if not this season then in 2016.

TAKEAWAY

The Athletics have a very deep pitching staff. With Sonny Gray and Scott Kazmir headlining the rotation, they have a plethora of options to fill the remaining three spots. Pomeranz, Hahn and Chavez look to be the leading candidates, although Billy Beane himself has mentioned Kendall Graveman as someone he sees making the rotation out of spring training. The A’s also have a very strong bullpen, especially after the recent acquisition of All-Star set-up man Tyler Clippard. After losing Josh Donaldson, Brandon Moss, Yoenis Cespedes and Derek Norris (four All-Stars), the A’s lineup for 2015, according to wRC+ actually got better. It’s not always the big name All-Stars that make a team successful. Oakland has proven this many times in the past, most recently in 2012, right after an offseason makeover similar to this year’s. The one piece that has remained since before the 2012 makeover and after this 2015 makeover, is Coco Crisp. There cannot be enough said about the value of Crisp to the A’s organization. With Crisp healthy in CF and the newly acquired pieces filling in around him, I expect the A’s to be back competing for another American League West division title in 2015.