Archive for DRS

The Improvement of the Indians Starting Rotation

Remember at the end of last season and before this season when we all foresaw an Indians rotation that could possibly feature somewhere between 2 and 5 really good, and possibly great, starting pitchers?  Don’t get bogged down on the slight exaggeration of that 1st sentence – To recap what we were looking at coming into this season for the Indians’ rotation:  Corey Kluber won the 2014 AL Cy-Young; Carlos Carrasco had a string of starts to end 2014 in which he seemingly (finally) figured out how to harness all of his powers in a bid to ascend his name to an echelon where only Clayton Kershaw’s name resides; Danny Salazar has always had elite swing and miss stuff and was also excellent in the second half of 2014;  Trevor Bauer and his Costco-sized arsenal of pitches have made some of us incredulously, if not warily optimistic since he was taken 3rd overall in 2011; and even T.J. House made us pause and take notice with his strong second half of 2014.

Then, like hype men with a special blend of Cleveland Kool-Aid being intravenously administered, Eno Sarris and Daniel Schwartz posted one of my favorite FanGraphs articles ever, Pitch Arsenal Score Part Deux, and the anticipation over the Indians’ rotation pulsated like a vein in the neck of John Rambo in the midst of fleeing from man-hunters.

The supporting cast, the lineup, looked poised to support the staff with plenty of runs.  Returning would be: break out star Michael Brantley; bounce-back candidate Jason Kipnis; now-full-time-first-basemen, Carlos Santana; a supposedly healthy Michael Bourn; an offense-first but totally-respectable-defensively, Yan Gomes; and an actually-not-that-horrible-in-2014, Lonnie Chisenhall.  Slugger Brandon Moss, and contact-happy-supposedly-glove-first Jose Ramirez had secured full-time spots as well in RF and SS respectively.  So even though it wasn’t without flaws, it seemed like they would allow the pitchers to rack up plenty of fantasy-relevant wins.

Note: This post isn’t about the disappointment of the Indians, though they have been disappointing; it’s more about what factors beyond luck have contributed to the numbers of the Indians’ starting rotation at various points throughout the year, and the disparity (big or small) between the pitchers’ rates and predictors at those points.

The Indians’ starting pitchers, or at least the top 4 (Kluber, Carrasco, Salazar, and Bauer) have, for the most part, been putting up good, albeit, inconsistent numbers all year despite posting some elite peripheral rates and ERA indicators.  A number of reasons have caused these numbers to grow apart (bad), come together, and then grow apart again (good).  Luck can work like a bit of a pendulum, swinging from one extreme, through the middle, and to the other extreme before evening out and that is at the core of what the Indians’ starting pitchers have experienced this year — although they have yet to experience the final stabilization phase.

We will examine plenty of numbers (Beginning of season to August 18th) based on this time frame: (Spoiler alert – this article is long and dense, and this timeline serves as a sort of cliff notes as to how the staff’s numbers have improved throughout the year – so if you’re the type of person who feels like looking at a bunch of data is superfluous when the bullet points are in front of your eyes, just read the timeline and be done with it.)

timeline

April 6th – May 23rd/May 24th – June 15th

One week into the season, before it was evident that the team’s defense was very sub-par, Yan Gomes hurt his knee and hit the disabled list for over a month.  Roberto Perez filled in quite nicely, and looking at just a couple numbers, could be considered the more valuable catcher (1.4 WAR compared to 0.5 WAR for Gomes).  Brett Hayes (0.0 WAR) was called up and was the secondary catcher during this period.  Behold, a table from StatCorner:

statcorner


Perez has had the least amount of pitches in the zone called balls and the most amounts of pitches out of the zone called strikes.  Overall, despite receiving fewer pitches than Gomes, he has saved more runs (4 DRS to Gomes’ 1) and their caught stealing rates are basically identical with a slight edge going to Perez – 38% to Gomes’ 35%.  Gomes was much better in terms of framing in 2014, and it’s possible the knee injury has limited his skills all around this season.  Anyways, from April 6th – May 23rd, the combined stats of Kluber, Salazar, Carrasco, and Bauer look like this:

ERA FIP xFIP SIERA K-BB% GB%
Kluber 3.49 2.16 2.46 2.51 25.3 48.6
Salazar 3.50 3.27 2.46 2.30 28.7 43.8
Carrasco 4.74 2.60 2.67 2.82 22.3 48.9
Bauer 3.13 3.23 4.09 3.94 14.2 35.7
3.75 22.7 44.7

Gomes returned as the primary catcher on 05/24, and from that point through June 15th, the cumulative numbers aren’t too different, although there is a dip in both K-BB% and GB% that we’ll have to look into.

ERA FIP xFIP SIERA K-BB% GB%
Kluber 3.67 3.26 3.20 3.19 19.8 43.8
Salazar 3.60 3.72 3.36 3.43 17.3 47.7
Carrasco 3.65 2.83 3.29 3.17 20.2 44.1
Bauer 3.96 4.72 4.47 4.30 11.5 36.8
3.74 17.2 43.1

So despite lower K-BB and ground ball percentages (leading to higher ERA predictors), the group’s ERA in the segment of the season when Gomes was reinstated is essentially exactly the same as from the first block of time with Perez.  Now, I am not a big believer in CERA because there is a high level of variation and too many unknown variables pertaining to how much of the responsibility/credit goes to the catcher, the coaching staff, or the pitcher; but I do think that it’s possible Gomes’ extra service time has enabled him to be more in tune with his staff as well as understand hitter tendencies better than Perez and Hayes.  I realize we’re getting into a gray area of intangibles, so I’ll reel it in with some results based on pitch usage%.

% Difference in Pitch Usage with Yan Gomes compared to Roberto Perez

Pitcher FB% CT% SL% CB% CH% SF%
Corey Kluber -9.0 8.8 -17.3 5.0
Danny Salazar 9.8 -12.6 -4.4 17.1
Carlos Carrasco -6.5 9.4 49.2 13.3
Trevor Bauer -2.9 -15.0 -8.9 78.5 25.8

Using BrooksBaseball Pitch f/x data, let’s painstakingly find out how different each pitcher’s pitch usage was in regards to different counts, or better known as Pitch Sequencing.  We’ll look at first pitches, batter ahead counts, even counts, pitcher ahead counts, and 2 strike count situations.  As good as pitch f/x is, the data still isn’t perfect.  There may be discrepancies if you look at usage at Brooks compared to the usage at FanGraphs, so for each pitcher we’ll split the pitches up into three categories: Fastballs (four-seam, sinkers, cutters), Breaking Balls (sliders, curve balls), and Change Ups (straight change/split finger) – I’m aware that splitters are “split fingered fastballs”, but I liken them to change ups more because of the decreased spin rate and generally lower velocity.

*Having a table for each pitcher in regards to pitch sequencing made this article quite messy, so I’ve included a downloadable Excel file, and briefly touched on each pitcher below.

Pitch Sequencing Excel Doc.

Corey Kluber

Looking at the data, Gomes stays hard with Kluber more than Perez until they get ahead in the count.  Perez swaps some early count fastballs for curve balls, but they both see his curve ball as a put-away pitch.  Gomes tends to trust Kluber’s change-up more than Perez later in counts and Perez likes it more earlier in counts.

Danny Salazar

Much like with KIuber, when Gomes catches Salazar, they have a tendency to stay hard early.  Gomes pulls out Salazar’s wipe out change up after they’re ahead whereas Perez will utilize it in hitter’s counts as well.

Carlos Carrasco

Carrasco has 5 good pitches and he’s pretty adept at throwing them for strikes in various counts which is why there is some pretty even usage across the board, at least in comparison to Kluber and Salazar.  There is quite a bit more usage of Carrasco’s secondary pitches in all counts and there are pretty similar patterns when Gomes and Perez are behind the plate.  With Hayes, it doesn’t look like there is much that changes in sequencing until there are two strikes on a hitter.

Trevor Bauer

Bauer is probably a difficult pitcher to catch because of the number of pitches he has and the constant tinkering in his game.  Side note: Gomes is the only catcher to have caught a game in which Bauer threw cutters, and in their last game together, Bauer threw absolutely no change-ups or splits.  Bauer’s highest level of success has come with Hayes behind the plate and perhaps that’s from their willingness to expand his repertoire in more counts than Gomes and Perez do, but there is no way I can be certain of that.

Pitch sequencing can effect the perceived quality of each pitch and therefore, can produce more favorable counts as well as induce higher O-Swing and SwStrk percentages (or less favorable and lower).  So despite the framing metrics favoring Perez, the group throws more strikes with Gomes and also induces more swings at pitches outside the zone – although, as previously noted, there is some regression with Gomes behind the dish in terms of SwStrk% and K-BB%.
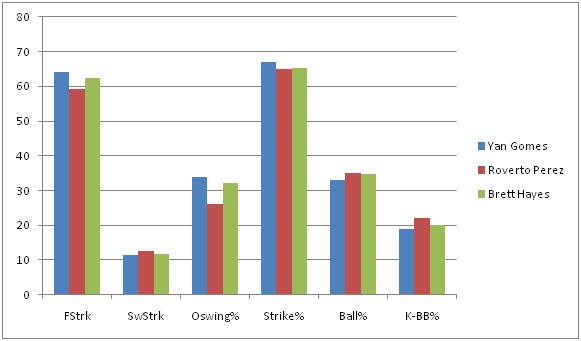
swing tendencies


aaa0ide


**These graphs represent numbers through the entire season to garner a bigger sample size.

With lower line drive rates and more medium + soft contact, and (in the case of the Indian’s defense), more fly balls, a conclusion could be jumped to that the staff’s BABIP has trended downward since Gomes regained his role.  A look at BABIP throughout the course of the season:

babip


Woah!  It was well above league average in April and then plateaued at just above league average through mid June, but has been plummeting ever since.  Obviously a catcher is not responsible for this dramatic of a swing in BABIP, so the Indians’ defense must have improved.

June 16th – August 18th

The rotations’ traditional stats look even better if you use June 16th as the starting point:

Pitcher IP H K BB W ERA WHIP
Corey Kluber 84 61 82 16 5 3.11 0.92
Danny Salazar 71 46 69 23 5 2.79 0.97
Carlos Carrasco 77.1 56 77 13 3 2.91 0.89
Trevor Bauer 68.1 69 63 24 4 5.80 1.37
300.2 232 291 76 17 3.59 1.03


So let’s take a look at the Indians’ defensive alignment by month (Player listed is the player who received the most innings played at the position).


POS April May June 1 – 8 June 9 – 15 June 16 – 30 July August
C Perez Perez Gomes Gomes Gomes Gomes Gomes
1B Santana Santana Santana Santana Santana Santana Santana
2B Kipnis Kipnis Kipnis Kipnis Kipnis Kipnis Ramirez
3B Chisenhall Chisenhall Chisenhall Urshela Urshela Urshela Urshela
SS Ramirez Ramirez Aviles Aviles Lindor Lindor Lindor
LF Brantley Brantley Brantley Brantley Brantley Brantley Brantley
CF Bourn Bourn Bourn Bourn Bourn Bourn Almonte
RF Moss Moss Moss Moss Moss Moss Chisenhall

If you’ve paid attention to the Indians at all, you know they’ve made some trades and called up a couple prospects.  But just how different is the new defense?  Well, we only have a small sample with the current configuration, but it appears to be A LOT better. If BABIP wasn’t enough of an indicator, and it’s not, because there has to be some regression to the mean – it can’t stay that low – here are some numbers from the players who were playing the most in May compared to the players who are playing the most in August (again, numbers represent full-season stats):


MAY PLAYER FLD% rSB CS% DRS RngR Arm UZR UZR/150
C Perez .994 2.0 38.5 4
1B Santana .997 -6 0.0 0.7 1.2
2B Kipnis .988 4 4.5 3.6 7.0
3B Chisenhall .963 7 3.1 3.3 10.5
SS Ramirez .948 -2 -2.4 -5.2 -21.9
LF Brantley .992 1 0.3 -2.1 -1.4 -3.3
CF Bourn 1.000 4 -7.2 1.1 -5.8 -11.4
RF Moss .975 -4 1.7 -2.5 -1.1 -1.8
AUG PLAYER FLD% rSB CS% DRS RngR Arm UZR UZR/150
C Gomes .996 0.0 35.0 1
1B Santana .997 -6 0.0 0.7 1.2
2B Ramirez 1.000 1 1.1 2.8 23.2
3B Ursehla .973 2 4.5 6.0 15.7
SS Lindor .967 6 6.0 4.9 14.9
LF Brantley .992 1 0.3 -2.1 -1.4 -3.3
CF Almonte 1.000 2 0.4 -0.2 0.9 10.0
RF Chisenhall 1.000 4 1.6 0.5 2.3 27.3

What’s interesting is that the biggest difference in the infield is Francisco Lindor (Giovanny Urshela has been very solid, but Chisenhall was pretty similar this season at 3B).  I’m sure someone at FanGraphs could churn out a really cool article (if someone hasn’t already) that shows us a quantifiable difference an above average to well above average shortstop makes for a team even if you just keep the rest of the infield the same, as the control.  The 2015 Tigers come to mind – a healthy Jose Iglesias has made a difference for a team that still features Nick Castellanos at 3B and Miguel Cabrera at 1B.  Teams are willing to sacrifice offensive contributions if a SS has elite defensive skills (Pete Kozma, Andrelton Simmons, Zack Cozart to name a couple off the top of my head).  Lindor, to this point, has been an above average offensive player, too, so this could be special.

At this point the Indians are in last place and are out of contention.  Abraham Almonte is their starting center fielder and with Kipnis back from the DL, Jose Ramirez is not playing 2B, but is instead getting reps in left field while Michael Brantley DHs due to his ailing shoulder.  Perhaps all this means is that they don’t have better replacements; OR PERHAPS they’re planning to establish a more defense-oriented squad next year…

Now there’s no doubt that this research has led to some frustrating conclusions.  With Gomes behind the plate, the K rate and GB rate of the staff has trended in the wrong direction in regards to ERA indicators; so is the difference in the batted ball profile plus an improved defense enough to make up for these facts?  This small sample size thinks so, but it could 100% just be noise.  However, there are clubs that are succeeding by using similar tactics right now:

Team ERA FIP ERA-FIP GB% (rank) SOFT% (rank) OSWING% K-BB% (rank)
Royals 3.57 3.93 -0.36 42.1 (29th) 18.1 (16th) 30.9 (19th) 10.5 (26th)
Rays 3.63 3.79 -0.16 42.4 (28th) 18.7 (13th) 31.2 (17th) 14.8 (7th)
Indians (as a reference) 3.85 3.65 0.20 44.7 (17th) 18.2 (15th) 33.3 (2nd) 16.9 (1st)

Granted, the Royals and Rays have the 1st and 2nd best defenses in baseball, and their home parks play differently than the Indians, but they also don’t boast the arms the Indians do.

The Indians have their noses deep in advanced metrics and having rid themselves of Swisher, Bourn, and Moss during 2015’s trading period has allowed them to deploy a better defensive unit which has amplified their biggest strength – their starting pitching.  Furthermore, their unwillingness to move any of their top 4 starting pitchers also leads me to believe they see next year as a time for them to compete.  I’m not going to speculate what moves the Indians will make in the offseason, but I hope they stick with this defense-oriented situation they have gone with recently because it’s been working (and because I own a lot of shares of Kluber, Carrasco, and Salazar in fantasy).


Positional Versatility and an Extension of Shifting

Is positional versatility underutilized? What does it cost for a player to transition from one position to another? MLB rules state that players currently in the game may switch positions at any dead ball, so why don’t teams shift their stronger fielders around the diamond based on batted ball profiles? Would it be worth it, in terms of runs, to try to have players play multiple positions and shift around the diamond? These are the questions that the following research attempts to answer.

I. The cost of transitioning between positions

The first thing that must be evaluated is what a player gains or loses when moving from one position to another. To do this, I looked at a player’s Total Zone and Defensive Runs Saved numbers, on a per inning basis, for each position they played at least 500 innings at. I did this for every player that met this minimum during the years from 2003-2013 (2003 was chosen as the cutoff because that is the first year DRS numbers are available). After data collection, for each position I took the total per inning number, subtracted from the position they were moving to, multiplied by 1200 innings for roughly a full season. I did this for every position, but I will only list the important positions for the purposes of this research. Since teams would most likely be shifting based on handedness and pull rates (though they theoretically could shift based on other things like GB/FB ratio if they had an outfielder who played a fantastic infield position or vice versa), this makes the important transitions ones shifting between the right and left side of the diamond. Those transitions are as follows:

(Note that due to how this was calculated, the inverse transitions, like 2B-SS, are the same number, but negative. This data was all gathered from Baseball Reference.)

SS-2B: 2.32 TZ runs for a season

SS-2B: 1.82 DRS

3B-1B: 4.68 TZ

3B-1B: 4.41 DRS

LF-RF:  -1.03 TZ

LF-RF: -2.05 DRS

(Personally, I had thought left field was more difficult, though maybe that is a result of mostly watching games in PNC park. It is also worth mentioning that on an individual basis, LF and RF are where Total Zone and Defensive Runs Saved had the largest disagreements)

So, as most people would expect, shortstop came out to be the most difficult position on the field, followed by second base and center field, third base and right field, left field, and first base. So, now that we’ve established that baseline for players transitioning between positions, we can move on to how many runs they would gain or lose in the process.

II. Estimating the number of fielding opportunities

Initially, I could not find detailed batted ball information broken down by handedness. So I attempted several methods of quantifying the impact, using the Cubs fielders as an example, and continually came up with the Cubs gaining 3-6 runs over the course of a season while shifting 20-30% of the time. However, those methods will not be discussed here. This is because Tony Blengino posted this wonderful article yesterday, complete with a batted ball breakdown for left and right handed hitters. So, it was revision time.

Step one was to take the number of fielding opportunities (also from Baseball Reference) for each of the examined positions, so I could get TZ/Fld and DRS/Fld numbers. This was also done with the transitions applied, to get TZ/Fld and DRS/Fld numbers for when they were playing the alternative position. Then, Blengino’s breakdown was combined with the average GB%, FB%, LD%, and IFFB% for left and right handed hitters. This gave a more specific batted ball breakdown for each area of the field. This breakdown is as follows:

MLB LHH

LF %

LCF %

CF %

RCF %

RF %

POP

1.01%

0.68%

0.40%

0.47%

0.44%

FLY

4.45%

7.48%

5.79%

7.92%

5.70%

LD

2.58%

4.36%

3.55%

5.41%

5.98%

GB

3.68%

5.43%

5.56%

11.30%

17.83%


MLB RHH

LF %

LCF %

CF %

RCF %

RF %

POP

0.62%

0.58%

0.47%

0.83%

1.07%

FLY

5.69%

8.02%

5.99%

7.10%

3.93%

LD

5.38%

5.23%

3.50%

4.06%

2.43%

GB

18.54%

11.66%

5.72%

5.58%

3.51%


With this information, I could get to work on estimating the number of fielding opportunities for each position. The first thing to do was to find the number of balls put in play against the Cubs for their 6149 PAs. For right handed batters I took the 6149 PAs * 58% (percentage of RHH) * 68.77% (percentage of balls put in play by RHH). For left handed hitters it was 6149 * 42% * 67.76%.

Unfortunately, this is where I ran into a small problem. I don’t know which balls hit in an area are attributed to which fielding position. For example, I don’t know what proportion of line drives to right field are caught by the first baseman, and what proportion is considered a ball the right fielder should field. This information is likely available, but I do not have it, and could not find it. If someone does find it, I would love to be able to do this more accurately. As it stands, I made educated guesses. The estimated fielding opportunities for each position, broken down by handedness, are as follows for Cubs fielders:

(Percent chance a ball in play was hit into that position’s area, and actual total number of fielding opportunities from last season in parenthesis)

1B: 93.88R (3.83%), 244.35L (13.96%)

1B Total:  338.23 (333 actual)


2B: 223.67R (9.12%), 273.44L (15.63%)

2B Total: 497.11 (496 actual)


3B: 351.59R (14.34%), 69.12L (3.95%)

3B Total: 420.71 (424 actual)


SS: 415.05R (16.92%), 170.37 (9.74%)

SS Total: 585.42 (584 actual)


LF: 459.42R (18.73%), 217.04L (12.40%)

LF Total: 676.46 (676 actual)


RF: 280.80R (11.45%), 331.27 (18.93%)

RF Total: 612.07 (662 actual)

(Estimations attempted to keep close to the actual number and proportion of fielding opportunities. I could not get it to happen properly for RF. It will have to be ironed out at a later date.)

III. Estimating the number of fielding opportunities and runs when shifting

The first thing worth mentioning is the total number of additional runs saved depends entirely on how often a team chooses to run this particular shift. When estimating for the Cubs, I chose to run this shift 25% of the time against all batters (Normally, one might only shift against left handed hitters, but the data suggests that Darwin Barney may be better off playing shortstop than Starlin Castro, so the Cubs will be shifting 25% of the time against all hitters). The first thing to do is to find out a position’s number of fielding opportunities when it is shifting to cover someone else 25% of the time, and when it is covered 25% of the time.

When covering, this is done by taking the number of fielding opportunities when the ball is more likely to be hit at them (like when a 1B is facing a LHH) + 25% of the position being switched to (3B against RHH) + 75% of opportunities when the ball is less likely to be hit at them (1B against RHH). So, a 1B would be playing 1B against every LHH, 3B against 25% of RHH, and 1B against the other 75% of RHH. For being covered, it is the opposite. All fielding opportunities when it is less likely to be hit at them (1B against RHH) + 25% of the alternative position (3B against LHH) + 75% of their original opportunities (1B against LHH). The new total number of estimated fielding opportunities for covering and being covered is as follows:

1B

Original: 338.23

Covering: 402.66

Covered: 294.42

2B

Original: 497.11

Covering: 544.95

Covered: 471.34

3B

Original: 420.71

Covering: 464:52

Covered: 356.28

SS

Original: 585.42

Covering: 611.19

Covered: 537.58

LF

Original: 676.46

Covering: 705.02

Covered: 631.80

RF

Original: 612.07

Covering: 656.72

Covered: 583.51


Essentially, this would get your strongest fielders more fielding opportunities, provided they are still strong after making the transition. Converting the previous formula to runs is simple, since we took both the regular and alternative position’s TZ and DRS runs per fielding opportunity. So for covering this becomes the more likely side * TZ(or DRS)/Fld + 25% of the alternative position’s strong side * AltTZ(or AltDRS)/Fld + 75% of the original weaker side * TZ/Fld. For being covered, the runs per fielding opportunity are added into that previous formula in the same way. That gives us the total number of runs for covering and being covered as follows:

Pos

Covering TZ

Covering DRS

Covered TZ

Covered DRS

1B

7.10

17.53

5.92

13.79

2B

9.19

9.28

8.27

8.30

3B

0.86

6.48

0.33

4.59

SS

-6.08

-6.15

-5.36

-5.42

LF

6.14

-3.39

5.51

-3.03

RF

-10.70

-0.64

-9.59

-0.72


When optimizing the lineup, since one of each pairing (1B-3B, 2B-SS, LF-RF) must be covered, both Total Zone and Defensive Runs Saved agree that 1B should cover for 3B (due to a love of Rizzo’s defense. TZ would disagree if Valbuena had played the whole year) and 2B should cover for SS (both metrics love Barney and dislike Castro). They disagree on RF and LF, where TZ thinks LF should cover, and DRS thinks RF should cover.

If optimized for Total Zone runs, shifting 1B-3B, 2B-SS, and LF-RF 25% of the time results in a total TZ runs for these positions of 7.81, which is a 2.81 run improvement over the original lineup.

If optimized for Defensive Runs Saved, shifting 1B-3B, 2B-SS, and RF-LF 25% of the time results in a total DRS of 22.31, which is a 2.31 run improvement over the original lineup.

IV. Conclusions

Running this shift for the Cubs 25% of the time resulted in a gain of 2-3 runs over the course of the season. This is not an insignificant amount of runs, but there are some things that need to be mentioned.

1. This shift is run 25% of the time against the average for left and right handed hitters. If a team is really going to shift 25% of the time in this method, they will do it against the 25% most extreme pull hitters for each handedness. I do not know the batted ball profiles of the most extreme pull hitters, but it would result in more fielding opportunities when covering, and fewer when being covered. This would likely increase the total number of optimal runs gained significantly. Since I do not have those profiles, I am unsure by what specific margin, but I would love to be able to know.

2. This enables you to somewhat “hide” a poor fielder, particularly at first base. The greatest difference in the odds of a ball being hit at them is between first and third base. If one fielder was particularly poor, you could make sure the odds of a ball being hit to him were always low. The greater the difference between the positions being switched, the greater the overall runs gained are for the season.

3. The Cubs were a terrible team to choose. I initially thought of this idea as I was speaking with a member of their front office, so I did this work on their team specifically. The reason the Cubs are a poor team to choose is because the disparity between the positions being switched is relatively small, except for 2B-SS which has a smaller impact. As mentioned above, this results in a smaller amount of runs gained. A team with a large disparity between first and third would see a far greater impact, particularly with a very good third baseman and poor first baseman due to the transition between positions. I will likely do this with additional teams in the future.

4. As mentioned, this was only run 25% of the time. The more often it is run, the more total runs will be gained.

5. This could be done far more accurately. I do not have all the information I would like available to me right now. I know that an entity like Baseball Info Solutions already records batted ball data to a large number of vectors on the field, as that is how DRS is calculated. That information could be used to come up with far more accurate results in terms of the exact likelihood a batted ball will be fielded by a specific position.

6. The transitions between various positions vary widely on an individual basis. I used the average numbers over a very large sample, so it should be a decent approximation, but every player is different. For every player that went from a very poor shortstop to an excellent second baseman, there is one who performed worse in the same transition. However, due to the transition values roughly lining up well with the positions that are generally known as being difficult, I have no issue with using them.

7. I did not look into whether shifting defensive positions could come with a reduction offensively. Theoretically, a player may slide a bit if he has to focus more attention on fielding multiple positions. I have not yet looked into this. If such a reduction exists, it could possibly be neutralized by an organizational philosophy embracing positional flexibility as players develop.

Overall, the Cubs could likely gain around 3 runs by shifting 25% of the time. If a team has a greater difference between fielders, and shifts with greater frequency, I don’t think it’s unreasonable to expect that team to improve by 1-2 wins over the course of the season. Shifting has grown far more popular lately, and it has been demonstrated to improve overall defense. I believe this is an extension of shifting. It makes sense to shift your fielders to where the other team hits the ball most. It also makes sense to shift players in this manner, and give your better fielders more opportunities to field the ball while giving your poorer fielders fewer opportunities. If you’re going to put a fielder where they hit the ball most, you might as well make it the fielder that is most likely to make a play.

V. A more extreme example

When I wrote this article a few days ago (but hadn’t decided to post it yet) I mentioned that the Cubs were not the greatest choice of team. So, I ran it on a more extreme example, and with greater frequency. As far as frequency is concerned, I upped it from 25% of the time to 50% of the time. For the team, I needed a team with an excellent third baseman, and below average first baseman. The first team that I thought of was the Orioles, so that is the team I used. Considering this is just a quick example to demonstrate the top end of the spectrum rather than the bottom, and the process was not changed, I will not walk through the process in detail again and will just provide the total runs.

If optimized for Total Zone runs, shifting 3B-1B, 2B-SS, and RF-LF 50% of the time results in a total TZ runs for these positions of 49.34, which is a 15.34 run improvement over the original lineup.

If optimized for Defensive Runs Saved, shifting 3B-1B, SS-2B, and LF-RF 50% of the time results in a total DRS of 44.65, which is a 14.65 run improvement over the original lineup.

(For reference, the Orioles when run 25% of the time were approximately an 8-9 run improvement)

With the same potential improvements and diminishments as mentioned in the first example, this is more of an idea of the top end of the spectrum. The Orioles, already a strong defensive team, could potentially gain about 1.5 wins by shifting in this manner 50% of the time. There are definite caveats to consider and improvements to make, but shifting like this could have an extreme defensive impact.


The Clint Hurdle Effect? – The Pirates’ Improved Defense

The success of the Pirates has become arguably the biggest narrative of this season. They sit pretty at 67-44, with a game and a half lead on the St. Louis Cardinals. While some fans of the Pirates are merely thirsting for fourteen more wins to guarantee the end of the 20-year losing skid, analysts widely regard the Pirates as playoff-bound, if not contenders for the division.

Presently, we’ll continue the endless discussion of why the Pirates have succeeded thus far, but perhaps with a new spin.

The Pirates have been trending up under the tenure of Clint Hurdle, but a closer look at the numbers doesn’t necessarily indicate an offensive success, but a noticeable improvement in the defense.

Run Differential

In 2010, the last season before Clint Hurdle, the Pirates finished 57-105 with a despicable -279 run differential. Since then, the run differential has improved incrementally to -102 in 2011 and -23 in 2012, when finishing .500 felt inevitable. This year, the Bucs have outscored their opponents by 49 runs, which isn’t much, but is in an improvement over where it was on August 3rd in 2010 (-205,) 2011 (-12,) and 2012 (+33.)

Metrics

Additionally, a look at some of the advanced metrics indicate an improvement in the defense of the Pirates. In 2010, the Pirates had -77 DRS and a -7.7 UZR/150. In 2011, that improved to -29 and -3.5 (respectively,) and in 2012, -25 and -2.6. Still not great numbers, but they reflect an ostensible difference under Clint Hurdle. In 2013, these numbers are all in the green: 43 DRS, 5.1 UZR/150. Obviously, these are subject to change, but the trend continues.

BABIP

Perhaps it is an illogical step to go backwards from advanced stats like DRS and UZR/150 to one as simple as BABIP, but it seems to me that this one sticks out the most and combines the picture of improved pitching and an improved defense. The noticeable trend has continued, as these are the defensive BABIPs of the Pirates over the last few years:

2010: .311

2011: .300

2012: .286

2013: .270 (1st in MLB)

My simplistic mind appreciates BABIP in this particular instance, because this tells me something clear. These numbers are microcosmic of the fact that the Pirates are improving in the area of simply converting batted balls into outs, and that is nothing but a good sign for a club looking to win games, but it is especially good for a club with the offensive woes the Pirates endure.

Say what you will about the overuse of the Pirates bullpen, and it will not be argued at present. It is my hope that someone can combine these defensive numbers with pitch f/x data and create a more clear picture of how the Pirates have succeeded with a group of ragamuffins. This is a start to a conversation and hopefully a case study into the effectiveness of a good defense and how it can counteract and overcome an anemic offense such as that of the Bucs. We may just see how it works out in the postseason.