Archive for David Price

Sigh of Relief Aside, Expect a Big Year From David Price

No matter what team you root for, we are all baseball fans, and as baseball fans, the game is better when David Price comes out of a visit with Dr. James Andrews in one piece. Red Sox fans held their collective breath after the (since-updated) report was released that Price was being sent to Dr. Andrews following a troubling MRI scan. Even Boston’s brass was expecting to lose Price for the year to Tommy John surgery. Of course, it is not known exactly what Price was diagnosed with, and being shut down for seven to ten days is still troubling, but while the spirits are up, let’s consider something else: David Price will be back in serious Cy Young contention this season.

To be clear, David Price was an excellent pitcher in 2016. Any team would sign up for a 4.5 fWAR pitcher, and that production alone is All-Star worthy. However, in the context of David Price’s career, 2016 qualified as an “off year.” His previous two seasons saw him post totals of 6 fWAR and 6.4 fWAR, respectively. Looking at traditional stats, his 3.99 ERA was his highest since his 128-inning rookie season. So while Price was worth every penny in 2016, it wasn’t the rosiest year of his career.

If we want to find out what was different for David Price in 2016, we won’t have to look very far.

What Went Wrong For David Price in 2016

Year HR/9 FB% HR/FB% Pull% Hard Hit%
2010 0.65 39.6% 6.5% 30.1% 25.5%
2011 0.88 36.9% 9.7% 34.4% 24.7%
2012 0.68 27.0% 10.5% 35.3% 25.6%
2013 0.77 33.4% 8.6% 34.7% 28.6%
2014 0.91 38.1% 9.7% 36.4% 28.3%
2015 0.69 36.4% 7.8% 33.3% 28.2%
2016 1.17 33.9% 13.5% 44.1% 34.8%

*all stats via FanGraphs

Starting in column two, we can see a clear-cut spike in the number of home runs he allowed. Your first thought may be that this can be explained by his having to pitch in the notoriously hitter-friendly Fenway Park, but Price has pitched nearly his entire career in the confines of the American League East and hasn’t had a homer problem until this point. So we move to column two, with the hopes that an increased fly-ball percentage would be the answer to our question. However, his fly-ball percentage was actually his third-lowest recorded since 2010, which makes his spiked home-run-per-fly-ball percentage in column four even more puzzling. With the mystery unsolved, we move to the next column, which measures the percentage of balls in play that were pulled by opposing batters. This rate increased dramatically in 2016, and it coincides with the escalated hard-hit rate in column six.

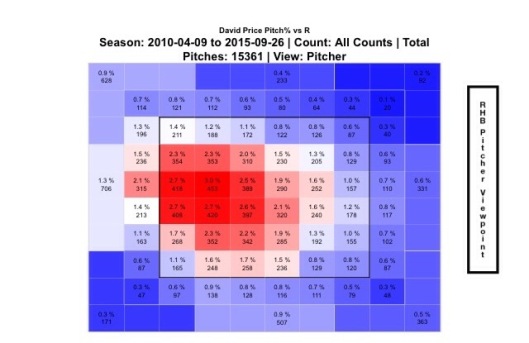
If opposing batters (generally righties) are squaring up on the ball and pulling it more than ever (generally to the Green Monster) on Price, it stands to reason that he is giving them pitches to pull hard. Let’s first examine a heatmap from Price’s pitch locations to right-handed batters over the same six-year sample size we have been using.

fullsizerender-7

*via FanGraphs

This looks pretty good! It’s no wonder why Price has been so adept at avoiding the longball; he really pounds the outside corner on those right-handed batters. So let’s look at 2016 and see if anything has changed.

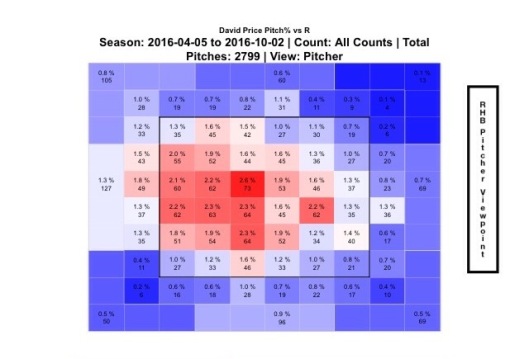
fullsizerender-9

*via FanGraphs

Yeah, that will change your fortunes. Much less of that outside corner action, much more of that “meatball right down the middle” action. I decided to dig a little deeper and look at which of his four pitches (fastball, cutter, changeup, and curve) was most responsible, or if multiple pitches were culprits. I’ll save you the trouble and get to the one culprit.

fullsizerender-8

*via FanGraphs

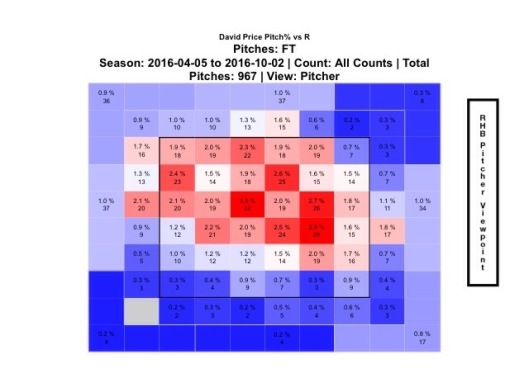
We’ve got a match, and you probably guessed it – it’s the fastball. I can’t explain to you why Price was missing his spots, but you and I know that this is a game of inches, and his fastball was responsible for 16 of the 30 homers he gave up. While this is purely speculation, it’s possible that Price was getting acclimated to his new environment and $217M contract. Whatever the case may be, this is the only adjustment that he really has to make in 2017 to return to his previous levels of Cy Young stardom.

Pitching is an unforgiving occupation, and pitchers often spend years refining their craft, but I am willing to go out on a limb and bet that someone of David Price’s caliber can make this one readjustment. He is no longer the new big-ticket addition in Boston (that would be Chris Sale), nor is he the defending Cy Young (that would be another teammate, Rick Porcello), which should lessen the pressure somewhat. With the hopes that Price is in good health, you can expect a huge bounce-back year from him in 2017.


Searching For Overvalued Pitchers

A little while ago, I created a post here about finding undervalued pitchers by looking at improvements between the first and second halves of the season. I had created a linear regression model for the predictions using data from 2002 to 2015, but when trying to use the same model to find overvalued pitchers, it didn’t exactly work as expected (I use the word “work” loosely here — in all likelihood, my predictions will fail as badly as the new Fantastic Four movie). It did find pitchers who suffered massive setbacks, but the majority of those were primarily due to increased — and probably unsustainable — home-run rates.

For example, Matt Andriese had an extremely successful first half of 2016. He put up a 2.77 ERA in 65 innings, backed up by a 2.85 FIP. But those numbers were much like my ex-girlfriend: pretty on the surface, but uglier once you get to what’s underneath. He struck out a lower percentage of batters than the average pitcher during that time while giving up more hard contact. The biggest sign, though, was his deflated home-run rate. He allowed just 0.28 home runs per nine innings, with only 3.2 percent of his fly balls going over the fence. This righted itself in the second half, where his HR/9 increased to 2.15 and his HR/FB to 17.4 percent. On the other hand, he improved his strikeout and walk rates, actually leading to a drop in his xFIP from 4.04 to 3.92 from the first half of the season to the second.

So then what should we expect from Andriese in 2017? The model I created predicts a 5.56 ERA from Andriese, leaning toward his 6.03 ERA from the second half of last season. While it’s unlikely he will allow fewer than 0.3 home runs per nine innings next year, it’s equally as unlikely that he’ll allow over 2 — after all, no qualified pitcher did so over the course of the 2016 season. Andriese’s full-season FIP of 3.78 actually closely aligned with his xFIP of 3.98, so it’s fair to guess that his home-run rates will level out and his ERA in the coming year will be in that range. That would signify an improvement from his 2016 season, rather than his decline predicted from the model.

So, instead of using the model, I took a simpler approach. Here are the players with at least 50 IP in each half of the 2016 season whose xFIP increased the most from the first half to the second:

xFIP Splits
Name First Half xFIP Second Half xFIP Increase
Tanner Roark 3.64 4.83 1.19
Drew Smyly 4.07 5.10 1.03
Hector Santiago 5.05 5.94 .89
Aaron Sanchez 3.41 4.29 .88
James Shields 4.82 5.70 .88
David Price 3.12 3.98 .86

For the purposes of this article, I’ll ignore Santiago and Shields since it’s unlikely that either of them will be relevant in 2017. That leaves four other pitchers whose skills declined dramatically over the course of the season and who you might want to avoid in your drafts.

Tanner Roark

Believe it or not, Roark’s already 30 years old. He’s actually had pretty decent success in his four years in the majors, with a 3.01 career ERA in over 573 innings. On the flip side, over that same time he has a 3.73 FIP, 3.96 xFIP and 4.06 SIERA. That’s not to say he’s a bad pitcher — just perhaps not as good as his ERA would have you believe. The same can’t be said for his second half of 2016. Despite actually bringing his ERA down from 3.01 to 2.60, his already-inflated FIP and xFIP numbers got even worse. His strikeout rate declined by 2.5 percent while his walk rate rose by about the same amount, leading to just a dismal 1.87 K/BB in the second half. His HR/9 nearly doubled as well, but not due to a substantial increase in his HR/FB rate — rather, his fly-ball rate rose from 26 to 37.6 percent, more in line with his pre-2016 career average of 33.9 percent. Why, then, was he able to continue to be successful? A .230 BABIP and a 86 percent strand rate offer an answer. Don’t expect another sub-3 ERA season from Roark — instead, look more toward his Steamer projection of 4.15.

Drew Smyly

For many last year, Smyly was a popular target. He was a high-strikeout guy who was able to limit walks and generate infield flies, prompting Mike Petriello to write this ringing endorsement for him. In his 114 1/3 innings for Tampa Bay before 2016, Smyly had maintained a 2.52 ERA and was among the best at generating strikeouts. But it all went wrong last year. As Tristan Cockcroft points out, Smyly’s season was marked by a first half of bad luck and a second half of deteriorated skills but better luck. His first-half 5.47 ERA was likely undeserved, as he continued getting strikeouts and limiting walks, but was plagued by a .313 BABIP, 63.2 percent strand rate and a 15.0 HR/FB rate, which corresponded to a 4.45 FIP and 4.07 xFIP. His ERA dropped to 4.08 in the second half, but nearly all of his peripheral stats worsened. A move to Seattle won’t fix all his problems, as Safeco Field was actually more hitter-friendly than Tropicana Field in 2016. The sky is the limit for Smyly, but there’s reason to be cautious. It’s possible he bounces back, but this could be who he is now.

Aaron Sanchez

This guy is good, don’t get me wrong. It took a while for some people to catch on, but I was always on his bandwag…all right, so I was one of the guys who didn’t buy in right away. That’s why I don’t do this for a living. Anyway, seeing his name on this list surprised me. After some digging though, it turns out that in my ignorance, I may have been onto something. In 2015, in Sanchez’s trial run as a starter, he was all right. A 3.55 ERA hid a 5.21 FIP and 4.64 xFIP before he got injured and was subsequently moved to the bullpen. When he returned on July 25, he was a completely different pitcher. This time, while he may not actually have deserved his 2.39 ERA, a 3.10 FIP and 3.33 xFIP showed he had made some kind of improvement. Or had he? After all, he only threw 26 innings in the second half of last season. And while there was undoubtedly a huge improvement for him in strikeout and walk rates, something else caught my attention. Take a look at Sanchez’s batted-ball type percentages from 2015:

Pretty clearly, Sanchez improved his batted-ball profile after becoming a reliever. His 2015 second-half ground-ball percentage of 67.6 percent would be the greatest of all of the 1281 qualified pitcher-seasons since 2002, when the statistic started being tracked. His fly-ball percentage of 18.3 percent, while not as extreme, would still rank as the ninth-lowest since 2002. That begs the question: would he be able to sustain those rates when he moved back to the rotation? The answer, as it always is with historically extreme rates, was no:

Both of his rates came crashing back to historically-accurate norms pretty much right away, and they continued to trend in the wrong direction as the season progressed. This, consequently, caused Sanchez’s xFIP to skyrocket. His strikeout and walk rates got worse from the first half of the 2016 season to the second, but only slightly. What really moved his xFIP was his fly-ball rate, which soared (pun intended — maybe I should do this for a living) from 21 percent to 31.8 percent. It’s difficult to say where Sanchez will go from here — after all, this was his first full season as a starter. If he can keep his fly-ball rate at last year’s 25.1 percent — which ranked fourth-lowest among qualified starters — he could still be a pretty decent starting pitcher, even with regression to a league-average HR/FB rate. What’d be even more impressive, though, is if he could keep his batted-ball rates at his numbers from the first half of 2016, which were among the league’s best. Perhaps with a full season under his belt, Sanchez may now have the stamina and endurance to achieve this feat. If he does, look out. If he doesn’t, you’re looking at an average guy.

David Price

Now that I’ve written nearly an entire article’s worth about one guy, let’s talk about another player from the AL East. Price, for much of his career, has been among the elite at the position. Before last season, the only time he had had an ERA above 3.50 was his first season as a starter back in 2009. Every year of his career, he’s been an above-average strikeout guy, but he topped even his own lofty standards when he struck out 27.1 percent of the batters he faced in the first half of 2016. He was unable to sustain that rate, and in the second half of the season he managed to strike out just 20.3 percent of batters, which would have been his lowest full-season rate since 2009. So what changed? Actually, it might have been the first half that was the fluke. Price allowed a 74.2 percent contact rate in the first half, contrasted with a 79.1 percent rate in the second. Those numbers don’t necessarily mean much on their own, but the difference is easy to spot when looking at his career rates:

Price’s whiff rate was higher than ever in the first half of 2016, but it’s tough to figure out why. Per Brooks Baseball, Price was generating swings and misses on his changeup at a career-best rate in the first half, but I couldn’t find any obvious changes to his velocity or movement on the pitch or any other. It’s fair to wonder, then, if his second-half numbers are what we should expect from Price at this point in his career, since his contact rates during that time were much more sustainable. He probably won’t be as bad as his 2016 3.99 ERA, but I wouldn’t be shocked to see it end up above 3.50 for the second year in a row.

Of course, this is not a comprehensive way to find overvalued pitchers. It’s a crude approach, but one that’s meant to highlight guys who fell off in the second half, as they’re the ones more likely to carry over those declined skills into 2017. That being said, xFIP obviously isn’t perfect, and these players all showed that they were capable of posting above-average results over half a season. Take a risk on them if you want, but be warned that they may not be worth the price.

The Good and the Bad: David Price Isn’t Sinking

You know his story: David Price is a $217-million man with a 4.74 earned run average, and the people of Boston aren’t happy. It’s another Crawford-Sandoval-Ramirez waste of money. Things are headed downhill for the 31-year old veteran. Or are they?

First, the bad news: the 2016 version of David Price has been worse than the 2015 David Price, and way worse than the top-caliber pitcher Boston signed him to be. And the ERA shows it.

The suspect is pitch selection, and the culprit is a sinker that doesn’t sink. Price has a two-seam fastball that over his seven-year career he has thrown some 30% of the time. In his prime, it clocked in at 94-95 mph, but since then he’s dropped almost two mph.

Usually, that level of velocity leak wouldn’t be a big deal, because if there’s enough movement and deception, batters will be fooled either way. But Price’s sinker is different.

Brooks Baseball reports that “His sinker has well above-average velocity, but has little sinking action compared to a true sinker and results in more fly balls compared to other pitchers.” Uh-oh. “Little sinking action?” There needs to be at least some element of vertical movement for a sinker to be fully effective, or, in Price’s case, a little extra velocity. But now he has neither.

The results show it. Last month, he surrendered 10 home runs, more than the previous two months combined. Also in June: 31% of his pitches were sinkers, nearly 10% more than the month before. Coincidence? I think not. He’s also allowing a .241 Isolated Power on sinkers, only three points less than Mike Trout this season. And maybe the most convincing statistic: hitters are pulling the ball 10% more than they did last year, which means they are making more solid contact and not having to stay back on his fastball. Price’s pitches are slower, and it’s making a difference.

Why is he losing velocity? There’s two possibilities and they point in completely opposite directions. The first is age. Price is 31 and he’s nearing the point where most starting pitchers start to fall on the aging curve and eke velocity. If this is the case, it’s going to be a long seven years for the Red Sox. But there is another possibility. Price has played in Tampa Bay for most of his career, where the temperatures are never 40 degrees like Boston in April. It’s entirely possible that the cold ‘froze’ him up this spring and as the season continues, he’ll regain his speed. Most likely, it’s a combination of both. But either way, it’s never a good sign when pitchers slow down.

Price has always gotten away with leaving sinkers up in the zone because they showed 94-95 mph on the radar gun. But now hitters are seeing 92mph fastballs fly straight down the middle of the plate and stay there.  Why doesn’t he just put the ball on a tee? Nine out of 10 major-league hitters will knock that pitch into the stands every time. Just look at the stats: He’s surrendered just two fewer home runs than he did last season even though he’s pitched 112 fewer innings (2015: 17, 2016: 15), and he’s allowed an average of 1.25 home runs per nine innings, which is 32 percent worse than his career average (0.84). Sinkers are sending the man to his grave.

They’re also killing his ERA. 38% of his earned runs are from home runs, and if you set his home runs to eight instead of 17, his ERA would be 4.01 instead of 4.74, a 0.73 difference. (8 is the number he had allowed last year at this point in the season.) In fact, his strikeout and walk totals are even better than last season, but the home runs negate all of it.

But we can’t blame everything on the sinker, either. Price has definitely been unlucky this season. His home run to fly ball ratio is 15.5%, an unsustainable mark, his .323 BABIP .035 more than his career average, and his LOB% 10 percent less than the 2016 league average. These will balance out in time. But his sinker is the real problem.

The only way to truly limit home runs is to limit fly balls, and for Price, the only way to limit fly balls is to stop throwing sinkers that don’t sink. The solution is (1) throw harder, or (2) find another pitch to replace his sinker. Option one is still TBD. Option two could be filled with either a change or slider — two pitches that he has used to complement his fastball but never to the level that he uses his sinker. The outlook is grim either way.

Price is still a very experienced pitcher, and once his HR/FB, LOB%, and BABIP rates come down to earth, things will even out. But if he wants to be successful for the Red Sox for the entirety of his stay, there’s a longer-term issue at stake, and if his velocity continues to leak, I’m not sure what type of David Price we’ll be looking at a year from now.


Taking a Look at David Price’s Turnaround

After signing a massive seven-year, 217-million-dollar contract with the Red Sox this past offseason, David Price got off to a slow start. After his May 7th start against the Yankees in which he gave up six earned runs in just 4.2 innings, Price’s ERA stood at a whopping 6.75 yet his peripherals remained strong. He had a 2.98 FIP and 11.5 K/9. However, he was giving up hard contact over 41 percent of the time. The immediate fix was a mechanical issue noticed by Dustin Pedroia that was limiting Price’s leg lift and diminishing his velocity. Frustrated with his failures, Price vowed to be better.

And better he has been. After throwing a gem in Sunday’s win over the Mariners where he went eight innings allowing his only run on a solo shot by Franklin Gutierrez, Price lowered his season ERA to a still high 4.24 and had his eighth straight quality start. Over those eight starts, Price has been much better, allowing 16 runs over 58.1 innings for an ERA of 2.47. During this stretch, he has a 3.88 FIP and 8.6 K/9 and has only allowed hard contact around 27 percent of the time. Although his strikeouts have gone down and his FIP went up due to his decrease in strikeouts to go with an increase in home runs allowed, Price has limited the amount of hard contact he has given up. This can be seen in the BABIP over the two stretches. In his first seven starts, his BABIP against was around .370, while in this current eight-start stretch it is hovering around .230.

This in turn, has allowed him to be very successful while pitching to contact. His biggest issue remains his ability to keep the ball in the park. Over his last eight starts, Price has allowed at least one home run in seven of them. So while he has limited hard contact against him, the few mistakes that he makes each game are punished. Despite this increase in home runs allowed, he continues to pitch well and go deep into games, allowing the Red Sox bullpen a chance to recover after the consistently shaky starts from their 4th and 5th starters.

There are a few main reasons to this improvement. The first was his ability to regain his velocity. Looking at his velocity each month thanks to data from Brooks Baseball, there is a small but steady increase in his average four-seam and sinker velocity. Before May 8th, his velocity was low by his standards. Typically a pitcher averaging 94 to 95 MPH with his fastball, he had been sitting 93 MPH.

Year Fourseam Sinker Change Curve Cutter
2016, Before May 8th 93.2 93.0 84.3 78.8 88.8

Although just a small dip in velocity, it made him much more hittable.

Since May 8th, his velocity has been back on the rise.

Year Fourseam Sinker Change Curve Cutter
2016, Since May 8th 94.2 93.4 85.0 78.3 89.0

After the mechanical change, his four-seam has been averaging around 94 MPH and his sinker has been averaging around 93 MPH, but still slightly up from what it was before. Although it is a small increase, this added velocity has helped Price dominate hitters, gain confidence, and re-establish himself as an ace.

Another key factor in this improvement has been his pitch usage. Using pitch data from Brooks Baseball, I was able to look at Price’s pitch usage. In his first seven starts, Price relied on mixing different types of fastballs with his main offspeed pitch being a change-up while also displaying the occasional curve.

Year Fourseam Sinker Cutter Curve Change
2016, Before May 8th 27.6 22.6 19.8 6.6 23.4

His four-seam was used around 28 percent of the time yet it lacked the movement displayed by his cutter and sinker. The high four-seam usage to go with decreased velocity spelled trouble for Price.

However, since May 8th, Price has made an adjustment displayed by the fact that he is now using his sinker as his primary pitch while also using his four-seam far less frequently.

Year Fourseam Sinker Cutter Curve Change
2016, Since May 8th 9.0 36.1 22.4 8.3 24.3

His sinker is now used around 36 percent of the time compared to his four-seam being used around nine percent of the time. With this added movement and velocity, Price has been able to be more effective while keeping the use of his curve, cutter, and changeup around the same. This simple switch from a four-seam to a sinker has allowed him to go on a tear.

Looking forward, the Red Sox need Price to continue to be the pitcher that he has been over his last eight starts. They are paying him ace money and he is expected to pitch like one down the stretch as Boston hopes to continue their great turnaround year. If Price continues to have outings like these, the Sox should like their chances come October with him taking the mound with their season on the line.


David Price Should Be Okay

(Written before Price dominated on Thursday)

Obviously there is some concern about David Price.  So I went and dove into his numbers to see what I could figure out. (All data below was obtained through FanGraphs, who coincidentally also wrote an article about Price, with similar methodology and results.)

So let’s start at the top and look at his ERA.

| ERA
—|—
Career | 3.19
3 Year Average | 3.01
2016 | 6.75

Yikes!  His ERA this season is more than twice what we’ve ever seen out of Price.  This is no surprise to anyone. But we all know that historical ERA isn’t really a good predictor of future ERA (it includes too much “noise” from things that the pitcher can’t control).  So let’s look at some metrics that are better indicators of the way he’s pitching.

| SIERA | xFIP
—|—|—-
Career | 3.36 | 3.34
3 Year Average | 3.09 | 3.07
2016 | 2.99 | 2.94

Okay, so according to both xFIP and SIERA, Price is actually pitching as well as he’s ever pitched.  Nothing to be concerned with here, and in fact we should be really happy with how he’s pitching.

In most cases, when a pitcher’s ERA is significantly higher or lower than their xFIP and SIERA, it can usually be chalked up to variance and you should expect things to settle back to their historical numbers.

Over his career Price’s ERA has actually outperformed his xFIP by almost half a run per 200 innings pitched.  Which makes it even more peculiar why this season his ERA would be *lagging* his xFIP by such a significant margin.

So let’s go a little deeper and try to figure out *why* his ERA is so much higher than his xFIP.

Well, the obvious first things that jump off the page are his BABIP and Left on Base % (LOB%)

| BABIP | LOB%
—|—|—-
Career | .286 | 75%
3 Year Average | .298 | 74%
2016 | .373 | 54%

His BABIP is 75 points higher than his three-year average and he’s stranding 20% fewer runners.  It’s easy to look at these numbers and say he’s just getting unlucky on balls in play and getting unlucky on batter sequencing.

The LOB% I can buy being just bad luck, but the BABIP I want to check on.  Let’s look at his batted ball profile and see how unlucky he’s been on balls in play:

| LD% | GB% | FB% | Soft % | Med % | Hard %
—|—|—-|—-|—-|—-|—-
Career | 20% | 44% | 36% | 18% | 56% | 27%
3 Year Average | 22% | 42% | 36% | 17% | 55% | 28%
2016 | 29% | 40% | 31% | 17% | 42% | 41%

Uh-oh.  His soft-hit and ground-ball ratios are constant, but in 2016 he’s giving up more line drives and harder contact by a significant margin.  Giving up more line drives and harder hit balls helps explain his elevated BABIP… It’s not just bad luck.  By my calculation his xBABIP based on this batted ball profile is .361.  That’s slightly lower than his actual BABIP (.373), but still way higher than his career average.

This is definitely a bit concerning, but let’s see if we can figure out why he’s giving up such hard contact.  First place I like to look is his command and velocity numbers.

| Fastball Velocity | Fastball %
—|—|—-
Career | 94.6 | 35%
3 Year Average | 93.6 | 23%
2016 | 91.8 | 12%

Another red flag.  His fastball velocity is down almost 2mph from his three-year average.  I did check, and his velocity went up about 1.5mph between April and August last year so we should see his velocity pick up as the year goes on, but this isn’t something you want to see out of a guy you just spent $217M on.  To go along with the reduced velocity, you are seeing Price rely way less on his four-seamer.  He’s basically replaced it with two-seam fastballs and cutters, hoping the movement he gets out of them makes up for the reduced velocity.

But how is he doing with his slightly altered pitch selection?

| K% | BB% | Zone % | Contact % | SwStr%
—|—|—-|—-|—-|—-
Career | 23% | 6% | 47% | 80% | 9%
3 Year Average | 25% | 4% | 48% | 79% | 10%
2016 | 29% | 7% | 48% | 71% | 14%

First takeaway is that his strikeouts are actually up!  Despite the reduced velocity, he’s striking out more batters and inducing more swing and misses.  These are good signs that his “stuff” is still there.

Not shown above, but he’s not getting guys to chase pitches like he used to (3% drop in swing rate on balls out of the zone compared to his three-year average), but on pitches in the zone he’s getting way *more* swing and misses (12% improvement on batter contact rate on pitches in the zone).

**So what does this all mean?**

As far as I can tell, Price will be fine.  He’s lost some velocity, so you are seeing him switch from a four-seam fastball to a two-seam fastball.  Because of the movement on these pitches, he’s getting more swing and misses when he throws strikes.  But with the drop in velocity, when guys do put the bat on the ball, they are doing so with more authority. What this means for Price is he will need to get his offspeed pitches working to keep batters off balance and induce more swings on pitches out of the zone.  Namely his changeup which has seen a big drop in value so far this year.

His LOB% should stabilize and if he can start commanding his changeup better, his BABIP should drop as well, which will make his ERA start to resemble that of the Price the Red Sox paid for this offseason.

The best news of all? It’s only May, so we have a lot of baseball left.  No need to panic yet, as far as I can tell.


Selling David Price

I’ve been thinking about this one a lot, and I think people in general still view Price as a top-10 pitcher. I’ve seen him appearing in expert lists as such, and that’s the general vibe I’ve gotten from the fantasy community. I just think top-10 at this point is too high, especially when we’ve got such talented young stars ranked below him, both according to the expert lists and public perception (I’m talking about guys like Archer, deGrom, and Cole).

I’d actually have him closer to top 20-25 at this point (there are so many great pitchers). His K/9 has plummeted to 7.6 and K-BB% has fallen nearly nine percentage points to 14.3%.

At 14.3%, David Price is the No. 39 pitcher in the league in K-BB%.

Am I putting too much stock into a small sample, or has the decline begun, but people haven’t realized it yet (he still sports a solid 3.15 ERA)?

His peripherals also support his regression, as his xFIP is 3.94 and SIERA is 3.87.

Encouraging signs: FIP still has him at 3.27. Swinging strikes are similar to last year at 10.4% (only 0.2% difference). No velocity loss — in fact, his fastball is faster this year than last year.

Over his career, however, Price has been only slightly better than average at giving up/suppressing home runs, so I think xFIP and SIERA are the better ERA estimators than FIP. League average HR/FB is 10.8%, and Price was at 9.7% last year, 8.6% in 2013, 10.5% in 2012. So he may be slightly better than average, but unlikely to maintain 6.6% going forward.

It’s also worth noting that last year’s 9.8 K/9 was a career high. In 2013, he had a 7.3 K/9. From 2010-2012 his K/9 hovered in the 8s (and in 2008 and 2009 his K/9 was also sub-8, although I don’t give any weight to that at all as he was still developing as a pitcher). It could be that his high K/9 last year was an aberration.

I’m choosing to give weight to his current K-rate and peripherals (the sample size is now significant), while accounting for some improvement (this is David Price after all). Doing that, by my rough calculations, I’m looking at about a 3.5+ ERA ~8 K/9 pitcher going forwards.

Those are quality numbers, but not top-10 numbers, which is where people still value him. I’d flip Price for any top-20 pitcher with upside in an instant.

I don’t have an answer as to why the K-rate has plummeted so far. I did take a look at his usages, and he seems to have reduced the usage of his two-seam fastball. His entire career, that has been his most-used pitch. Last year he used it 40%. This year, he’s only throwing it 23% of the time, instead favoring a four-seam fastball as his dominant pitch. I believe this *may* be related to his K-rate drop, but it’s just an observation at this point. Regardless, we’ve reached the point in the season where it might be wise to be proactive.