Archive for Carlos Gomez

Buying or Selling Carlos Gomez

What are you to do with a former fantasy superstar who hasn’t lived up to expectations? For some, the answer’s easy; Carlos Gomez has already been dropped in over 25% of leagues on both ESPN and Yahoo.

Now that I’ve driven half my audience away with my use of a semicolon, let’s start the real analysis. Gomez certainly disappointed his owners through the first month and change of the season, sporting a minuscule .486 OPS through May 15 before being placed on the DL. For reference, out of 324 batters with at least 100 plate appearances, just two (2) have a lower OPS as of June 24. Both are on the Braves (one hit fifth in the lineup as recently as June 21, while the other has batted second 13 times this season).

So yes, one could see why owners would have lost patience with Gomez. But this was also a player who hit 66 home runs and stole 111 bases while hitting .277 between 2012 and 2014. If anyone deserved patience, it was him.

So when he hit two home runs in his first six games back from the DL, it was hard to be too surprised. Since then, he’s put together five multi-hit performances, and has brought his season line back up to at least non-Atlanta-ish numbers.

While it’s obviously a small sample size, Gomez’s 76 plate appearances in 19 games since his return have shown immense improvement over his horrendous start to the season. To demonstrate this, take a look at each of the different areas in which he’s bounced back:

Plate Discipline
2012-2014 April 5 – May 15 May 31 – June 24
BB% 6.2% 5.3% 10.5%
K% 22.8% 34.8% 30.3%
BB/K .27 .15 .35
SwStr% 13.9% 19.4% 16.7%
O-Contact% 59.5% 42.4% 45.9%
Z-Contact% 84.4% 74.4% 80.5%
O-Swing% 37.4% 32.1% 35.7%
Z-Swing% 79.3% 79.9% 65.8%

I could bring up more player comparisons and show you just how bad the Atlanta Braves are this year, but that’s not the point of this article. Instead, let’s just focus on Gomez’s numbers and how they compare to earlier in the year and during his prime years. He’s nearly doubled his walk rate while striking out more than 10% less often than before, leading to a BB/K that is no longer painful to look at. He’s missing less frequently on pitches he swings at, both in and out of the zone, and has fewer swings-and-misses as a result. The one worrisome spot here is his swing rates, where the trend is the opposite of what we’d generally expect when we see favorable results. However, his O-Swing% is still lower than it was between 2012 and 2014, and it seems as though swinging less at pitches in the zone is leading to more walks and less bad contact, so it’s not truly a terrible result.

Batting and Power
2012-2014 April 5 – May 15 May 31 – June 24
AVG .277 .182 .294
BABIP .329 .293 .405
OBP .336 .238 .368
SLG .483 .248 .471
ISO .206 .066 .176
OPS .819 .486 .839
wOBA .356 .216 .364
wRC+ 123 28 129
HR/FB% 14.6% 0.0% 33.3%

I already referenced Gomez’s OPS above, but it’s still almost unbelievable to see that his post-injury slugging percentage is nearly as high as his OPS once was. Besides that, there’s improvement across the board. His average is up over 100 points, as his OBP, SLG, ISO, OPS, and wOBA. He’s gone from being 70% worse than the average hitter to 30% better. What’s good to see her is that he’s not outpacing any of his career stats by a noticeable amount — an indication that his current run is very much sustainable. Okay, maybe not the .385 BABIP, but as you’ll see next, keeping it over .300 shouldn’t be an issue.

Batted Ball Breakdown
2012-2014 April 5 – May 15 May 31 – June 24
GB% 39.3% 47.1% 44.2%
FB% 40.6% 35.7% 20.9%
LD% 20.1% 17.1% 34.9%
Pull% 42.7% 36.4% 62.2%
Cent% 33.9% 41.6% 13.3%
Oppo% 23.5% 22.1% 24.4%
Soft% 16.7% 29.9% 31.1%
Med% 48.0% 45.5% 28.9%
Hard% 35.3% 24.7% 40.0%

Let’s take this one at a time. First, Gomez has seen a drastic increase in his line-drive percentage, unfortunately at the expense of hitting fewer fly balls. While it’d be better to see him hit fewer ground balls and get some more balls in the air, he’s certainly making this approach work for him right now. He won’t hit 30 home runs with this approach, but with the increased line drives, he should have no problem continuing to hit for extra bases.

Then comes the confusing part. He’s increased both the percentages of balls he hits to the pull side and opposite of the field, now hitting just 13.3% of his balls to center. He was definitely spraying the ball better beforehand, although the bloated Pull% will undoubtedly help him to put up some better power numbers. If the numbers stay in this region, I’d definitely expect his BABIP to regress, but it’s more likely that they regress closer to his career norms. A lot of those pulled balls will end up going to center field.

Finally, there’s the stuff that’s easy to analyze. Hit the ball harder, get better results. Gomez apparently believes in that approach as well, now hitting the ball hard over a third of the time and showing over a 50% increase from his previous rate. He needs to work on hitting the ball soft less often, which should happen if he continues to be selective and wait for his pitch.

Statcast Data
2015 April 5 – May 15 May 31 – June 24
Exit Velocity (mph) 88.5 84.8 86.4
Exit Velocity on Line Drives and Fly Balls (mph) 92.7 91.2 96.4
Fly Ball Distance (feet) 315.2 309 359

Ah, Statcast. What would we do without your infinite wealth of knowledge? The data here was obtained through Baseball Savant, and confirms that Gomez is indeed hitting the ball harder than he was before his injury. His overall average exit velocity remains low, but his velocity on line drives and fly balls is actually higher than it was last year. He can hit all the slow ground balls he wants and still be successful, provided he can keep up this increased velocity on balls in the air. Of course, he’s not going to continue hitting his fly balls over 350 feet — that’s reserved for people like Byung Ho Park (and apparently Tyler Naquin?). But he’s at 323 feet for the season now, and which should easily suffice for him to begin putting up some rejuvenated power numbers.

If you’re looking for a tl;dr, here it is: Carlos Gomez is performing much better than he was earlier in the season. He’s taking more walks, striking out less, making more contact, and hitting the ball harder and farther (further?). It’s obviously a small sample size, and he may not put up another 20/40 season, but he’s more than capable of hitting 10 home runs and stealing 15 bases the rest of the way. While it’s not elite production, it’d be better than he did last year, which would be quite an achievement after his start to the season.

The Cleveland Indians as a Fringe Playoff Contender

It’s been a disappointing year thus far for the Cleveland Indians. They are currently 42-46 heading into the All-Star Game, and are in 4th place in the competitive American League Central division. They are underperforming their BaseRuns projection by 4 wins, meaning the computers view this team as much more of a playoff threat than they actually have been thus far. Although they have the third-highest remaining projected winning percentage in the AL at .532, their rough first half has them only finishing with about 81 wins. As wide open as the wild card race is, a .500 finish would clearly not be enough. What has happened to everyone’s preseason sleeper team? Besides Sports Illustrated jinxing them of course.

Well as expected, they have had stellar starting pitching from the likes of Corey Kluber, Carlos Carrasco, Trevor Bauer, and Danny Salazar, and even have gotten good outings recently from under the radar prospect Cody Anderson. Everyone knew they had a bad defense, but many thought that the Indians’ offense could support the great starting pitching enough to propel them into the postseason. Thus far, however, that has not been the case. They are at league average or below in almost all offensive categories. They are not a power hitting team by any means, and have the 10th lowest FB% in the MLB, which makes sense seeing as to hit for power you need to get the ball in the air. However, they still run the 7th lowest BABIP in baseball, which insinuates that they have a lot of hitters who tend to roll over a lot. Lo and behold, they are 3rd in Pull %, and have a lefty heavy—heavy being an understatement—lineup.

Essentially, the Indians have amassed a lineup with a bunch of pull-happy hitters who don’t hit for much power, which doesn’t work in a league that nowadays uses the shift religiously. I think all Cleveland fans know where I’m going with this, because the phrase has been overused by Tribe fans for almost a decade now. Yes, Cleveland is lacking an impact right-handed bat. Brewer’s prized prospect Matt LaPorta was supposed to be that guy when the Indians traded C.C. Sabathia for him and others—including player to be named later Michael Brantley. However, his MLB career was as successful as Kim Kardashian’s first marriage. Ironically or not, Milwaukee has another player that I believe can push the Tribe over the hump; his name is Carlos Gomez.

The 29 year old native of the Dominican Republic, known for his fiery personality, has been extremely productive for the Brew Crew since 2011, racking up 18.4 WAR in that 4 year span. With Milwaukee sitting at the halfway point with the second worst record in all of baseball, they will most definitely be sellers at the trade deadline. I recently tweeted FanGraphs’ Jeff Sullivan asking him if Gomez would be dealt, to which he responded, “Gomez is probably moving. Lucroy not.” That doesn’t mean it is set in stone, but that shows that there is a decent chance he gets traded. Let’s just assume for arguments sake that the Indians and Brewers have mutual interest in being trade partners. Why should the Indians’ make the move?

One plus is that Gomez wouldn’t be a rental. He is under contract through 2016, and is only set to make 9 million dollars next year. If you consider 1 WAR to be worth roughly 7 million dollars, Gomez’s average of 6.6 WAR per year the last two seasons would be a huge bargain for the Tribe. With the contracts of David Murphy and Ryan Raburn likely to be coming off the books next year, an extra 9 million dollars on the payroll will be inconsequential for the notoriously conservative Dolan family. Gomez also would provide a major upgrade from primary Tribe center fielder, Michael Bourn. I have included a chart that compares their averages from the last two seasons. Why two seasons? Because that’s when Bourn signed with Cleveland, where he has not been the same player he once was.

Name Avg. WAR Avg. wRC Avg. RISP Avg. DEF Avg. ISO Avg. SLG Total PA
Bourn 1.3 53 0.298 -3.3 0.101 0.360 1,062
Gomez 6.6 93 0.298 17.2 0.208 0.492 1,234


It is easy to see who has been the more valuable player. The reason I included ISO and SLG was to demonstrate Gomez’s excellent power, not necessarily to compare it to Bourn’s (because that is not the type of hitter he is). Gomez would provide a major upgrade defensively – where the Indians struggle – and at the plate, where he is a key catalyst in manufacturing runs. Gomez has created almost 40 more runs per season than Bourn the last two years. If you take into account how every 10 runs scored or given up equates to a win or a loss, those extra 40 runs would essentially add on about 4 more wins to the Indians win total (assuming those averages hold up throughout the 2015 season). So that would take the roughly 81 win Indians and make them an 85 win team; better yes, but still not a playoff contender.

Although Bourn and Gomez have been equally as good with RISP, this season has been a different story; Bourn is hitting .216 in 68 PA and Gomez is hitting .381 in 65 PA with RISP. The Indians have the 7th worst average with RISP this season at .230, with the MLB average being .255. For a team that struggles to score runs, this would be a huge difference. Slotting Gomez in the lineup everyday behind a guy like Michael Brantley would also take a ton of pressure off of him to carry the team day in and day out.

So what does this all mean? Could Carlos Gomez really propel the Tribe into October baseball this season? Probably not. Here are their season splits against teams above and below .500.

               Wins Losses Winning Percentage
Teams ≥ .500 24 32 0.429
Teams < .500 18 14 0.563


They struggle against good teams, and beat bad ones. That is not the mark of a playoff team. In the last 74 games of the season, the average winning percentage for teams they play is .515. While I fully believe the team could make a strong second half push – I actually believe they will make the playoffs – it is not likely. Still, a trade for Carlos Gomez would not only aid them in the second half of this season, but for next season as well. Clevelanders are sick of hearing “we’re building for the future.” The Indians have an extremely strong core, one that is young and locked into team-friendly contracts. It is time to win now, because they would hate to look back years from now like a reminiscent ex-lover and say, “That was the team that got away.”


Hit Batters as Collateral Damage of Rising Strikeout Rates

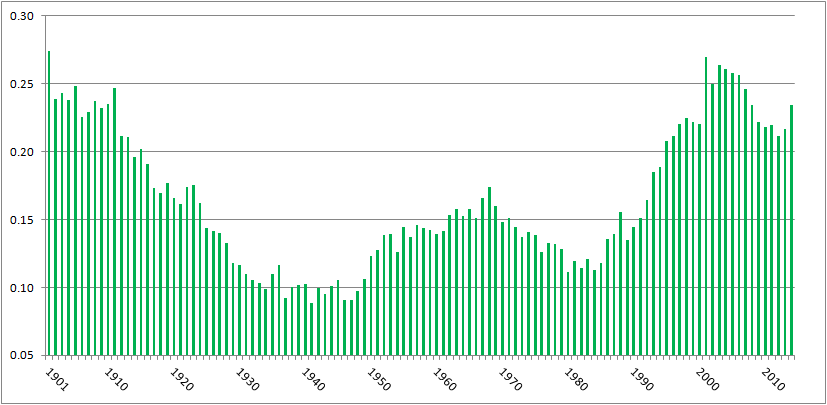
In the past, I’ve written about batters being hit by pitches–specifically, how the rate of hit batters is near all-time highs yet it hasn’t generated much, if any, outcry. Here’s a chart of hit batters per game, from 1901 (the start of the two-league era) to 2014:

HBP per game, 2001-2014

There were 0.68 hit batters per game in 2014, the eleventh-highest total over 115 years of two-league play. The top ten years, in order, have a 21st century slant: 2001, 2004, 2003, 2006, 1901, 2005, 2007, 2002, 2008, 1911.

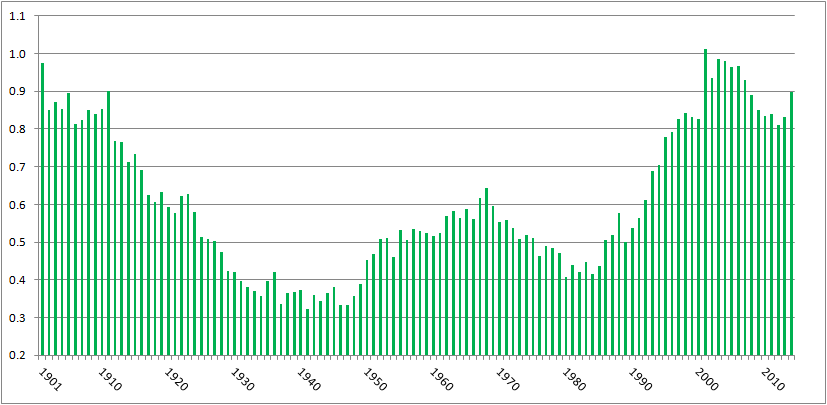
Or, pretty much the same chart, here’s hit batters per 100 plate appearances:

HBP per 100 PA

There were 0.898 batters hit per 100 plate appearances in 2014, the tenth highest amount in the two-league era. The ten top years are, in order, 2001, 2003, 2004, 1901, 2006, 2005, 2002, 2007, 1911, and 2014.

Commenter jaysfan suggested that the modern emphasis on going deep into counts has changed the number of pitches thrown per game, so perhaps hit batters per pitch haven’t changed much. It turns out the pattern still holds. Here’s a graph of hit by pitch per 100 pitches, using actual pitch counts from FanGraphs for 2002 to present, and Tom Tango’s formula of Pitches = 3.3 x plate appearances + 1.5 x strikeouts + 2.2 x walks for the preceding years:

HBP per 100 pitches

With 0.234 hit batters per 100 pitches, 2014 ranks 16th all time, behind 1901-1905, 1908, 1910, 1911, and every year from 2001 to 2007. Again, a pronounced millennial bias. (Source for all the above graphs: Baseball Reference and FanGraphs)

It’s clear, then, that we’re seeing batters getting hit at the highest rate in a century. I tried to figure out why, and came up dry. Left-handed batters, who face a wider strike zone than righties, aren’t leaning across the plate and thereby getting hit at a proportionately higher rate. HBPs are not inversely correlated to power, with pitchers more willing to pitch inside now to hitters who less frequently pull inside pitches down the line and over the fence. College graduates are slightly more likely to get hit by pitches than other hitters, but not enough to explain the change. Batters setting up deeper in the batter’s box, as measured by catcher’s interference calls, isn’t correlated to HBPs.

However, commenter Peter Jensen noted, “I don’t think there is any question that pitchers throw more to the edges of the strike zone when they are ahead in the count. This could be confirmed with a pretty simple Pitch Fx study. And if they pitch to the edge more they are also going to miss inside more (and outside more) so this could partially or even wholly account for why there are more HBPs in pitcher counts.”

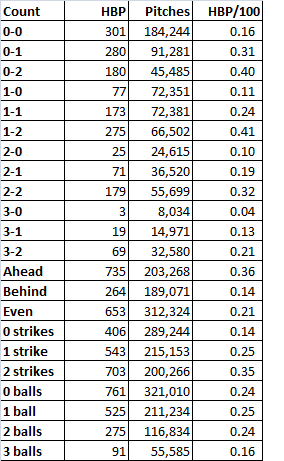
I did the PITCHf/x study Peter suggested. Using Baseball Savant data, I looked at hit by pitch by count, and as Peter found when he studied the data from 1997 and 2013, HBPs occur more when pitchers are ahead on the count. Here are the data from 2014:

2014 HBP

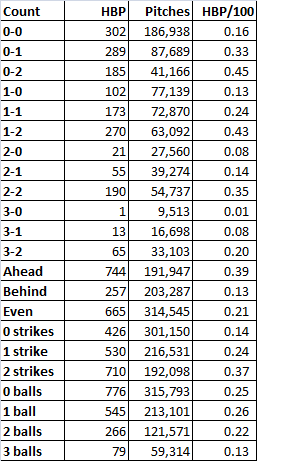
When the pitcher was ahead on the count, the batter was nearly three times as likely to get hit as when the batter was ahead. The most common counts for hit batters: 1-2, 0-2, and 2-2, and 0-1, all counts that encouraged pitchers to try to get batters to chase pitches on the border of the strike zone. Is this trend consistent? Baseball Savant’s data go back only to 2008, but using that season’s data, yes, the trend’s unchanged:

2008 HBP

Same thing. Batters are three times more likely to get hit when the pitcher’s ahead on the count, and the three most common HBP counts are two strikes with zero, one, or two balls, followed by 0-1.

So why the increase in hit batters? It appears that, as Peter implied, it’s because of the increase in strikeouts. Every three strike count requires a two strike count, obviously. In 2008, 22% of at bats went to 0-2 counts, 34% went to 1-2, and 29% went to 2-2. In 2014, those percentages had risen to 25%, 36%, and 30%, respectively, in line with the increase in strikeouts from 17.5% of plate appearances to 20.4%. The route to three strikes, which is being traveled more frequently, includes the four counts most likely to result in a hit batter. That’s why we’re seeing batters hit by pitches at rates not seen since before the first World War.

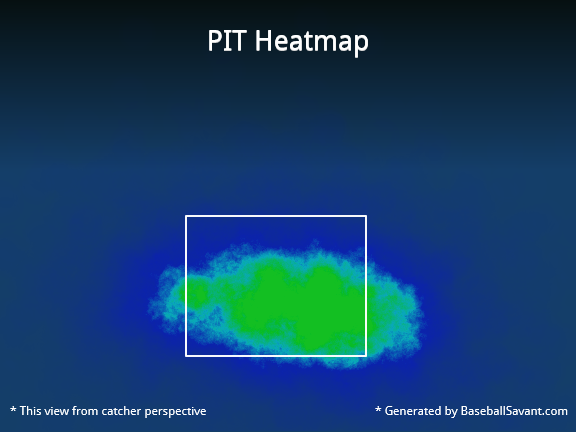
Here’s a graphical representation. In 2014, the Pirates led the majors in hit batters, handily, with 88. Here’s where Pirates pitchers threw on the hitters’ counts of 1-0. 2-0, 3-0, and 3-1:

Those greenish-yellow areas in the middle of the zone indicate that when the pitchers fell behind, they tended to locate their pitches in the strike zone. By contrast, check out the location for pitches thrown on 0-1, 0-2, 1-2, and 2-2 counts, when the pitcher could waste a pitch trying to get the batter to chase it:

That’s a much less concentrated blob, with a higher percentage of pitches outside the strike zone, where the batter can get hit.

As a final check, I ran a correlation between strikeouts per plate appearance and hit batters per plate appearance post-World War II. The correlation coefficient’s 0.82. That’s pretty high, suggesting a link between strikeouts and batters getting hit. Granted, correlation is not causation. But given that there’s an empirical link–to get to three strikes, you have to get to two, and batters with two strikes are at the highest risk of getting hit by a pitch–it’s enough to make me believe that while there are a lot of reasons more batters are getting hit by pitches, a major explanation is that hit batters are a consequence of rising strikeout rates.

CODA: If there were a day last season that I thought might’ve turned to tide on batters getting hit by pitch, it was Thursday, September 11. That day, there were 15 HBPs in 11 games. That doesn’t include the horrific fastball to the face that ended Giancarlo Stanton’s season; that pitch was a strike. A lot of stars got hit: Stanton, Mike Trout (twice), Yoenis Cespedes, Carlos Gomez, Jayson Werth. Tampa Bay’s Brad Boxberger hit Derek Jeter in the elbow. Had that pitch ended Jeter’s farewell tour, I really think it would’ve created an issue of rising HBP rates. Fortunately for Jeter and purveyors of Jeter memorabilia, it didn’t. But taking the 15 hit batters together, plus Stanton, and excluding two obvious retaliation jobs (Anthony DeSclafani hitting Gomez after Stanton got hit, Joe Smith hitting Tomas Telis after Trout got hit a second time), the fourteen hit batsmen occurred on six 0-1 counts (including Stanton and Jeter), three 1-2 counts, two 1-1 counts, and one count each of 0-0, 2-1, and 2-2. There was only one HBP with the batter ahead on the count, and ten occurred on the four counts identified here as the most dangerous for batters.