Archive for Carlos Carrasco

Luis Castillo’s Dominance Fades to Black

Some say the sample size of Luis Castillo’s season is 15 starts; I say it’s only eight.

July 25th was the first game in which BrooksBaseball.net registered a sinker from the 24-year-old. While some other sites show blips of the pitch peering out from behind the curtain – misread changeups? – you’ll read elsewhere that he learned the pitch right as the August sun crept up on the city of Cincinnati. After adopting the sinker, his following eight starts showed a clearer picture of the pitcher he’ll be in 2018.

The issue that resonated most with analysts during his debut at the end of June was his fastball’s tendency to stay straight. An old adage you’ll hear in baseball circles revolves around a straight fastball’s velocity mattering less, because if it’s a straight 98-99 mph pitch, theoretically, a major-league hitter will have a better chance of squaring it up.

Castillo never got that memo.

Unless the Yankees’ ace Luis Severino concentrates some adrenaline to kick up his average fastball velocity by season’s end, Castillo will claim the “velo crown” for starting pitchers – 97.8mph is his number (min. 200 pitches). While velocity doesn’t tell the whole story – I’m looking at you, 2016 Nathan Eovaldi, and your 97.8mph average four-seamer – for Castillo it’s a catchy interlude; a hook that gets your undivided attention. Even with the pitch and its “straight” tendencies, aggregating all 15 of his starts, the pitch maintained a whiff-per-swing rate inside the 85th percentile among all starters – 22.6% (min. 200 pitches).

It may seem dubious that the hardest fastball among starters in all of baseball could get better during any stretch of time, but Castillo wove into his repertoire a sinker that allowed his four-seamer to change its attack.

Above we’re looking at Castillo’s four-seam fastball location pre-sinker adoption (before July 24th) and post-sinker adoption (July 25th forward). The former being a tight concentration towards the outside part of the plate, while the latter is the much larger area of dark red, up in the zone.

This philosophy makes sense; take a straight fastball, stop throwing it for strikes down in the zone, and put it at the letters, making it nearly impossible for hitters to muster success. It worked. Castillo wasn’t able to execute this move sooner because he didn’t have another fastball to establish the zone with early in starts.

Before Castillo’s sinker, hitters were teeing off on Castillo’s fastball to the tune of a .658 slugging percentage. All the while, his slider and changeup – which we’ll touch upon shortly – were nearly unhittable with slugging percentages that couldn’t edge past the fabled “Mendoza Line.” After Castillo learned his sinker, that cringe-worthy slugging percentage on his four-seamer fell to a manageable .368. His sinker, meanwhile, was his early-count pitch, and he located it unbelievably well. Castillo’s worm-killer was second among starters with a 77% grounder-per-ball-in-play rate, trailing only Jordan Zimmermann, who can’t sniff the whiff rates of our Dominican-born phenom (almost as good as Carrasco’s sinker). As Eno Sarris mentions in a FanGraphs column, Castillo is creating a duo of skills that most pitchers envy: choppers and whiffs.

Those whiffs come from his slider and changeup, two pitches that stood out before the sinker, becoming much easier to “arrive at” in terms of sequencing with a two-percent cut in walks and improved ability to get ahead of hitters. His changeup – like with most righties – is a put-away pitch to left-handers; 33% usage rate overall that kicked up to 43% when Castillo had two strikes on a lefty. The sinker we’ve discussed at length also seems to correlate with an uptick in slider usage to left-handed hitters. It ticks up 8% when Castillo has two strikes on a hitter. My speculation is this has a bit to do with gaining confidence in the pitch through understanding eye-level adjustments that hitters have to make after realizing Castillo is now living up in the zone with his four-seamer (see the GIF above). Of course, this is merely speculation; it could easily be Castillo becoming more comfortable with the break of the pitch, eliminating fears that he doesn’t follow-through and leave it up in the zone – essentially a meatball.

Sitting just below Castillo’s changeup in terms of velocity is his preferred put-away pitch to right-handers, a compact slider that doesn’t jump out in terms of swinging strike rate, velocity, or even movement, but possesses an uncanny ability to avoid becoming line drives. A peculiar metric to stand out in, yes, but after understanding line drives go for hits three times more often than ground balls, limiting line drives becomes the best thing you can do if you’re offering a pitch devoid of Kershaw-territory whiff rates.

A 27% strikeout rate in just under 90 innings, with a ground-ball rate near 59%, is a combination very few pitchers possess; Castillo is one of them. With his sinker in play, those numbers became 25% and 61% respectively; just as dominant, yet more stable with the improved control I’d speculate the sinker brought about. I’ve heard a lot of Luis Severino and Michael Fulmer comparisons to Castillo because of the fastball-slider-changeup offerings, but one of the best young pitchers in baseball is becoming a unique beast with his sinker.

Castillo’s potential is the good kind of unbelievable, in contrast to another kind of unbelievable from this Cincinnati.com article titled, “Bryan Price: Luis Castillo is in the 2018 Rotation” which implies we needed to know one of the best young pitchers in all of baseball will be allowed to dominate as a starter come March 29th of 2018. March? Yes, March. Baseball and snow is quite possibly my second favorite pairing. Behind, of course, the whiffs and grounders Castillo generates.

A version of this post can be found on my site, BigThreeSports.com.

I’m on Twitter @LanceBrozdow


One of the Best Ground-Ball Pitches in Baseball Isn’t a Sinker

If it weren’t for Adam Engel, Carlos Carrasco would have shut out the Chicago White Sox on Wednesday night. It’s hard to believe something stood out to me more than the preceding sentence’s qualifier, but baseball possesses the quality of unpredictability, and I will never complain.

Carrasco is an artist, mixing five pitches with such care that I often find myself gravitating towards his starts despite my lack of association with the Indians’ fan base. On Wednesday, what I noticed more than Engel ruining a shutout was Carrasco veering away from a pitch vital to his repertoire — his changeup. Due to the graces of BrooksBaseball.net, I can confirm the lack of changeup usage was unusual for Carrasco; five instances of the pitch were his second-fewest in any start this season. Wednesday was the longest outing of Carrasco’s season and matched his season-high “game score” of 89 (50 is average) from a battle back on April 22nd against — you guessed it — the White Sox.

Carrasco’s beauty stems from his ability to execute flawlessly with a game plan contrary to what you would expect. His season averages reflect the bigger picture, yet on a given night he can meander in unprecedented directions. My wonder surrounding the lack of his usual third pitch brought me to another contrarian aspect of Carrasco’s game: this changeup possessed the best ground-ball per ball-in-play ratio of any pitch in baseball (min. 200 pitches). 82% of the time when contact is made between the lines, the batted-ball result of this changeup is a ground ball. With 6% of batted balls falling into the “fly-ball” category, Carrasco’s pitch is one of the hardest in baseball to hit in the air.

Does this make it the best changeup in baseball? That depends on what qualities you believe make a changeup great. Per FanGraphs, Clayton Kershaw — shocker — holds the highest pitch value for a changeup at 6.9 runs per 100 pitches (0.0 is an average offering), with Carrasco just behind him. If you subscribe to limiting line drives as the better indicator of changeup success, the honor would go to Stephen Strasburg, who coincidentally gets the most whiffs per swing on his changeup at 51%. I’m not arguing that Carrasco has the best changeup in baseball; I’m highlighting how absurdly hard it is to do anything but hit Carrasco’s changeup on the ground. That in itself deserves as much attention as one that generates excessive swings, or is throw by the left hand of a legend — I tip my hat to you, Mr. Kershaw.

If you read my most recent recent column on the Orioles’ Dylan Bundy — whom I already consider to be “great” (yeah, pretty bold) — you can tell I’ve become intrigued by the Baseball Prospectus rabbit hole that is pitch-tunneling. In as simple terms as you can get, the “tunnel point” is where the hitter has to decide whether or not to swing, with movement more than 2.6 inches between the tunnel point and home plate considered above-average. The concept is fresh, with only bits of hard evidence for suggesting how to correctly apply the statistic, but one of its beliefs makes intuitive sense. In a vacuum, if your pitch moves more than average beyond the tunnel point, it becomes harder to hit. My thinking with Carrasco’s changeup is simple: it must have a lot of downward, “late” break to force hitters into topping the ball at such a high rate.

Ah, if only baseball was that easy.

Carrasco’s pitch sequence of fastball-changeup is his fourth-most commonly used pitch pair; it doesn’t stand out in terms of post-tunnel break among his other pitch pairings, nor when you compare that break back to the league average for a typical fastball-changeup sequence. What it does stand out on is something called “flight-time differential.” Carrasco’s .0223 is the third-lowest in baseball among pitchers who have thrown a fastball-changeup sequence more than 50 times. This stat is another way to show velocity differences between pitches. The short flight-time differential holds up when we observe Carrasco’s 5.7 mph difference between his average fastball and changeup velocities (fourth-smallest, qualified pitchers).

Good news: this all jives with Harry Pavlidis’ research. Harder changeups with smaller velocity differentials between that pitcher’s fastball means more ground balls, while a larger velocity gap between the two pitches means more whiffs. While ground-ball inducers tend to throw their change earlier in counts, whiff inducers favor the pitch as a put-away offering. While that sentence isn’t all-encompassing, Carrasco’s deviation from conformity continues.

As with most right-handed pitchers, Carrasco tends to throw his changeup to left-handed bats substantially more than right-handed bats, favoring the benefits of arm-side movement a changeup generally possesses due to the pronation of a pitcher’s hand. But unlike conventional thought that suggests the pitch’s ground-ball rate is such that early-count looks are likely, Carrasco throws the pitch more as he gets deeper into counts.

Just as Carrasco plays second fiddle to Corey Kluber in the Indians rotation, his changeup plays second fiddle to his slider, both allowing for rampant underappreciation. The pitch is so good this year that Carrasco has muddied the stigma that high-velocity, or low-velocity differential, changeups should remain early-count offerings. Once again, Carrasco is veering from the path of predictability.

Even after four seasons where progressive improvement hasn’t ceased, due to injuries we still haven’t seen a 200-inning campaign from the righty. 2018 will be his age-31 season, and as father time comes knocking, it’s unfortunate that we may be observing the tail end of Carrasco’s peak performance. With the Indians firmly intertwined with the phrase “playoff bound,” Carrasco will get his first reps on an October mound. If history provides any indication of the future, we know Carrasco will both stand out from him predecessors and succeed.

In regards to an obscure September outing and the lack of changeup usage, digging deeper might unearth logical reasoning, but with Carrasco, I think mystery adds to the legend of an under-the-radar arm.


I can be found on Twitter – @LanceBrozdow – tweeting about the greatest of all games.

A version of this post can be found on my website, BigThreeSports.


In Dylan Bundy, the Orioles Have Hope

Confusion and “what ifs” among the industry on Orioles’ starter Dylan Bundy are everywhere, so I’ll cut through the present state of takes like a knife: Bundy is a great starting pitcher.

Red flags and disapproval rise because of circumstances surrounding Bundy that make it easy to dislike his past, present, and even future. I get it. His struggles with injuries, and Baltimore notoriously failing to develop viable starters, are two tenets the anti-Bundy fan club champions. But when any pitcher puts together multiple oh-my-god outings at different points in a season, underlying causes for those sprinkles of success reveal important trends.

One theme in Bundy’s flashes of success is a pitch the Orioles nixed as an option in the past, fearing excessive stress on his elbow. Some call it a slider, others a cutter, and the Baltimore Sun moderates the argument with a simple hyphen. It’s a pitch that possesses average to below-average break on both horizontal and vertical planes, yet still generates impressive swing-and-miss capabilities. Bundy’s cutter-slider — the Baltimore Sun method of indifference — sits fifth in whiffs generated per swing among pitches that Baseball Prospectus classifies as a “slider” (95th percentile, >200 pitches thrown). The four names above Bundy are Corey Kluber, Carlos Carrasco, Max Scherzer, and Mike Clevinger. Three objectively great pitchers, and an up-and-comer who I’ve profiled before.

Despite possessing average movement, the pitch might benefit from Bundy’s ability to tunnel all of his pitches.

Baseball Prospectus has taken the plunge in quantifying “tunneling” to the masses, and although intimidating at first, the theory makes intuitive sense. The “tunnel point” is the point in time where hitters have to make a decision whether or not to swing, and if hacking, where to do so. Above-average movement past the tunnel point would seemingly make a pitch harder to hit.

Bundy’s “Break Differential” — how much spin-induced movement is generated between the tunnel point and home plate — is 3.7 inches, substantially higher than the major-league average mark of 2.6 inches (87th percentile, 1,000+ pitch pairs). Bundy is also in the 85th percentile for a metric that signals how closely nestled his pitches are at the point of tunnel, known as the “Break:Tunnel Ratio.” We can’t say with certainty that his cutter-slider is the main culprit for this particular kind of niche success, but with the knowledge he uses it more often than any other non-four-seam pitch — especially in two-strike counts — we can infer it has some inflationary quality in this new-age stat.

Inflator number two might be the pitch that takes a back seat to Bundy’s cutter-slider, his changeup.

Bundy’s approach against right-handers is 75% fastball and cutter-slider usage, while versus left-handers, his mix in terms of offspeed is relatively even between the cutter-slider and his other three pitches, with this changeup basking in the spotlight of favoritism at 20%. Bundy uses this changeup when he needs a strike, as the pitch is seen more than three times more often when he is behind in the count rather than ahead, regardless of batter handedness.

After he gets back into counts with his changeup, he turns to the cutter-slider to put away hitters.

The frequency at which he uses his slider, at any point in an at bat, is what simple analysis says correlates to his overall success.

If just throwing his slider more was the reason for his recent success, Bundy’s xFIP in particular wouldn’t be half a run lower in his most recent set of games.

Jeff Sullivan of FanGraphs mentions that Bundy has gone up in the zone to lefties more often in August, but the effect that approach has on his other pitchers stands out the most. Combing through Bundy’s approach to left-handers and right-handers, you’ll notice an uptick in slider usage, but perhaps the most impressive change is his new ability to strike out left-handers. While his strikeout rate versus right-handers has stayed around the 24-28% mark for most of the season — reaching a high of near 30% in his most recent starts — lefties’ ability to solve the righty have dwindled.

Meddling around 12% for the first four months of the season, in Bundy’s most recent seven starts, that left-hander strikeout rate has more than doubled to 26%. This was the missing piece that allowed him to post a 28% strikeout rate over than span. His ability to pitch up in the zone to lefties allowed for the other pitches in his arsenal to flourish, and as a result, Bundy has become more confident with his cutter-slider, evidenced by its usage. The key is not only using the cutter-slider more, but combining that usage with an approach that makes the pitch more effective, particularly to left-handed bats. Overall trends in Bundy’s game have allowed individual pitches to become more effective, and with his innate ability to deceive hitters post-tunnel point, Baltimore is seeing the potential start to blossom.

In Dylan Bundy, the Orioles have something their fan base has longed for; a 24-year-old arm with an enviable arsenal and the ability to tunnel his pitches in a way that makes each independent part more deadly. There have been growing pains, but his tools have become skills at the major-league level, and it’s hard for me to doubt his intermittent dominance isn’t a sign of greater polishing. Although it would be naive to say his cutter usage is directly tied to good starts, Bundy’s Labor Day meltdown is highlighted by reliance on his fastball and his lowest cutter-slider usage since the beginning of July — sub 20%. Whether the downtick in cutter-slider usage on Monday was because because of comfort with the pitch, or a want to focus elsewhere, at least the Orioles know where Bundy’s strengths are when he spins a great outing.

Use your offspeed, Bundy, and may the baseball gods grant you health like no other. Those are the primary factors to make the step from possessing great skills to being an elite arm.


A version of this post can be found at BigThreeSports.com

Lance Brozdowski can be found on Twitter as well, @LanceBrozdow


The Improvement of the Indians Starting Rotation

Remember at the end of last season and before this season when we all foresaw an Indians rotation that could possibly feature somewhere between 2 and 5 really good, and possibly great, starting pitchers?  Don’t get bogged down on the slight exaggeration of that 1st sentence – To recap what we were looking at coming into this season for the Indians’ rotation:  Corey Kluber won the 2014 AL Cy-Young; Carlos Carrasco had a string of starts to end 2014 in which he seemingly (finally) figured out how to harness all of his powers in a bid to ascend his name to an echelon where only Clayton Kershaw’s name resides; Danny Salazar has always had elite swing and miss stuff and was also excellent in the second half of 2014;  Trevor Bauer and his Costco-sized arsenal of pitches have made some of us incredulously, if not warily optimistic since he was taken 3rd overall in 2011; and even T.J. House made us pause and take notice with his strong second half of 2014.

Then, like hype men with a special blend of Cleveland Kool-Aid being intravenously administered, Eno Sarris and Daniel Schwartz posted one of my favorite FanGraphs articles ever, Pitch Arsenal Score Part Deux, and the anticipation over the Indians’ rotation pulsated like a vein in the neck of John Rambo in the midst of fleeing from man-hunters.

The supporting cast, the lineup, looked poised to support the staff with plenty of runs.  Returning would be: break out star Michael Brantley; bounce-back candidate Jason Kipnis; now-full-time-first-basemen, Carlos Santana; a supposedly healthy Michael Bourn; an offense-first but totally-respectable-defensively, Yan Gomes; and an actually-not-that-horrible-in-2014, Lonnie Chisenhall.  Slugger Brandon Moss, and contact-happy-supposedly-glove-first Jose Ramirez had secured full-time spots as well in RF and SS respectively.  So even though it wasn’t without flaws, it seemed like they would allow the pitchers to rack up plenty of fantasy-relevant wins.

Note: This post isn’t about the disappointment of the Indians, though they have been disappointing; it’s more about what factors beyond luck have contributed to the numbers of the Indians’ starting rotation at various points throughout the year, and the disparity (big or small) between the pitchers’ rates and predictors at those points.

The Indians’ starting pitchers, or at least the top 4 (Kluber, Carrasco, Salazar, and Bauer) have, for the most part, been putting up good, albeit, inconsistent numbers all year despite posting some elite peripheral rates and ERA indicators.  A number of reasons have caused these numbers to grow apart (bad), come together, and then grow apart again (good).  Luck can work like a bit of a pendulum, swinging from one extreme, through the middle, and to the other extreme before evening out and that is at the core of what the Indians’ starting pitchers have experienced this year — although they have yet to experience the final stabilization phase.

We will examine plenty of numbers (Beginning of season to August 18th) based on this time frame: (Spoiler alert – this article is long and dense, and this timeline serves as a sort of cliff notes as to how the staff’s numbers have improved throughout the year – so if you’re the type of person who feels like looking at a bunch of data is superfluous when the bullet points are in front of your eyes, just read the timeline and be done with it.)
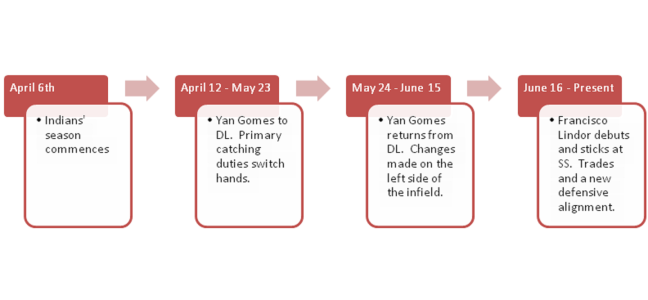
timeline

April 6th – May 23rd/May 24th – June 15th

One week into the season, before it was evident that the team’s defense was very sub-par, Yan Gomes hurt his knee and hit the disabled list for over a month.  Roberto Perez filled in quite nicely, and looking at just a couple numbers, could be considered the more valuable catcher (1.4 WAR compared to 0.5 WAR for Gomes).  Brett Hayes (0.0 WAR) was called up and was the secondary catcher during this period.  Behold, a table from StatCorner:

statcorner


Perez has had the least amount of pitches in the zone called balls and the most amounts of pitches out of the zone called strikes.  Overall, despite receiving fewer pitches than Gomes, he has saved more runs (4 DRS to Gomes’ 1) and their caught stealing rates are basically identical with a slight edge going to Perez – 38% to Gomes’ 35%.  Gomes was much better in terms of framing in 2014, and it’s possible the knee injury has limited his skills all around this season.  Anyways, from April 6th – May 23rd, the combined stats of Kluber, Salazar, Carrasco, and Bauer look like this:

ERA FIP xFIP SIERA K-BB% GB%
Kluber 3.49 2.16 2.46 2.51 25.3 48.6
Salazar 3.50 3.27 2.46 2.30 28.7 43.8
Carrasco 4.74 2.60 2.67 2.82 22.3 48.9
Bauer 3.13 3.23 4.09 3.94 14.2 35.7
3.75 22.7 44.7

Gomes returned as the primary catcher on 05/24, and from that point through June 15th, the cumulative numbers aren’t too different, although there is a dip in both K-BB% and GB% that we’ll have to look into.

ERA FIP xFIP SIERA K-BB% GB%
Kluber 3.67 3.26 3.20 3.19 19.8 43.8
Salazar 3.60 3.72 3.36 3.43 17.3 47.7
Carrasco 3.65 2.83 3.29 3.17 20.2 44.1
Bauer 3.96 4.72 4.47 4.30 11.5 36.8
3.74 17.2 43.1

So despite lower K-BB and ground ball percentages (leading to higher ERA predictors), the group’s ERA in the segment of the season when Gomes was reinstated is essentially exactly the same as from the first block of time with Perez.  Now, I am not a big believer in CERA because there is a high level of variation and too many unknown variables pertaining to how much of the responsibility/credit goes to the catcher, the coaching staff, or the pitcher; but I do think that it’s possible Gomes’ extra service time has enabled him to be more in tune with his staff as well as understand hitter tendencies better than Perez and Hayes.  I realize we’re getting into a gray area of intangibles, so I’ll reel it in with some results based on pitch usage%.

% Difference in Pitch Usage with Yan Gomes compared to Roberto Perez

Pitcher FB% CT% SL% CB% CH% SF%
Corey Kluber -9.0 8.8 -17.3 5.0
Danny Salazar 9.8 -12.6 -4.4 17.1
Carlos Carrasco -6.5 9.4 49.2 13.3
Trevor Bauer -2.9 -15.0 -8.9 78.5 25.8

Using BrooksBaseball Pitch f/x data, let’s painstakingly find out how different each pitcher’s pitch usage was in regards to different counts, or better known as Pitch Sequencing.  We’ll look at first pitches, batter ahead counts, even counts, pitcher ahead counts, and 2 strike count situations.  As good as pitch f/x is, the data still isn’t perfect.  There may be discrepancies if you look at usage at Brooks compared to the usage at FanGraphs, so for each pitcher we’ll split the pitches up into three categories: Fastballs (four-seam, sinkers, cutters), Breaking Balls (sliders, curve balls), and Change Ups (straight change/split finger) – I’m aware that splitters are “split fingered fastballs”, but I liken them to change ups more because of the decreased spin rate and generally lower velocity.

*Having a table for each pitcher in regards to pitch sequencing made this article quite messy, so I’ve included a downloadable Excel file, and briefly touched on each pitcher below.

Pitch Sequencing Excel Doc.

Corey Kluber

Looking at the data, Gomes stays hard with Kluber more than Perez until they get ahead in the count.  Perez swaps some early count fastballs for curve balls, but they both see his curve ball as a put-away pitch.  Gomes tends to trust Kluber’s change-up more than Perez later in counts and Perez likes it more earlier in counts.

Danny Salazar

Much like with KIuber, when Gomes catches Salazar, they have a tendency to stay hard early.  Gomes pulls out Salazar’s wipe out change up after they’re ahead whereas Perez will utilize it in hitter’s counts as well.

Carlos Carrasco

Carrasco has 5 good pitches and he’s pretty adept at throwing them for strikes in various counts which is why there is some pretty even usage across the board, at least in comparison to Kluber and Salazar.  There is quite a bit more usage of Carrasco’s secondary pitches in all counts and there are pretty similar patterns when Gomes and Perez are behind the plate.  With Hayes, it doesn’t look like there is much that changes in sequencing until there are two strikes on a hitter.

Trevor Bauer

Bauer is probably a difficult pitcher to catch because of the number of pitches he has and the constant tinkering in his game.  Side note: Gomes is the only catcher to have caught a game in which Bauer threw cutters, and in their last game together, Bauer threw absolutely no change-ups or splits.  Bauer’s highest level of success has come with Hayes behind the plate and perhaps that’s from their willingness to expand his repertoire in more counts than Gomes and Perez do, but there is no way I can be certain of that.

Pitch sequencing can effect the perceived quality of each pitch and therefore, can produce more favorable counts as well as induce higher O-Swing and SwStrk percentages (or less favorable and lower).  So despite the framing metrics favoring Perez, the group throws more strikes with Gomes and also induces more swings at pitches outside the zone – although, as previously noted, there is some regression with Gomes behind the dish in terms of SwStrk% and K-BB%.
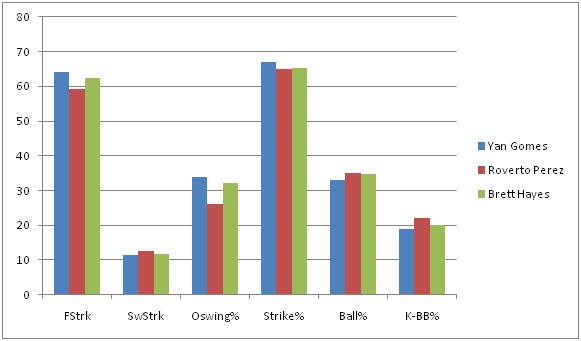
swing tendencies


aaa0ide


**These graphs represent numbers through the entire season to garner a bigger sample size.

With lower line drive rates and more medium + soft contact, and (in the case of the Indian’s defense), more fly balls, a conclusion could be jumped to that the staff’s BABIP has trended downward since Gomes regained his role.  A look at BABIP throughout the course of the season:

babip


Woah!  It was well above league average in April and then plateaued at just above league average through mid June, but has been plummeting ever since.  Obviously a catcher is not responsible for this dramatic of a swing in BABIP, so the Indians’ defense must have improved.

June 16th – August 18th

The rotations’ traditional stats look even better if you use June 16th as the starting point:

Pitcher IP H K BB W ERA WHIP
Corey Kluber 84 61 82 16 5 3.11 0.92
Danny Salazar 71 46 69 23 5 2.79 0.97
Carlos Carrasco 77.1 56 77 13 3 2.91 0.89
Trevor Bauer 68.1 69 63 24 4 5.80 1.37
300.2 232 291 76 17 3.59 1.03


So let’s take a look at the Indians’ defensive alignment by month (Player listed is the player who received the most innings played at the position).


POS April May June 1 – 8 June 9 – 15 June 16 – 30 July August
C Perez Perez Gomes Gomes Gomes Gomes Gomes
1B Santana Santana Santana Santana Santana Santana Santana
2B Kipnis Kipnis Kipnis Kipnis Kipnis Kipnis Ramirez
3B Chisenhall Chisenhall Chisenhall Urshela Urshela Urshela Urshela
SS Ramirez Ramirez Aviles Aviles Lindor Lindor Lindor
LF Brantley Brantley Brantley Brantley Brantley Brantley Brantley
CF Bourn Bourn Bourn Bourn Bourn Bourn Almonte
RF Moss Moss Moss Moss Moss Moss Chisenhall

If you’ve paid attention to the Indians at all, you know they’ve made some trades and called up a couple prospects.  But just how different is the new defense?  Well, we only have a small sample with the current configuration, but it appears to be A LOT better. If BABIP wasn’t enough of an indicator, and it’s not, because there has to be some regression to the mean – it can’t stay that low – here are some numbers from the players who were playing the most in May compared to the players who are playing the most in August (again, numbers represent full-season stats):


MAY PLAYER FLD% rSB CS% DRS RngR Arm UZR UZR/150
C Perez .994 2.0 38.5 4
1B Santana .997 -6 0.0 0.7 1.2
2B Kipnis .988 4 4.5 3.6 7.0
3B Chisenhall .963 7 3.1 3.3 10.5
SS Ramirez .948 -2 -2.4 -5.2 -21.9
LF Brantley .992 1 0.3 -2.1 -1.4 -3.3
CF Bourn 1.000 4 -7.2 1.1 -5.8 -11.4
RF Moss .975 -4 1.7 -2.5 -1.1 -1.8
AUG PLAYER FLD% rSB CS% DRS RngR Arm UZR UZR/150
C Gomes .996 0.0 35.0 1
1B Santana .997 -6 0.0 0.7 1.2
2B Ramirez 1.000 1 1.1 2.8 23.2
3B Ursehla .973 2 4.5 6.0 15.7
SS Lindor .967 6 6.0 4.9 14.9
LF Brantley .992 1 0.3 -2.1 -1.4 -3.3
CF Almonte 1.000 2 0.4 -0.2 0.9 10.0
RF Chisenhall 1.000 4 1.6 0.5 2.3 27.3

What’s interesting is that the biggest difference in the infield is Francisco Lindor (Giovanny Urshela has been very solid, but Chisenhall was pretty similar this season at 3B).  I’m sure someone at FanGraphs could churn out a really cool article (if someone hasn’t already) that shows us a quantifiable difference an above average to well above average shortstop makes for a team even if you just keep the rest of the infield the same, as the control.  The 2015 Tigers come to mind – a healthy Jose Iglesias has made a difference for a team that still features Nick Castellanos at 3B and Miguel Cabrera at 1B.  Teams are willing to sacrifice offensive contributions if a SS has elite defensive skills (Pete Kozma, Andrelton Simmons, Zack Cozart to name a couple off the top of my head).  Lindor, to this point, has been an above average offensive player, too, so this could be special.

At this point the Indians are in last place and are out of contention.  Abraham Almonte is their starting center fielder and with Kipnis back from the DL, Jose Ramirez is not playing 2B, but is instead getting reps in left field while Michael Brantley DHs due to his ailing shoulder.  Perhaps all this means is that they don’t have better replacements; OR PERHAPS they’re planning to establish a more defense-oriented squad next year…

Now there’s no doubt that this research has led to some frustrating conclusions.  With Gomes behind the plate, the K rate and GB rate of the staff has trended in the wrong direction in regards to ERA indicators; so is the difference in the batted ball profile plus an improved defense enough to make up for these facts?  This small sample size thinks so, but it could 100% just be noise.  However, there are clubs that are succeeding by using similar tactics right now:

Team ERA FIP ERA-FIP GB% (rank) SOFT% (rank) OSWING% K-BB% (rank)
Royals 3.57 3.93 -0.36 42.1 (29th) 18.1 (16th) 30.9 (19th) 10.5 (26th)
Rays 3.63 3.79 -0.16 42.4 (28th) 18.7 (13th) 31.2 (17th) 14.8 (7th)
Indians (as a reference) 3.85 3.65 0.20 44.7 (17th) 18.2 (15th) 33.3 (2nd) 16.9 (1st)

Granted, the Royals and Rays have the 1st and 2nd best defenses in baseball, and their home parks play differently than the Indians, but they also don’t boast the arms the Indians do.

The Indians have their noses deep in advanced metrics and having rid themselves of Swisher, Bourn, and Moss during 2015’s trading period has allowed them to deploy a better defensive unit which has amplified their biggest strength – their starting pitching.  Furthermore, their unwillingness to move any of their top 4 starting pitchers also leads me to believe they see next year as a time for them to compete.  I’m not going to speculate what moves the Indians will make in the offseason, but I hope they stick with this defense-oriented situation they have gone with recently because it’s been working (and because I own a lot of shares of Kluber, Carrasco, and Salazar in fantasy).
