Archive for Atlanta Braves

Getting to Know Braves Closer Luke Jackson

In a 2019 season that has started with so many bullpens struggling (and yes, Craig Kimbrel still unemployed to this date), we still have relievers that have been brilliant thus far, some of them more surprising than others. That category of the surprising includes our guy, Luke Jackson.

Jackson, a 27-year-old righty from Fort Lauderdale, is in his third season with the Braves. He might go unnoticed if: a) one does not watch Atlanta much or b) one only looks at the current leaderboards in most metrics. By traditional stats, for example, he barely cracks the top 100 relievers in ERA (a three-run ninth on Tuesday in San Francisco took him away from the top 50) and is well below Kirby Yates’ 20 saves. As we move to advanced metrics, we see him climb higher, though still far from the leaders. His 2.24 xFIP ranks him eighth in the big leagues but well below Josh Hader’s 1.59 that currently leads the NL. While we are still early in the season and a few bad outings could hamper his (or any reliever’s) numbers, Jackson deserves to be looked at, mostly because he is changing Braves fans’ opinion from “this guy again?” to a growing sensation of security when he comes up to pitch. And that has not gone unnoticed for Brian Snitker, to whom he has now become the closer and the guy who handles most of high-leverage situations.

After a spring training that included two awful outings against the Astros and Red Sox, Jackson cracked the Opening Day roster and saw action on March 28th, on the first game of an opening series that was a catastrophe for the Braves, and especially for the bullpen. He entered to pitch the 6th inning with Atlanta trailing Philadelphia 6-3, and less than twenty pitches later, the game was as good as lost. A walk and a throwing error of his own set up the frame. The Braves intentionally walked Bryce Harper, and behind him, Rhys Hoskins hit a grand slam that put the final nail in the coffin. Twenty-two appearances later, the only extra bases he has allowed are a homer by David Peralta (who has been mashing against the Braves) and three doubles, and most importantly, he has allowed only five runs, three of them in that blown save earlier this week. Despite that, he holds a 1.80 ERA if we take out his horrid season debut.

Why so much attention on a pitcher that so far has shown nothing else than a great start to the season after more than 100 career innings of subpar pitching? Because this season is the best he has had since his debut in the big leagues with the Texas Rangers back in 2015, and this stretch (which included 14 appearances without allowing a run) already accounts for hist best one in The Show. Thus, it sure would be nice to (at least try to) analyze why. Read the rest of this entry »


The Atlanta Braves Have no Fear of Swinging

The austere face of Freddie Freeman; the resounding crack of Dansby Swanson’s bat; Ozzie Albies brimming smile – these are the surprising Atlanta Braves whose description is no longer surprising, but partial to a definitive fun run through the National League East. The Braves are baseball joy with a mix of relaxed confidence, even brimming optimism. A brimming optimism that has little been partial to any of the Braves players in the past.

A sort of confidence is sweeping the organization as every player is contributing, allowing each player to be distinctly themselves. No longer does Swanson have to turn himself into an all-star, slugger defined hitter, but a second-year player still learning. Nick Markakis can take time to become more confident in a refinement of his mechanics.

The simple undertone is two-fold; the Braves batting lineup is simultaneously playing at a career high, which has allowed the Braves batting lineup to refine their optimal batting throughout the first half of the season. The dominoes fell right, and the Braves learned how to optimize, cutting their progression time in half through analytical chemistry. Second, the one point that defined their functional progression: they have no fear of swinging, second highest in the MLB at 48.6 percent combined with the third highest contact percentage at 79.6 percent.

The odd perception is that swinging this high would lead to inappropriate risk. And for most developing teams, it has. The Detroit Tigers, Kansas City Royals, Chicago White Sox, and Baltimore Orioles round out the top five in swinging percentage, each with a resulting high swinging-strike rate. The Braves, however, have a 9.9 percent swinging-strike rate, eighth best in the MLB. The magic is not accidental due to a combination of veterans who are more patient and, young, power hitters whose slugging means swinging more is appropriate. Nick Markakis has a 4.8 percent swinging-strike rate and Kurt Suzuki is at a mere 7.5. This does not excuse Swanson or Freeman posting 11.7 and 11 percent swinging-strike percentage, respectively, but it allows them to take those extra risks to optimize slugging opportunity.

Suzuki has been an enigma for the Braves, but one of the most important supporting pieces to their run creation. After going his entire career with only one season at a wRC+ over 100 (Minnesota Twins, 2014, 106), Suzuki is now on pace to break his 129 wRC+ and tie his 2.7 WAR from last season. There might not be a coincidence that these two seasons have also seen him break the 50-percent swing margin (52.8 and 53.6 percent) while maintaining a high contact rate, specifically in the zone (93.5 percent this season).

Suzuki’s resolution has come on the backward notion to stop attempts to hit the ball opposite (below 20 percent of hits) instead opting to pull the simply pull hits for apt run creation. His placement map dictates he is better at hitting sharp, pulling balls, and his hits to opposite field were traditionally drab and futile with long hang-time. Hence, an allowance to be better at playing Suzuki baseball and not a league meta-style.

While Suzuki has added value by changing his batting style, there is Nick Markakis who is playing the exact same baseball, just with better contact and providing better leverage. He is hitting well above his career average in ISO at .160 while striking out remarkably lower at only 10.2 percent of pitches. His batted ball profile remains the same, making Markakis a player benefitting from the simple adage of relaxed baseball and improving at tearing pitchers apart in high-leverage situations.

Ozzie Albies, in his second season for the Braves, has already blown away a good first season, posting a 2.4 WAR with a 118 wRC+ (1.9, 112 in 2017). Much like Markakis, Albies has been a run creating machine with high-leverage situation hitting. He doubles down on chaos creation by forcing pitchers to throw uncomfortably away from the zone, less he turns a pitch for a deep slug shot. Albies has refined his slap-shot hitting by achieving his best slugging percentage in the bottom of the zone; thus as pitchers throw breaking-balls and off-speed pitches to derive poor contact, and those pitches drift, Albies is not only able to make contact, but make derisive contact.

The macro change has come with a micro improvement on finding the changeup. He has starkly increased his contact percentage, now above 85 percent in all but two zones. Last season he was above 80 percent in only four of nine zones. Albies is sending more of that contact higher into the air, a bit of a downside to the slugging revolution, but at the same time, is expanding his placement map. He has placed more balls sharply under three seconds of hang time, specifically under 1.5 seconds, implicating an ability to send even soft contact for hits. The career-trajectory implication is Albies is developing an ability to be a rounded hitter, known for more than homeruns.

That then is how the Braves have become a team still fighting into the July trade deadline; a buyer and not a depressed seller. The sudden power from the veterans meant the younger players had time to relax and optimize their best ability, creating a waterfall effect. The Braves have the best high-leverage analytics in the MLB because they find ways to creatively get on base, and those veterans now have players to send home.


The 2017 Atlanta Braves: A .500 Team?

The 2016 Atlanta Braves were built to suck.  After all, starting a season 0-9 basically kills any hope left in the fan base, and gets them prepared for the contagious losing.  For the few fans who paid to go see their beloved Braves play in the now retired Turner Field, losing 93 games is heartbreaking.  A large volume of articles exists detailing the extent at which the Atlanta Braves, under both John Hart and John Coppolella, are remodeling their organization.  This article serves the purpose of examining one thing:

2016 Atlanta Braves


Record

Runs Scored Runs Against

Run Differential

First Half

31-58 307 414 -107

Second Half

37-35 342 265

-20

That’s right! The 2016 second-half Atlanta Braves won more games than they lost!  If you did not already know this you either (a) are not a Braves fan, or (b) could not manage to care less.  However, this could have some real value behind it.  While the Braves managed to be outscored by 20 runs in the second half, they still managed to win two more games than they lost.  They scored 35 more runs in 17 fewer games.  Their runs/game increased 3.45 to 4.75, which would have placed them in between the Mariners and Cardinals in that regard had it been 4.75 the entire 2016 season.  The most important takeaway is how much better the second-half Braves were at preventing runs — 149 fewer runs allowed than in the first half.  Shaving off that many runs in only 17 fewer games is huge.

But let’s not get ahead of ourselves.  A winning record is unsustainable at a deficit of 20 runs in 72 games.  But I am not asking whether the 2017 Atlanta Braves can win even 82 games.  Can they win 81?  Could the great finish down the stretch of the 2016 season carry over into 2017?  While going .500 is technically meaningless because a .500 team will not make the playoffs, not losing more than they win in the new SunTrust Park will energize the organization and the fan base, and prepare the team for future success.

When the 2016-2017 offseason kicked off, the Braves signed two popular starting pitchers, and acquired one via trade, to eat innings so their crop of young pitching could ripen on the farm.

Braves 2017 Offseason Acquisitions (2016 Statistics)


Record

ERA FIP BB/9 K/9 WHIP

WAR

Bartolo Colon

15-8 3.43 3.99 1.50 6.01 1.21

2.9

R.A. Dickey

10-15 4.46 5.03 3.34 6.68 1.37

1.0

Jaime Garcia 10-13 4.67 4.49 2.99 7.86 1.37

1.2

Two of the three had subpar years in 2016.  The other one became an internet sensation for his antics in the batter’s box and even hit a homer against the San Diego Padres.  But let’s assess what each pitcher brings to Atlanta’s rotation.

Bartolo Colon ages like a fine wine.  His ERA was better last year than any Atlanta starter except Julio Teheran.  While pitching record is not a statistic to measure performance, it is worth noting he won more games last year than any Atlanta starter.  He was better pretty much across the board than anyone not named Julio Teheran.  But can he keep this level of production up?  I would like to think so.  His two-seam velocity has stayed relatively consistent over the past three years.  All the Braves should ask Colon to do is turn in around 20 quality starts (he turned in 19 last year).  Consistency was a hallmark of his time with the Mets, and should continue in Atlanta for at least the 2017 season.

The other old guy the Atlanta Braves picked up this offseason happens to be knuckleballer — R.A. Dickey, 2012 National League Cy Young Award winner.  While Dickey will more than likely not be in the running for any hardware as he nears his 43rd birthday, he can still meet the immediate needs of his new team.  From 2011 to 2015, Dickey’s lowest inning count was 208.2, and peaked in his legendary 2012 with 233.2 innings pitched.  This is what the Braves need.  They need Dickey to turn in a mountain of good, quality innings.  If he could get over 200 innings again, and remain viable at the big-league level, then it is mission accomplished.

The third major addition to the Atlanta rotation is southpaw pitcher Jaime Garcia.  On December 1 of last year, the St. Louis Cardinals accepted minor-league infielder Luke Dykstra, right-handed pitcher John Gant, and righty Chris Ellis for Garcia’s services.  First, let’s look at the positives of this — Garcia is a definite mid-rotation talent, who posted a 3.73 ERA in 31.1 IP and a 3.18 ERA in 28.1 IP in April and May of last year, respectively.  He gives Atlanta a lefty in a rotation filled with righties.  The downside?  His low ERAs early in the season turned into a 5.40 ERA in June and a 5.60 ERA in the second half of the season.  So much for success in the second half driving this article, right?  Let’s remain optimistic.  After all, that is the whole purpose of this.  Garcia’s HR/FB rate was up from 7.1% in 2015 to a ghastly 20.2% in 2016.  He got consumed by the league-wide power surge.  I do not think such a high rate is sustainable or will happen again.

Let’s make a prediction.  Bartolo Colon makes us all fall back in love with “The Great Bart-Bino” all over again and he turns in around 16-20 quality starts for the upstart Braves.  Dickey, the workhorse of the staff, follows suit and dizzies batters with his knuckler for over 200 innings.  Garcia returns to early-2016 form, and posts something in the ballpark of 1.5 WAR.  Of course, the likelihood of all three scenarios playing out is small, but what I am trying to get across is it is possible.

Now, time to switch gears. The Braves lineup has changed its look dramatically since this time last year, sticking with a solid mixture of recognizable names and some guy named Dansby Swanson.  Here is a look at their projected Opening Day lineup:

2017 Atlanta Braves

Position

Name Bats 2016 WAR

Projected WAR

CF

Ender Inciarte L 3.8

2.5

SS

Dansby Swanson R 0.9

2.4

1B

Freddie Freeman L 6.5

3.7

LF

Matt Kemp R 0.0

0.0

RF

Nick Markakis L 1.7

0.5

2B

Brandon Phillips R 0.8

0.7

3B

Adonis Garcia R 0.2

0.2

C

Tyler Flowers

R 0.3

0.7

The projected WAR was retrieved from FanGraphs.com ZiPS projection

Look at the first half of their lineup.  To me, those three guys, Inciarte, Swanson, and Freeman, look like the core of a team poised to wreak havoc on the NL East before the end of this decade.  It is hard to project exactly what we are going to get out of Dansby Swanson, but most Braves fans and analysts expect him to take reign as the face of the franchise.

Starting in the leadoff spot is Ender Inciarte, who was brought over as icing on the cake in the Shelby Miller trade that landed Swanson and pitching prospect Aaron Blair.  In his first year in Atlanta, Inciarte posted a .732 OPS and won a Gold Glove for his outstanding play in center field.  I really could not think of a better leadoff guy for the Braves.  He is signed through 2021 at a team-friendly cost of $30.5 million, with a $9-million team option in 2022.  In his first years in the bigs, Inciarte has played in at least 118 games, posted a WAR above 3.7 (produced a figure of 5.3 in 2015), and shows no sign of slowing down as his prime years lay ahead. What if he crosses the 3.0 WAR plateau for the fourth time in four seasons, and maybe even adds another Gold Glove?  That is all his organization needs out of him.

Inciarte is a vital part of the Braves defense, which, according to 2017 PECOTA projections, leads the NL East in Fielding Runs Above Average (they are projected to attain an average figure of 3.6, while the other four teams are either at 0.0 or negative).  BaseballProspectus.com explains FRAA as an “individual defensive metric created using play-by-play data with adjustments made based on plays made, the expected numbers of plays per position, the handedness of the batter, the park, and base-out states.”  In short, the higher the number, the better the fielder, and vice versa.  The higher the team average, the better the team is overall in the field.  In his Gold Glove campaign, Inciarte registered a FRAA of 23.0, according to BP.  The graduation of Dansby Swanson and the addition of web-gem-prone second baseman Brandon Phillips will certainly strengthen the middle cone of the field.  Just how good is this team going to be at preventing runs?  Many projection systems think they will be around the top of their division, and many fans are excited to see the double-play tandem of Swanson and Phillips at work.

Freddie Freeman is the undisputed anchor of the lineup, and has finally seen the Braves ADD instead of SUBTRACT from the lineup around him.  The addition of Matt Kemp has helped tremendously.  With a recognizable slugger swinging behind Freeman, managers and pitchers had to pitch to him in the latter months of the year. With Kemp slotted behind him, Freeman hit to the tune of a .340/.456/.665 slash with 16 home runs and 18 doubles.  Kemp also matched the theme of this article with a strong second half — hitting .280/.336/.519 with 12 bombs in 241 plate appearances as a Brave.  The duo should have Braves fans excited for a full season of similar production from Freeman if Kemp is behind him.  Kemp, on the other hand, has a lower bar to pass, and could re-tool his value as an offensive player in his first full year off the West Coast.

So why is it unreasonable for the 2017 Atlanta Braves to win 81 games?  I do not think it is that far-fetched.  This article has not mentioned their incredibly deep farm system, which includes guys such as Ozzie Albies, Sean Newcomb, and Lucas Sims, but instead focuses on the immediate roster — a roster which has the potential to do unexpected things in 2017.  The dominoes would have to fall in all the right places, but this is baseball.  Anything is possible.

Theodore Hooper’s Official 2017 Atlanta Braves Prediction: 81-81


The statistics used in this study were found on BaseballProspectus.com, Baseball-Reference.com and FanGraphs.com, and the rosters on RosterResource.com were a great help in referencing players and transactions. 


Why Doesn’t Mauricio Cabrera Strike Out More Batters?

For many years, the undisputed king of velocity in Major League Baseball has been Aroldis Chapman, with his fastball that averages around 100 mph and regularly reaches higher. Few pitchers have even been able to approach the level of Chapman’s fastball since he came into the league, and none have surpassed him. However, in 2016, one pitcher finally did it. Mauricio Cabrera of the Atlanta Braves averaged nearly 101 mph on his fastball in 2016 and he regularly touched 103; but yet there was still a major difference between Cabrera and the incredible Chapman. Chapman struck out over 40% of the batters he faced last year, while Cabrera struck out less than 20%. Strikeouts are intuitively related to fastball velocity. The faster that a pitcher can throw the ball, the less time a batter has to react, making it harder to make contact. So how does a pitcher such as Cabrera, who throws as hard as anyone in the game, strike batters out at a well below-average rate?

I first thought that maybe his perceived velocity is not as great as his actual velocity, and sure enough Cabrera does gets very little extension toward the plate when he delivers the ball. He only extends about six feet toward the plate before he releases the ball, which is a full foot shorter than fellow reliever, Zach McAllister, and several inches shorter than average for fastball-heavy relievers. This lack of extension means that the velocity that the batter perceives is slower than the actual velocity coming out of Cabrera’s hand, because it has farther to travel before it gets to the plate. However, this is only a minor difference, as Cabrera’s perceived velocity is still above 100 mph. This is not a huge drop, but it does bring him closer to the pack, as many relievers get good extension that increases their perceived velocities above their actual velocities. Chapman, for instance, gets great extension toward the plate on his already incredible fastball, which results in his excellent perceived velocity of over 101 mph. Cabrera’s lack of extension is likely a contributing factor to his low strikeout numbers, but it does not seem to be the main culprit.

Next, I wanted to see if there was something about the spin rate on his fastball that doesn’t lend itself to strikeouts. Spin rates correlate quite strongly with strikeout rates. Pitchers with high spin rates on their fastballs typically generate more swings and misses, and thus more strikeouts. It turns out that Mauricio Cabrera does have a low spin rate on his fastball. His fastball spin rate of 2300 rpm is well below average for fastball-heavy relievers, which is probably a major reason why he doesn’t miss many bats.

While it makes intuitive sense that something like the amount of spin on his fastball could be the reason for his low strikeout totals, it is still puzzling to see that his spin rate is so low, because spin rate is typically correlated with velocity. For most pitchers, the harder you throw, the more spin you will put on the ball. Aroldis Chapman, for example, has one of the highest spin rates in the sample. In order to single out the spin rate from the velocity, I divided the spin rate by the velocity to find the Bauer Unit, named after Indians pitcher Trevor Bauer. Cabrera’s average Bauer Unit of 22.85 is one of the lowest in the entire sample of fastball-heavy relievers. This means that he has some of the lowest spin per MPH in the game. There must be something inherent in how Cabrera throws a baseball that just doesn’t allow him to generate the amount of spin that is typically commensurate of how fast he throws.

Cabrera’s low spin is not all bad, though. Just as high spin rates lead to strikeouts, low spin rates lead to ground balls. An average spin rate is really where you don’t want to be, as those are the pitches that get squared up more often. While Cabrera actually has an above-average spin rate for the entire population of major-league pitchers, his spin rate is one of the lowest in the league compared to his velocity. This effectively makes him a low-spin pitcher, and last year’s batted-ball numbers bear that out. Nearly 50% of the batted balls Cabrera gave up last season were on the ground, and he didn’t surrender a single home run all season despite giving up the hardest average exit velocity in the game last year on his fastball. Cabrera got away with that extreme exit velocity by only allowing an average launch angle of 5.9 degrees, which was one of the lowest among the fastball-heavy relievers. It is hard to do much damage on balls hit on the ground, even if they are hit 95 mph. While the myth that the harder the ball is thrown the harder the ball can be hit has largely been disproved, it is interesting to see that the pitcher who throws the hardest also gave up the highest average exit velocity.

Of course, strikeouts aren’t just about swinging strikes; you have to get called strikes as well. Throughout Cabrera’s minor-league career, he struggled to throw strikes consistently. So much so that many thought his strike-throwing ineptitude might prevent him from ever even reaching the big leagues. However, once he started pitching in the majors, he suddenly discovered how to find the strike zone. Of course, walking four and a half batters per nine innings is still poor, but that mark represented his lowest walk rate since rookie ball in 2012. Even with the high walk rate last year, he actually threw strikes at an above-average rate. His Called Strike Probability, according to Baseball Prospectus, was 47%, which is slightly above league average. For a guy like Cabrera who has always struggled with control, it is probably a good thing to see him filling up the strike zone at an above-average clip. However, the tendency to pitch within the zone could result in more contact and thus bring his strikeout numbers down. Since he doesn’t command his pitches well, he cannot nibble at the corners or trust himself to throw his pitches just off the plate to generate swings and misses. This allows hitters to either lay off pitches that are safely outside, or lock in to the pitches that are squarely in the zone. This could be another significant cause for his lack of strikeouts.

Another reason Cabrera doesn’t strike out many batters is because he doesn’t possess a bat-missing secondary offering. His secondary pitches are all used primarily to get hitters off of his fastball. He throws the hardest change-up in baseball at 91 mph, and a mid-80s slider with good depth. The change-up got squared up pretty often in 2016, which makes sense, seeing that he throws the pitch with the velocity of a league-average fastball. The slider also does not get many whiffs, but hitters were not able to do much damage off of it in 2016. Batters only slugged .136 off of his slider last season, and the pitch generated the highest rate of fly balls of any slider in the game. Perhaps what is even more significant is that hitters had an average exit velocity against his slider of 85 mph and an average launch angle of 30 degrees. For reference, hitters that hit the ball with an exit velocity of 85 mph at a 30-degree launch angle went 4 for 72. His slider may not be a swing-and-miss offering, but it sure seems to be a good out pitch for him.

It looks like Cabrera’s low spin rate on his fastball relative to its velocity is the main reason for his lack of strikeouts. However, it is also likely that that same low spin rate allows him to induce an extreme amount of ground balls, which helps him limit the damage from the opposing batter. His lack of extension toward the plate and his tendency to live in the strike zone are also contributing factors. He also doesn’t have a secondary offering that gets many swings and misses. His slider, however, does produce a great deal of pop-ups, which is another way he limits damage on his batted balls. A major reason for his success last season despite his low strikeout totals and high walk numbers was that he didn’t give up any home runs. While a complete lack of dingers is very unlikely to persist, the types of batted balls he allows on his fastball and slider make it difficult for batters to hit it deep off of him.

Cabrera walks too many batters, and while I wouldn’t be surprised to see some progression in his strikeout rate, I don’t expect him to ever strike out batters at the same rate as someone like Chapman. He should be able to persist for several years as a good late-inning reliever, but he probably will never reach the elite levels that his fastball might suggest.


The Braves Might’ve Fleeced the D-Backs Out of $225 Million

Who got the most out of the Shelby Miller trade?

At the moment, based on present values of prospects, players and wins? It’s the Braves. Based on the industry consensus? It’s the Braves. Based on which team will be better next season? Maybe still the Braves. How did Arizona get so comprehensively fleeced in this deal? There have been some great articles written on FanGraphs these past two weeks about the GM of the Arizona Diamondbacks. Dave Stewart seems to want to do things differently from all other teams, going with his gut when building a roster. Gut decisions can work. His gut identified Shelby Miller as a good player and so wanted him on his team. But wow did this gut decision miss something. How much something? How about 225 million dollars?

That’s right, I am suggesting that, with present values of prospects, players and wins, Dave Stewart, GM, gave away $225M more value in this trade than he got back. See below for how I got to that number.

FanGraphs’ staff have been using a great contract tool recently to estimate the value of major-league free agents. It estimates that players get better each year until aged 27 then worse each year after reaching 31. I’ll be following their method, which estimates an aging curve using WAR where players improve by 0.25 WAR each year in their 18-27 age years, keep steady WAR in their 28-30 age years and get worse by 0.5 WAR each year in their 31-37 age years. It also includes an inflation increase in the market value for each WAR, starting at $8.0M in 2016 and increasing by 5% each year going forwards.  We end up with an estimated value for players over the lifespan of their contract.

I’m going to use last season’s FanGraphs WAR as the starting value for any major-league players (I’ll discuss the minor-league prospects later). I realise I could use ZiPS or many other predictors of players performance (which offer much lower WAR values), but it seems fair as both major-league players in the deal have some issues with their peripheral numbers that seem to balance out. The tool is an estimator based on current performance, so it seems fair we start with what they achieved this last year. Anyway, let’s get started.

The Major Leaguers

Shelby Miller (worth $98.48 M) – to Arizona

Year Age WAR $/WAR Est. Value
2016 25 3.65 $8.0 M $29.20 M
2017 26 3.90 $8.4 M $32.76 M
2018 27 4.15 $8.8 M $36.52 M
Totals   11.7   $98.48 M


Ender Inciarte (worth $172.91 M) – to Atlanta

Year Age WAR $/WAR Est. Value
2016 25 3.55 $8.0 M $28.40 M
2017 26 3.80 $8.4 M $31.92 M
2018 27 4.05 $8.8 M $35.64 M
2019 28 4.05 $9.3 M $37.67 M
2020 29 4.05 $9.7 M $39.29 M
Totals   11.7   $172.91 M


Holy cow! Not looking good for Arizona already. Shocked how much Inciarte is worth by this model? Me too. Those wins get expensive. He’ll do well to keep his performance at this level, but I’d argue that Miller has the same issue.

The Minor Leaguers

This isn’t quite as simple to work out. Minor-league players have a habit of not making it to the majors (an average 70% bust rate of ranked players not making a significant contribution to the major league team, according to this excellent article by Scott McKinney). I have used the valuations on ranked MLB prospects from Kevin Creagh and Steve DiMiceli with a couple of modifications.

Summarised, using historical prospect rankings, they took prospects ranked between 1-100 in the top prospect rankings each year and found the average WAR produced over their first six major league seasons at different rankings. These values are in the table below:

Tier Number of Players Avg. WAR Bust % Zero WAR or less
Hitters #1-10 53 15.6 9.43%
Hitters #11-25 34 12.5 8.82%
Hitters #26-50 86 6.8 31.4%
Hitters #51-75 97 5.0 44.33%
Hitters #76-100 96 4.1 41.67%
Pitchers #1-10 18 13.1 0%
Pitchers #11-25 47 8.1 27.66%
Pitchers #26-50 77 6.3 24.68%
Pitchers #51-75 94 3.4 47.87%
Pitchers #76-100 105 3.5 44.76%

Creagh and DiMiceli were looking at surplus value produced by a prospect. I’m more interested in total value. For each ranked prospect (Blair and Swanson) I found the average WAR produced by historical players with a similar prospect ranking (potentially flawed; I’d probably prefer median WAR for each group), then used an inflation model (again 5% per year starting at $8.0M/WAR in 2016) and an assumption that 2/3 of a prospect’s value is accrued during years 4-6 in the majors to find an estimate for total value.

Finally, some minor-league prospects don’t improve enough to reach the majors (they “bust”) so they aren’t as valuable as major-league players. This reduces the value of the prospect. Lower-ranked players are more likely to bust than higher ones so they should have a greater reduction in their value. The historical likelihoods of a prospect bust are shown in the table above (Bust % Zero WAR or less) for different ranks of prospect (again from Creagh and DiMiceli).  To account for the chance of a prospect bust I reduce their value by a factor of the bust percentage, taken from the table above (% Zero WAR or less). It isn’t perfect, but seems reasonable, I’m happy to discuss in the comments.

Dansby Swanson (worth $137.2M) – to Atlanta

  • #10 prospect currently (on MLB.com)
  • Hitter
  • Worth 15.6 WAR on average in years 0-6
  • Arrives in majors in 2017
  • 33% of value in years 0-3 (at 2018 cost per WAR) – 5.2 WAR – $45.76M
  • 67% of value in years 4-6 (at 2021 cost per WAR) – 10.4 WAR – $105.04M
  • Bust chance of #10 hitting prospect – 9%
  • Estimated total value – $137.2M

Aaron Blair (worth $14.85M) – to Atlanta

  • #61 prospect currently (on MLB.com)
  • Pitcher
  • Worth 3.4 WAR on average in years 0-6
  • Arrives in majors in 2016
  • Assume only lasts 3 years in majors (due to low WAR total)
  • 100% of value in years 0-3 (at 2017 cost per WAR) – 3.4 WAR – $28.56M
  • Bust chance of #61 pitching prospect – 48%
  • Estimated total value – $14.85M

Gabe Speier (worth $negligible) – sorry Gabe – this trade wasn’t about you.

Final value totals

Arizona:

  • Shelby Miller – $98.5M

Atlanta:

  • Ender Inciarte – $172.9M
  • Aaron Blair – $14.9M
  • Dansby Swanson – $137.2M
  • TOTAL – $325M

DIFFERENCE IN VALUE – $226.5M

There are a number of obvious caveats here. Miller could be better than this, Inciarte may not be that good, Swanson may never make it, Blair may never make it. However, at this moment, these are some of the values that you could reasonably ascribe to these assets. This is a staggering loss for Arizona. In what business can you lose $225M dollars in one transaction and keep your job? By this rather flawed measure, the Braves have just increased the value of their organisation by $225M. That pays for half a new stadium. Or Jason Heyward’s recent contract. Or the next 3 years of performance of Mike Trout (Trout is seriously valuable). I realise that the money can’t be accessed like that, but still, wow. Dave Stewart might be using his gut feeling when making deals, but he’d better start listening more to his analytics department or he’s liable to get robbed again.


A lot of the inspiration (it wasn’t plagiarism, honest) for this article came from Craig Edwards and his piece on “Attempting to rationalise the Shelby Miller Trade”. I just took it a different way. Thanks to Craig though! You should read it – http://www.fangraphs.com/blogs/attempting-to-rationalize-the-shelby-miller-trade/


Who Won the Kimbrel Trade?

Wow. Craig Kimbrel traded right before the start of the season. I have to admit to being rather shocked. I know the Braves are rebuilding this off-season and it made sense to trade him. He is very highly valued for a player who only pitches 60 innings a season, perhaps over-valued. If the Braves are going to be hopeless this year then who needs a dominant single-inning pitcher?

The trouble is I love watching Kimbrel pitch, no matter the situation. I live in London, in the UK, so a lot of Braves games happen from 1-4am and I don’t get to watch them live. Every morning I use my MLB.com subscription to check the last night’s action. If I don’t have the time to watch the whole game, which is common, I skip to the innings where the Braves scored plus any inning Kimbrel pitches. Pace, a banana curveball and strikeouts, Kimbrel is one of those rare players who is worth watching every minute he plays. Even when he is (rarely) hit you feel a strikeout is coming next. So emotionally, I hate to see him traded (just like I hated seeing Heyward traded). Lots of reporters are saying the trade is a good deal for both sides or an outright win for the Braves, so in emotional despair, I thought I’d have a proper look into it.

The facts of the trade

To the San Diego Padres:

  • Craig Kimbrel – 3 years at $34.75m (includes option buyout) or 4 years at $46.75m
  • Melvin Upton Jr – 3 years at $48.15m

To the Atlanta Braves:

  • Carlos Quentin – 1 year at $11m (includes option buyout) or 2 years at $18m
  • Cameron Maybin – 2 years at $16.2m (includes option buyout) or 3 years at $24.2m
  • 2 prospects and 41st pick 2015 draft

N.B. Bold text highlights the likely choices.

I’ll not be analysing the prospects in much detail, instead ignoring the less relevant trade pieces and looking at the end outcomes. My method is below, but if you like, skip to the summary, that’s the important bit.

Methods

From the Padres POV

  • Upton not wanted/needed. Treat him as a league-minimum replacement-level 5th outfielder for 3 years (cost $1.5m). Add the rest of his salary to the Kimbrel contract.
  • Dumped 2 unneeded players and $27.2m in contracts off the books. Remove these values as savings for the Kimbrel contract
  • Gained Craig Kimbrel. Assume option taken (it is great value – see later*). Contract for 4 years at $46.75m – $27.2m (from Quentin and Maybin savings) + $46.65m (Upton cost)
  • Given up 3 prospects (effectively); 1 good (Wisler), 1 risk (Paroubeck) and 1 draft pick

I feel these are all reasonable assumption/treatments. The Padres want Kimbrel, don’t care much about what they get from Upton (assuming he continues as in 2013-14) and used the Quentin and Maybin savings to pay for it all.

From the Braves POV

  • Quentin not wanted/needed (not sure why – seems a better bench bat than most and nobody will trade for him as they know they can get him for minimum once the Braves cut him). Add his contract to the 2015 payroll – $11m
  • Maybin – Assume continues poor health/form and option buyout is taken. Treat as decent defensive replacement OF (23 career DRS in 8 years). Possibly gets 75 games a season but produces nothing more than T.Cunningham in AAA so set effective salary to league minimum – $1m for 2 years. Add rest of his contract to 2015-16 payroll ($15.2m over 2 years)
  • Payroll changes:
    • Savings – Kimbrel ($46.75m – 4 years), Upton ($48.15m – 3 years)
    • Wastings – Quentin ($11m – 1 year), Maybin ($15.2m – 2 years) – both include buyouts
  • Receive 3 prospects (effectively); 1 good (Wisler), 1 risky (Paroubeck) and 1 draft pick

Again, I feel these assumptions/treatments are reasonable. Maybin may produce better than this, but his batting numbers were as bad as M. Upton the last few years (70-80 wRC+) so I don’t think we can expect much more of him than Melvin (apart from his defence being better).

Summary

Padres POV

  • Get Craig Kimbrel – effectively 4 years for $66.2m ($16.55m/year)
  • Get spare replacement-level 5th OF at minimum salary for 3 years
  • Lose 3 prospects; 1 good, 1 risky, 1 draft pick

Braves POV

  • Lose Kimbrel (and M.Upton)
  • Get spare replacement-level 4th OF at minimum salary for 2 years
  • Payroll savings $67.7m over 4 years ($16.9m/year average)
  • Get 3 prospects; 1 good, 1 risky, 1 draft pick

Analysis

Lots of contract money going back and forth, but the end result is that the Braves get payroll savings of around $17m a year for 4 years and 3 prospects and the Padres give up 3 prospects to get Kimbrel at a reasonable free agent price* of around $17m a year for 4 years.

If you consider that the Padres would have lost that 3rd prospect (the draft pick) if they signed Kimbrel as a free agent, the deal starts to look pretty good for San Diego and AJ Preller. The Padres almost certainly wouldn’t have been able to sign Kimbrel as a free agent with other teams competing (everyone needs a Kimbrel and the Dodgers/Yankees/Tigers/Red Sox etc all have the money for him). The contract would certainly have been longer as well (see footnote on Kimbrel’s historic value*). The Padres are paying Kimbrel a lot, but the amount is fair and they didn’t give up much.

The Braves had signed Kimbrel to a much friendlier contract than he would have got as a free agent (he’s homegrown and a Braves fan so gave a large discount – again see footnote*). Kimbrel gets $13m /year for his free-agent years, when he could have had much more. John Hart effectively used Kimbrel’s generosity to swap the spare value for 3 prospects, one of whom is extremely risky (Paroubeck) and one who is completely unknown (the draft pick). The Braves have rid themselves of Upton, but in taking back other contracts they have effectively only saved the money they should have been paying Kimbrel (had he not given a home discount).

In conclusion, John Hart basically declared he didn’t want a well-paid but high-value closer and swapped it for one good (but not great) prospect and two unknown prospects. So how do I feel now? I would have preferred to watch Kimbrel play for my team every week… Enjoy it San Diego.


*A footnote on Kimbrel’s free agent value

Craig Kimbrel is currently 26 years old and 10 months. Below is a summary list of contracts for comparable relievers and their ages when signing.

Reliever Contract Age at signing Average salary/year
David Robertson $46m – 4 years 29 $11.5m
Andrew Miller $36m – 4 years 29 $8.0m
Jonathan Papelbon $50m – 4 years 32 $12.5m
Koji Uehara $18m – 2 years 40 $9.0m
Joe Nathan $20m – 2 years 40 $10.0m
Mariano Rivera 38 $15.0m
Aroldis Chapman (arb2) $8m – 1 year 27
Greg Holland (arb2) $8.25m  – 1 year 29
Kenley Jansen (arb2) $7.425m – 1 year 27


You’ll notice that Kimbrel is younger than them all and although the average yearly value is not as high as Kimbrel’s $13.0m 2016 salary, the elite arbitration-eligible relievers are likely to beat them all (apart from maybe Rivera). If he were a free agent this last winter, you can assume that he would have been offered 5-year (and possibly longer) contracts.

Kimbrel’s career numbers are also historically unprecedented at his age. This has been said many times before, but my favourite Kimbrel stat is the WAR leaders for relievers over the last 10 years. Kimbrel has the 5th highest WAR from 2005-2014. He entered the league at the end of 2010. Since entering the league in 2010 he leads reliever WAR by 1.5 over Holland and Chapman (who have comparable service time). Before signing his (very team friendly) extension Matt Swartz estimated his first year of arbitration salary should be $10.2m. For a detailed analysis of how much Kimbrel is worth I recommend you read his article (http://bit.ly/1GEjKyT). The point being, he is probably worth at least a $17m/year, 4 year contract.


References

http://www.spotrac.com/mlb/san-diego-padres/melvin-upton/

http://www.spotrac.com/mlb/atlanta-braves/cameron-maybin/

http://www.spotrac.com/mlb/san-diego-padres/craig-kimbrel/

http://www.spotrac.com/mlb/atlanta-braves/carlos-quentin/

http://www.fangraphs.com/statss.aspx?playerid=5015&position=OF

http://www.fangraphs.com/statss.aspx?playerid=5223&position=OF

http://www.fangraphs.com/blogs/evaluating-the-prospects-san-diego-padres/

http://www.baseball-reference.com/players/r/riverma01.shtml

http://www.fangraphs.com/leaders.aspx?pos=all&stats=rel&lg=all&qual=y&type=8&season=2014&month=0&season1=2005&ind=0&team=0&rost=0&age=0&filter=&players=0

http://www.mlbtraderumors.com/2013/10/arbitration-breakdown-craig-kimbrel.html


A Different Way to Look at Strikeout Ability

Mike Podhorzer has looked into the relationship of a batters’ average fly ball distance as it relates to their HR/FB ratio, and has found results that will allow others to more accurately project a hitter’s home run totals from year to year.

This got me thinking. Which can be a good or bad, but in this case, the authors’ labor produced a fruitful return. While a hitters’ HR/FB ratio can fluctuate indiscriminately from year to year, Podhorzer has proven a batters’ average fly ball distance is a better indication of a player’s true talent power production. In the same light, my study looks at how a player’s swinging strike rate (SwStr%) is a better indication of a pitcher’s strikeout potential than K/9.

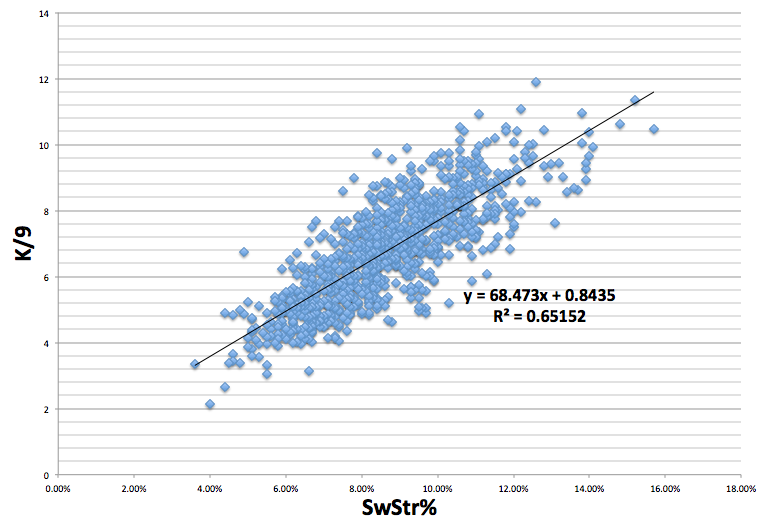
My assumption was that K/9 and SwStr% have a strong relationship. But, how strong of a relationship is it? To find this out, I took all qualified starter seasons from 2003 to 2013, which gave me a sample size of 933 pitchers, and ran a correlation between their SwSTR% and their K/9. The results showed that there is an exceedingly positive correlation between SwSTR% and K/9, to the tune of a .807 correlation coefficient and a .65 R2.

Screen shot 2013-10-03 at 1.06.11 PM

What is important to note is that there are very few pitchers present in the sample with a SwStr% above 13%, which may be symptomatic of something larger. Getting batters to swing and miss is difficult. The more often you can get a batter to swing and miss, the more valuable you are as a pitcher. As a result, the higher the SwStr%, the smaller the sample size becomes. For example, Johan Santana (2004) and Kerry Wood (2003) are the two lone dots to the farthest right on the graph with SwStr% of over 15: wow.

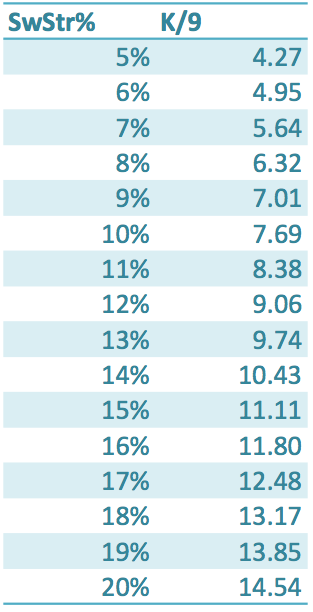
After the relationship between SwStr% and K/9 ratio became unmistakable, I calculated what a particular SwSTR%s translates into, as far as K/9, with the formula Y=68.473*x+0.8435, and got this chart:

Screen shot 2013-10-03 at 1.55.30 PM

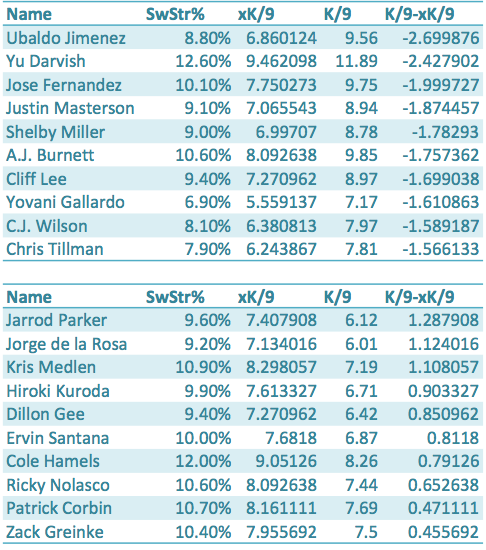
The next step is to take what we have discovered and apply it to a sample. The chart below shows each qualified pitcher for 2013, their SwStr%, xK/9, K/9, and K/9-xK/9.  xK/9 is what we would expect a pitcher’s K/9 to be based off of their SwStr%, and K/9-xK/9 shows us how much a pitcher over-performed or under-performed their SwStr% and xK/9.The first set of ten names are the pitchers who outperformed their xK/9 the most, and the second list of ten names are the players who underperformed their xK/9 the most.

Screen shot 2013-10-03 at 2.44.59 PM

The results show that Ubaldo Jimenez, Yu Darvish, and Jose Fernandez are the pitchers who have outperformed their xK/9 the most in 2013. These three pitchers also have great a great amount of deception and/or command (deception in Jimenez’s case: because, no one has ever called Ubaldo a control artist). And, while they may have outperformed their true talent in 2013 to an extent—they all had remarkable years—maybe that deception and control, which SwStr% does not take into account, leads to less swings by batters and more pitches taken for strikes, as opposed to swung at for strikes.

Perhaps xK/9 is more helpful when we look at pitchers who underperformed their SwStr%, like Jarrod Parker and Kris Medlen. Both of these pitchers had down years compared to what their projections suggested, but their xK/9s seem to be optimistic about their futures. Parker showed a .18 improvement in his K/9 from the first half to the second half of the season, while Medlen showed almost a full point improvement going from a 6.81 K/9 in the first half to a 7.67 K/9 in the second half.

While xK/9 may miss something—deception and command—when it comes to pitchers that outperform their SwStr%, xK/9 seems to find a reason to be optimistic when it comes to pitchers like Kris Medlen and Jarrod Parker who have underperformed their SwStr% and strikeout potential.

Devon Jordan is obsessed with statistical analysis, non-fiction literature, and electronic music. If you enjoyed reading him, follow him on Twitter @devonjjordan.